| Figure 7‑1: Stone Management Procedure Segmentation |
| Figure 7‑2: Urinary Incontinence Sling Market Segmentation |
| Figure 7‑3: Stone Management Regions Covered, Global (1 of 2) |
| Figure 7‑4: Stone Management Regions Covered, Global (2 of 2) |
| Figure 7‑5: Stone Management Procedures by Segment, Global, 2021 – 2031 |
| Figure 7‑6: Stone Management Procedures by Region, Global, 2021 – 2031 |
| Figure 7‑7: Stone Management Procedures by Country, North America, 2021 – 2031 |
| Figure 7‑8: Stone Management Procedures by Country, Latin America, 2021 – 2031 (1 of 2) |
| Figure 7‑9: Stone Management Procedures by Country, Latin America, 2021 – 2031 (2 of 2) |
| Figure 7‑10: Stone Management Procedures by Country, Western Europe, 2021 – 2031 |
| Figure 7‑11: Stone Management Procedures by Country, Central & Eastern Europe, 2021 – 2031 (1 of 2) |
| Figure 7‑12: Stone Management Procedures by Country, Central & Eastern Europe, 2021 – 2031 (2 of 2) |
| Figure 7‑13: Stone Management Procedures by Country, Middle East, 2021 – 2031 |
| Figure 7‑14: Stone Management Procedures by Country, Asia-Pacific, 2021 – 2031 (1 of 3) |
| Figure 7‑15: Stone Management Procedures by Country, Asia-Pacific, 2021 – 2031 (2 of 3) |
| Figure 7‑16: Stone Management Procedures by Country, Asia-Pacific, 2021 – 2031 (3 of 3) |
| Figure 7‑17: Stone Management Procedures by Country, Africa, 2021 – 2031 (1 of 2) |
| Figure 7‑18: Stone Management Procedures by Country, Africa, 2021 – 2031 (2 of 2) |
| Figure 7‑19: ESWL Procedures by Region, Global, 2021 – 2031 |
| Figure 7‑20: ESWL Procedures by Country, North America, 2021 – 2031 |
| Figure 7‑21: ESWL Procedures by Country, Latin America, 2021 – 2031 (1 of 2) |
| Figure 7‑22: ESWL Procedures by Country, Latin America, 2021 – 2031 (2 of 2) |
| Figure 7‑23: ESWL Procedures by Country, Western Europe, 2021 – 2031 |
| Figure 7‑24: ESWL Procedures by Country, Central & Eastern Europe, 2021 – 2031 (1 of 2) |
| Figure 7‑25: ESWL Procedures by Country, Central & Eastern Europe, 2021 – 2031 (2 of 2) |
| Figure 7‑26: ESWL Procedures by Country, Middle East, 2021 – 2031 |
| Figure 7‑27: ESWL Procedures by Country, Asia-Pacific, 2021 – 2031 (1 of 3) |
| Figure 7‑28: ESWL Procedures by Country, Asia-Pacific, 2021 – 2031 (2 of 3) |
| Figure 7‑29: ESWL Procedures by Country, Asia-Pacific, 2021 – 2031 (3 of 3) |
| Figure 7‑30: ESWL Procedures by Country, Africa, 2021 – 2031 (1 of 2) |
| Figure 7‑31: ESWL Procedures by Country, Africa, 2021 – 2031 (2 of 2) |
| Figure 7‑32: Holmium Laser Procedures by Region, Global, 2021 – 2031 |
| Figure 7‑33: Holmium Laser Procedures by Country, North America, 2021 – 2031 |
| Figure 7‑34: Holmium Laser Procedures by Country, Latin America, 2021 – 2031 (1 of 2) |
| Figure 7‑35: Holmium Laser Procedures by Country, Latin America, 2021 – 2031 (2 of 2) |
| Figure 7‑36: Holmium Laser Procedures by Country, Western Europe, 2021 – 2031 |
| Figure 7‑37: Holmium Laser Procedures by Country, Central & Eastern Europe, 2021 – 2031 (1 of 2) |
| Figure 7‑38: Holmium Laser Procedures by Country, Central & Eastern Europe, 2021 – 2031 (2 of 2) |
| Figure 7‑39: Holmium Laser Procedures by Country, Middle East, 2021 – 2031 |
| Figure 7‑40: Holmium Laser Procedures by Country, Asia-Pacific, 2021 – 2031 (1 of 3) |
| Figure 7‑41: Holmium Laser Procedures by Country, Asia-Pacific, 2021 – 2031 (2 of 3) |
| Figure 7‑42: Holmium Laser Procedures by Country, Asia-Pacific, 2021 – 2031 (3 of 3) |
| Figure 7‑43: Holmium Laser Procedures by Country, Africa, 2021 – 2031 (1 of 2) |
| Figure 7‑44: Holmium Laser Procedures by Country, Africa, 2021 – 2031 (2 of 2) |
| Figure 7‑45: PCNL Procedures by Region, Global, 2021 – 2031 |
| Figure 7‑46: PCNL Procedures by Country, North America, 2021 – 2031 |
| Figure 7‑47: PCNL Procedures by Country, Latin America, 2021 – 2031 (1 of 2) |
| Figure 7‑48: PCNL Procedures by Country, Latin America, 2021 – 2031 (2 of 2) |
| Figure 7‑49: PCNL Procedures by Country, Western Europe, 2021 – 2031 |
| Figure 7‑50: PCNL Procedures by Country, Central & Eastern Europe, 2021 – 2031 (1 of 2) |
| Figure 7‑51: PCNL Procedures by Country, Central & Eastern Europe, 2021 – 2031 (2 of 2) |
| Figure 7‑52: PCNL Procedures by Country, Middle East, 2021 – 2031 |
| Figure 7‑53: PCNL Procedures by Country, Asia-Pacific, 2021 – 2031 (1 of 3) |
| Figure 7‑54: PCNL Procedures by Country, Asia-Pacific, 2021 – 2031 (2 of 3) |
| Figure 7‑55: PCNL Procedures by Country, Asia-Pacific, 2021 – 2031 (3 of 3) |
| Figure 7‑56: PCNL Procedures by Country, Africa, 2021 – 2031 (1 of 2) |
| Figure 7‑57: PCNL Procedures by Country, Africa, 2021 – 2031 (2 of 2) |
| Figure 7‑58: Ureteral Stent Placement Procedures by Region, Global, 2021 – 2031 |
| Figure 7‑59: Ureteral Stent Placement Procedures by Country, North America, 2021 – 2031 |
| Figure 7‑60: Ureteral Stent Placement Procedures by Country, Latin America, 2021 – 2031 (1 of 2) |
| Figure 7‑61: Ureteral Stent Placement Procedures by Country, Latin America, 2021 – 2031 (2 of 2) |
| Figure 7‑62: Ureteral Stent Placement Procedures by Country, Western Europe, 2021 – 2031 |
| Figure 7‑63: Ureteral Stent Placement Procedures by Country, Central & Eastern Europe, 2021 – 2031 (1 of 2) |
| Figure 7‑64: Ureteral Stent Placement Procedures by Country, Central & Eastern Europe, 2021 – 2031 (2 of 2) |
| Figure 7‑65: Ureteral Stent Placement Procedures by Country, Middle East, 2021 – 2031 |
| Figure 7‑66: Ureteral Stent Placement Procedures by Country, Asia-Pacific, 2021 – 2031 (1 of 3) |
| Figure 7‑67: Ureteral Stent Placement Procedures by Country, Asia-Pacific, 2021 – 2031 (2 of 3) |
| Figure 7‑68: Ureteral Stent Placement Procedures by Country, Asia-Pacific, 2021 – 2031 (3 of 3) |
| Figure 7‑69: Ureteral Stent Placement Procedures by Country, Africa, 2021 – 2031 (1 of 2) |
| Figure 7‑70: Ureteral Stent Placement Procedures by Country, Africa, 2021 – 2031 (2 of 2) |
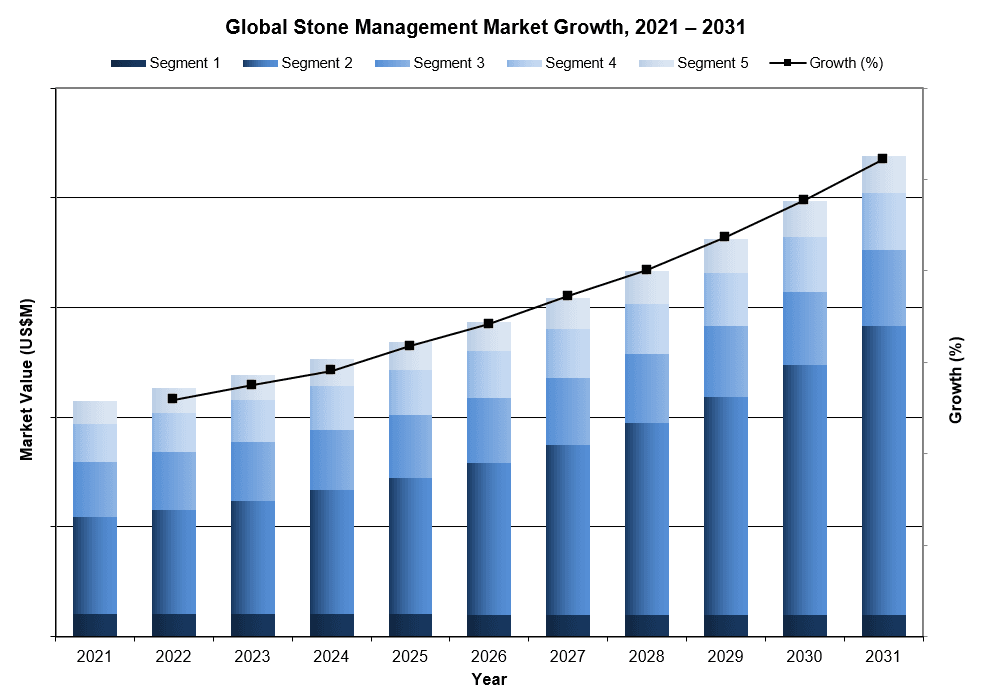
| Figure 7‑71: Stone Management Market by Segment, Global, 2021 – 2031 (US$M) |
| Figure 7‑72: Stone Management Market by Region, Global, 2021 – 2031 (US$M) |
| Figure 7‑73: Stone Management Market, Global, 2021 – 2031 |
| Figure 7‑74: Units Sold by Region, Stone Management Market, Global, 2021 – 2031 |
| Figure 7‑75: Average Selling Price by Region, Stone Management Market, Global, 2021 – 2031 (US$) |
| Figure 7‑76: Market Value by Region, Stone Management Market, Global, 2021 – 2031 (US$M) |
| Figure 7‑77: ESWL Equipment Market, Global, 2021 – 2031 |
| Figure 7‑78: Units Sold by Region, ESWL Equipment Market, Global, 2021 – 2031 |
| Figure 7‑79: Average Selling Price by Region, ESWL Equipment Market, Global, 2021 – 2031 (US$) |
| Figure 7‑80: Market Value by Region, ESWL Equipment Market, Global, 2021 – 2031 (US$M) |
| Figure 7‑81: Stone Management Laser Market by Segment, Global, 2021 – 2031 (US$M) |
| Figure 7‑82: Total Stone Management Laser Market, Global, 2021 – 2031 |
| Figure 7‑83: Units Sold by Region, Stone Management Laser Market, Global, 2021 – 2031 |
| Figure 7‑84: Average Selling Price by Region, Stone Management Laser Market, Global, 2021 – 2031 (US$) |
| Figure 7‑85: Market Value by Region, Stone Management Laser Market, Global, 2021 – 2031 (US$M) |
| Figure 7‑86: Stone Management Laser Equipment Market by Segment, Global, 2021 – 2031 (US$M) |
| Figure 7‑87: Total Stone Management Laser Equipment Market, Global, 2021 – 2031 |
| Figure 7‑88: Units Sold by Region, Stone Management Laser Equipment Market, Global, 2021 – 2031 |
| Figure 7‑89: Average Selling Price by Region, Stone Management Laser Equipment Market, Global, 2021 – 2031 (US$) |
| Figure 7‑90: Market Value by Region, Stone Management Laser Equipment Market, Global, 2021 – 2031 (US$M) |
| Figure 7‑91: Holmium Laser Equipment Market, Global, 2021 – 2031 |
| Figure 7‑92: Units Sold by Region, Holmium Laser Equipment Market, Global, 2021 – 2031 |
| Figure 7‑93: Average Selling Price by Region, Holmium Laser Equipment Market, Global, 2021 – 2031 (US$) |
| Figure 7‑94: Market Value by Region, Holmium Laser Equipment Market, Global, 2021 – 2031 (US$M) |
| Figure 7‑95: Thulium Laser Equipment Market, Global, 2021 – 2031 |
| Figure 7‑96: Units Sold by Region, Thulium Laser Equipment, Global, 2021 – 2031 |
| Figure 7‑97: Average Selling Price by Region, Thulium Laser Equipment Market, Global, 2021 – 2031 (US$) |
| Figure 7‑98: Market Value by Region, Thulium Laser Equipment Market, Global, 2021 – 2031 (US$M) |
| Figure 7‑99: Stone Management Laser Fiber Market by Segment, Global, 2021 – 2031 (US$M) |
| Figure 7‑100: Total Stone Management Laser Fiber Market, Global, 2021 – 2031 |
| Figure 7‑101: Units Sold by Region, Stone Management Laser Fiber Market, Global, 2021 – 2031 |
| Figure 7‑102: Average Selling Price by Region, Stone Management Laser Fiber Market, Global, 2021 – 2031 (US$) |
| Figure 7‑103: Market Value by Region, Stone Management Laser Fiber Market, Global, 2021 – 2031 (US$M) |
| Figure 7‑104: Holmium Laser Fiber Market, Global, 2021 – 2031 |
| Figure 7‑105: Units Sold by Region, Holmium Laser Fiber Market, Global, 2021 – 2031 |
| Figure 7‑106: Average Selling Price by Region, Holmium Laser Fiber Market, Global, 2021 – 2031 (US$) |
| Figure 7‑107: Market Value by Region, Holmium Laser Fiber Market, Global, 2021 – 2031 (US$M) |
| Figure 7‑108: Thulium Laser Fiber Market, Global, 2021 – 2031 |
| Figure 7‑109: Units Sold by Region, Thulium Laser Fiber Market, Global, 2021 – 2031 |
| Figure 7‑110: Average Selling Price by Region, Thulium Laser Fiber Market, Global, 2021 – 2031 (US$) |
| Figure 7‑111: Market Value by Region, Thulium Laser Fiber Market, Global, 2021 – 2031 (US$M) |
| Figure 7‑112: Stone Fragment Retrieval Device Market by Segment, Global, 2021 – 2031 (US$M) |
| Figure 7‑113: Total Stone Fragment Retrieval Device Market, Global, 2021 – 2031 |
| Figure 7‑114: Units Sold by Region, Stone Fragment Retrieval Device Market, Global, 2021 – 2031 |
| Figure 7‑115: Average Selling Price by Region, Stone Fragment Retrieval Device Market, Global, 2021 – 2031 (US$) |
| Figure 7‑116: Market Value by Region, Stone Fragment Retrieval Device Market, Global, 2021 – 2031 (US$M) |
| Figure 7‑117: Nitinol Stone Fragment Retrieval Device Market by Segment, Global, 2021 – 2031 (US$M) |
| Figure 7‑118: Total Nitinol Stone Fragment Retrieval Device Market, Global, 2021 – 2031 |
| Figure 7‑119: Units Sold by Region, Nitinol Stone Fragment Retrieval Device Market, Global, 2021 – 2031 |
| Figure 7‑120: Average Selling Price by Region, Nitinol Stone Fragment Retrieval Device Market, Global, 2021 – 2031 (US$) |
| Figure 7‑121: Market Value by Region, Nitinol Stone Fragment Retrieval Device Market, Global, 2021 – 2031 (US$M) |
| Figure 7‑122: Nitinol Basket Stone Fragment Retrieval Device Market, Global, 2021 – 2031 |
| Figure 7‑123: Units Sold by Region, Nitinol Basket Stone Fragment Retrieval Device Market, Global, 2021 – 2031 |
| Figure 7‑124: Average Selling Price by Region, Nitinol Basket Stone Fragment Retrieval Device Market, Global, 2021 – 2031 (US$) |
| Figure 7‑125: Market Value by Region, Nitinol Basket Stone Fragment Retrieval Device Market, Global, 2021 – 2031 (US$M) |
| Figure 7‑126: Nitinol Grasper Stone Fragment Retrieval Device Market, Global, 2021 – 2031 |
| Figure 7‑127: Units Sold by Region, Nitinol Grasper Stone Fragment Retrieval Device Market, Global, 2021 – 2031 |
| Figure 7‑128: Average Selling Price by Region, Nitinol Grasper Stone Fragment Retrieval Device Market, Global, 2021 – 2031 (US$) |
| Figure 7‑129: Market Value by Region, Nitinol Grasper Stone Fragment Retrieval Device Market, Global, 2021 – 2031 (US$M) |
| Figure 7‑130: Stainless-Steel Stone Fragment Retrieval Device Market by Segment, Global, 2021 – 2031 (US$M) |
| Figure 7‑131: Total Stainless-Steel Stone Fragment Retrieval Device Market, Global, 2021 – 2031 |
| Figure 7‑132: Units Sold by Region, Stainless-Steel Stone Fragment Retrieval Device Market, Global, 2021 – 2031 |
| Figure 7‑133: Average Selling Price by Region, Stainless-Steel Stone Fragment Retrieval Device Market, Global, 2021 – 2031 (US$) |
| Figure 7‑134: Market Value by Region, Stainless-Steel Stone Fragment Retrieval Device Market, Global, 2021 – 2031 (US$M) |
| Figure 7‑135: Stainless-Steel Basket Stone Fragment Retrieval Device Market, Global, 2021 – 2031 |
| Figure 7‑136: Units Sold by Region, Stainless-Steel Basket Stone Fragment Retrieval Device Market, Global, 2021 – 2031 |
| Figure 7‑137: Average Selling Price by Region, Stainless-Steel Basket Stone Fragment Retrieval Device Market, Global, 2021 – 2031 (US$) |
| Figure 7‑138: Market Value by Region, Stainless-Steel Basket Stone Fragment Retrieval Device Market, Global, 2021 – 2031 (US$M) |
| Figure 7‑139: Stainless-Steel Grasper Stone Fragment Retrieval Device Market, Global, 2021 – 2031 |
| Figure 7‑140: Units Sold by Region, Stainless Steel Grasper Stone Fragment Retrieval Device Market, Global, 2021 – 2031 |
| Figure 7‑141: Average Selling Price by Region, Stainless Steel Grasper Stone Fragment Retrieval Device Market, Global, 2021 – 2031 (US$) |
| Figure 7‑142: Market Value by Region, Stainless Steel Grasper Stone Fragment Retrieval Device Market, Global, 2021 – 2031 (US$M) |
| Figure 7‑143: Ureteral Stent Market, Global, 2021 – 2031 |
| Figure 7‑144: Units Sold by Region, Ureteral Stent Market, Global, 2021 – 2031 |
| Figure 7‑145: Average Selling Price by Region, Ureteral Stent Market, Global, 2021 – 2031 (US$) |
| Figure 7‑146: Market Value by Region, Ureteral Stent Market, Global, 2021 – 2031 (US$M) |
| Figure 7‑147: Access Sheath Market, Global, 2021 – 2031 |
| Figure 7‑148: Units Sold by Region, Access Sheath Market, Global, 2021 – 2031 |
| Figure 7‑149: Average Selling Price by Region, Access Sheath Market, Global, 2021 – 2031 (US$) |
| Figure 7‑150: Market Value by Region, Access Sheath Market, Global, 2021 – 2031 (US$M) |
| Figure 7‑151: Leading Competitors, Stone Management Market, Global, 2024 |