| Figure 1‑1: Urological Device Market Share Ranking by Segment, Europe, 2024 (1 of 2) |
| Figure 1‑2: Urological Device Market Share Ranking by Segment, Europe, 2024 (2 of 2) |
| Figure 1‑3: Companies Researched in This Report (1 of 2) |
| Figure 1‑4: Companies Researched in This Report (2 of 2) |
| Figure 1‑5: Recent Events in the Urological Device Market, Europe, 2019 – 2024 |
| Figure 1‑6: Factors Impacting the Urological Device Market by Segment, Europe (1 of 2) |
| Figure 1‑7: Factors Impacting the Urological Device Market by Segment, Europe (2 of 2) |
| Figure 1‑8: Urological Device Market Segmentation, Europe (1 of 3) |
| Figure 1‑9: Urological Device Market Segmentation, Europe (2 of 3) |
| Figure 1‑10: Urological Device Market Segmentation, Europe (3 of 3) |
| Figure 1‑11: Urological Device Procedure Segmentation, Europe |
| Figure 1‑12: Key Report Updates |
| Figure 1‑13: Version History |
| Figure 2‑1: Urological Device Market by Segment, Worst Case Scenario, Europe, 2021 – 2031 (€M) (1 of 2) |
| Figure 2‑2: Urological Device Market by Segment, Worst Case Scenario, Europe, 2021 – 2031 (€M) (2 of 2) |
| Figure 2‑3: Urological Device Market by Segment, Base Case Scenario, Europe, 2021 – 2031 (€M) (1 of 2) |
| Figure 2‑4: Urological Device Market by Segment, Base Case Scenario, Europe, 2021 – 2031 (€M) (2 of 2) |
| Figure 2‑5: Urological Device Market by Segment, Best Case Scenario, Europe, 2021 – 2031 (€M) (1 of 2) |
| Figure 2‑6: Urological Device Market by Segment, Best Case Scenario, Europe, 2021 – 2031 (€M) (2 of 2) |
| Figure 4‑1: Urinary Incontinence Treatments by Company (1 of 2) |
| Figure 4‑2: Urinary Incontinence Treatments by Company (2 of 2) |
| Figure 4‑3: Stone Management Devices by Company (1 of 4) |
| Figure 4‑4: Stone Management Devices by Company (2 of 4) |
| Figure 4‑5: Stone Management Devices by Company (3 of 4) |
| Figure 4‑6: Stone Management Devices by Company (4 of 4) |
| Figure 4‑7: BPH Treatments by Company |
| Figure 4‑8: Urological Endoscopes by Company (1 of 2) |
| Figure 4‑9: Urological Endoscopes by Company (2 of 2) |
| Figure 4‑10: Nephrostomy Devices by Company |
| Figure 4‑11: Men’s Reproductive Health Devices by Company |
| Figure 4‑12: Urinary Guidewires by Company |
| Figure 4‑13: Class 2 Device Recall BARD Magic3 GO |
| Figure 4‑14: Class 2 Device Recall BULKAMID, URETHRAL BULKING SYSTEM |
| Figure 4‑15: Class 2 Device Recall COAPTITE |
| Figure 4‑16: Class 2 Device Recall Medline Silicone Foley catheter |
| Figure 4‑17: Class 2 Device Recall SureStep |
| Figure 4‑18: Class 2 Device Recall AMS 700 100 mL Spherical Reservoir with InhibiZone |
| Figure 4‑19: Class 3 Device Recall Teleflex MEDICAL RuSCH One piece Male External Medium Catheter W/O Tape |
| Figure 4‑20: Class 2 Device Recall AMS 800 Artificial Urinary Sphincter AMS 800 Belt Cuff |
| Figure 4‑21: Class 3 Device Recall RUSCH Urinary Drainage bag |
| Figure 4‑22: Class 2 Device Recall Rusch EasyCath Kit |
| Figure 4‑23: Class 2 Device Recall UroPass Ureteral Access Sheath |
| Figure 4‑24: Class 2 Device Recall Cook Medical Kwart RetroInject Ureteral Stent |
| Figure 4‑25: Class 2 Device Recall Contour VL Ureteral Stent Set |
| Figure 4‑26: Class 2 Device Recall Cook Medical |
| Figure 4‑27: Class 2 Device Recall Polaris Ultra Ureteral Stent Set |
| Figure 4‑28: Class 2 Device Recall Percuflex Plus Ureteral Stent Set |
| Figure 4‑29: Class 2 Device Recall Stretch VL Ureteral Stent Set |
| Figure 4‑30: Class 2 Device Recall Universa Firm Ureteral Stent |
| Figure 4‑31: Class 2 Device Recall Universa Soft Ureteral Stent |
| Figure 4‑32: Class 2 Device Recall SofFlex Double Pigtail Ureteral Stent |
| Figure 4‑33: Class 2 Device Recall Urolift System |
| Figure 4‑34: Class 3 Device Recall GreenLight HPSEA Laser Fibers |
| Figure 4‑35: Class 2 Device Recall MoXy Laser Fiber |
| Figure 4‑36: Class 2 Device Recall AURIGA 30 BRAZIL ZERO COST SYSTEM |
| Figure 4‑37: Class 2 Device Recall Dornier |
| Figure 4‑38: Class 2 Device Recall Olympus |
| Figure 4‑39: Class 2 Device Recall OLYMPUS HF Resection Electrodes |
| Figure 4‑40: Class 2 Device Recall KARL STORZ Flexible Video CystoUrethroscopes (CVIEW) |
| Figure 4‑41: Class 2 Device Recall Flexible Cystoscope |
| Figure 4‑42: Class 2 Device Recall Percutaneous Neonatal Pigtail Nephrostomy Set and Pediatric Nephrostomy Stent Set |
| Figure 4‑43: Class 2 Device Recall Percutaneous Pigtail Nephrostomy Set |
| Figure 4‑44: Class 2 Device Recall Percutaneous Malecot Nephrostomy Set |
| Figure 4‑45: Class 2 Device Recall Percutaneous Entry Set |
| Figure 4‑46: Class 2 Device Recall Torosa |
| Figure 4‑47: Class 2 Device Recall the AMS 700 Inflatable Penile Prosthesis |
| Figure 4‑48: Class 2 Device Recall Titan Pump |
| Figure 4‑49: Class 2 Device Recall AMS 700 Inflatable Penile Prosthesis |
| Figure 4‑50: Class 2 Device Recall AMS 700 100 mL Spherical Reservoir with InhibiZone |
| Figure 4‑51: Post-Market Clinical Follow-Up on TVT EXACT® Continence System |
| Figure 4‑52: Single-incision Versus Retropubic Mid-Urethral Sling (Solyx) for SUI during Minimally Invasive Sacrocolpopexy (SASS) |
| Figure 4‑53: Artificial Urinary Sphincter Clinical Outcomes (AUSCO) |
| Figure 4‑54: e۰Sense® Catheter Clinical Investigation |
| Figure 4‑55: Investigation of Non-CE Marked Intermittent Catheters for Females |
| Figure 4‑56: Exploratory Study of a New Urine Collection Device for Men |
| Figure 4‑57: Investigation of New Intermittent Catheters in Healthy Volunteers |
| Figure 4‑58: Safety and Device Performance of the Uriprene® Degradable Temporary Ureteral Stent Following Uncomplicated Ureteroscopy (URIPRENE) |
| Figure 4‑59: The RELIEF™ Ureteral Stent - Assessment of Retrograde Urinary Reflux and Distal Coil Bladder Position |
| Figure 4‑60: Double-J PLUS Postmarket Registry |
| Figure 4‑61: A Randomized, International Study to Assess the Safety of iTind Compared to UroLift |
| Figure 4‑62: Comparing UroLift Experience Against Rezūm |
| Figure 4‑63: A Study Comparing Urolift and TURP Ahead of Radiotherapy in Men with Urinary Symptoms Secondary to Prostate Enlargement |
| Figure 4‑64: UroLift System with SAbR for Prostate Cancer and BPH |
| Figure 4‑65: Comparing UroLift Experience Against Rezūm (CLEAR) |
| Figure 4‑66: To Evaluate the Feasibility, Preliminary Safety and Performance of Rezūm System in BPH Treatment in China |
| Figure 4‑67: Evaluation of Novel Disposable Flexible Ureteroscope for the Treatment of Renal Calculi |
| Figure 4‑68: Prospective Evaluation of the LithoVue Elite Ureteroscope |
| Figure 4‑69: Effectiveness of Ambu® aScope™ 4 Cysto With the aView™ 2 Advance for Flexible Cystoscopy |
| Figure 4‑70: Single-use Cystoscope System for Direct Visualization of the Urethra and Bladder |
| Figure 4‑71: Evaluation of Performance and Safety of Ambu® aScope™ 4 Cysto and aView™ Urologia for Flexible Cystoscopy |
| Figure 4‑72: Prospective Observational Study on SEBBIN Silicone Gel-filled Testicular Implants |
| Figure 4‑73: Penile Prosthesis in Patients with Erectile Dysfunction |
| Figure 4‑74: Safety and Efficacy Study of USTRAP™ in Male Urinary Incontinence (PROSPECT) |
| Figure 4‑75: Rigicon Infla10® Three-Piece Inflatable Penile Prosthesis |
| Figure 5‑1: Currency Exchange Rate, 2024 |
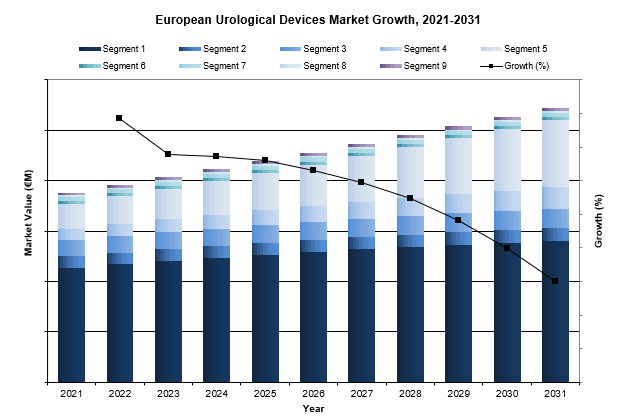
| Figure 5‑2: Urological Device Market by Segment, Europe, 2021 – 2031 (€M) (1 of 2) |
| Figure 5‑3: Urological Device Market by Segment, Europe, 2021 – 2031 (€M) (2 of 2) |
| Figure 5‑4: Urological Device Market by Segment, Europe, 2021 – 2031 (US$M) (1 of 2) |
| Figure 5‑5: Urological Device Market by Segment, Europe, 2021 – 2031 (US$M) (2 of 2) |
| Figure 5‑6: Leading Competitors, Urological Device Market, Europe, 2024 (1 of 2) |
| Figure 5‑7: Leading Competitors, Urological Device Market, Europe, 2024 (2 of 2) |
| Figure 5‑8: SWOT Analysis, Becton Dickinson |
| Figure 5‑9: SWOT Analysis, Boston Scientific |
| Figure 5‑10: SWOT Analysis, Cardinal Health |
| Figure 5‑11: SWOT Analysis, Coloplast |
| Figure 5‑12: SWOT Analysis, Cook Medical |
| Figure 5‑13: SWOT Analysis, Elekta |
| Figure 5‑14: SWOT Analysis, Ethicon |
| Figure 5‑15: SWOT Analysis, Karl Storz |
| Figure 5‑16: SWOT Analysis, Laborie |
| Figure 5‑17: SWOT Analysis, Medline |
| Figure 5‑18: SWOT Analysis, Olympus |
| Figure 5‑19: SWOT Analysis, Siemens |
| Figure 5‑20: SWOT Analysis, Teleflex |
| Figure 7‑1: Urological Procedures by Segment, Europe, 2021 – 2031 |
| Figure 7‑2: Urological Procedures by Country, Europe, 2021 – 2031 |
| Figure 7‑3: Prostate Cancer Procedures by Type, Europe, 2021 – 2031 (1 of 2) |
| Figure 7‑4: Prostate Cancer Procedures by Type, Europe, 2021 – 2031 (2 of 2) |
| Figure 7‑5: Total Prostate Cancer Procedures by Country, Europe, 2021 – 2031 |
| Figure 7‑6: Open Prostatectomy Procedures by Country, Europe, 2021 – 2031 |
| Figure 7‑7: Laparoscopic Prostatectomy Procedures by Country, Europe, 2021 – 2031 |
| Figure 7‑8: Robotic Prostatectomy Procedures by Country, Europe, 2021 – 2031 |
| Figure 7‑9: Watchful Waiting Procedures by Country, Europe, 2021 – 2031 |
| Figure 7‑10: HIFU Procedures by Country, Europe, 2021 – 2031 |
| Figure 7‑11: Brachytherapy Procedures by Country, Europe, 2021 – 2031 |
| Figure 7‑12: High-Dose Radiation Procedures by Country, Europe, 2021 – 2031 |
| Figure 7‑13: External Radiation Therapy (Primary) Procedures by Country, Europe, 2021 – 2031 |
| Figure 7‑14: External Radiation Therapy (Secondary) Procedures by Country, Europe, 2021 – 2031 |
| Figure 7‑15: Interventional BPH Procedures by Type, Europe, 2021 – 2031 |
| Figure 7‑16: Total Interventional BPH Procedures by Country, Europe, 2021 – 2031 |
| Figure 7‑17: TURP Procedures by Country, Europe, 2021 – 2031 |
| Figure 7‑18: Monopolar Electrode TURP Procedures by Country, Europe, 2021 – 2031 |
| Figure 7‑19: Bipolar Electrode TURP Procedures by Country, Europe, 2021 – 2031 |
| Figure 7‑20: Laser BPH Procedures by Country, Europe, 2021 – 2031 |
| Figure 7‑21: Urolift Procedures by Country, Europe, 2021 – 2031 |
| Figure 7‑22: Rezum Procedures by Country, Europe, 2021 – 2031 |
| Figure 7‑23: Stone Management Procedures by Type, Europe, 2021 – 2031 |
| Figure 7‑24: Total Stone Management Procedures by Country, Europe, 2021 – 2031 |
| Figure 7‑25: ESWL Procedures by Country, Europe, 2021 – 2031 |
| Figure 7‑26: Stone Management Holmium Laser Procedures by Country, Europe, 2021 – 2031 |
| Figure 7‑27: PCNL Procedures by Country, Europe, 2021 – 2031 |
| Figure 7‑28: Ureteral Stent Placement Procedures by Country, Europe, 2021 – 2031 |
| Figure 7‑29: Nephrostomy Procedures by Country, Europe, 2021 – 2031 |
| Figure 7‑30: Urinary Incontinence Procedures by Type, Europe, 2021 – 2031 |
| Figure 7‑31: Total Urinary Incontinence Procedures by Country, Europe, 2021 – 2031 |
| Figure 7‑32: Male Urinary Incontinence Procedures by Country, Europe, 2021 – 2031 |
| Figure 7‑33: Male Incontinence Sling Procedures by Country, Europe, 2021 – 2031 |
| Figure 7‑34: Incontinence Sling Removal Procedures by Country, Europe, 2021 – 2031 |
| Figure 7‑35: Male Urinary Artificial Sphincter Procedures by Country, Europe, 2021 – 2031 |
| Figure 7‑36: Female Urinary Incontinence Procedures by Country, Europe, 2021 – 2031 |
| Figure 7‑37: Transvaginal Tape Incontinence Sling Procedures by Country, Europe, 2021 – 2031 |
| Figure 7‑38: Transobturator Incontinence Sling Procedures by Country, Europe, 2021 – 2031 |
| Figure 7‑39: Single-Incision Incontinence Sling Procedures by Country, Europe, 2021 – 2031 |
| Figure 7‑40: Incontinence Sling Removal Procedures by Country, Europe, 2021 – 2031 |
| Figure 7‑41: Urethral Suspension Procedures by Country, Europe, 2021 – 2031 |
| Figure 7‑42: Erectile Dysfunction Management Procedures by Country, Europe, 2021 – 2031 |
| Figure 7‑43: Inflatable Implant Procedures by Country, Europe, 2021 – 2031 |
| Figure 7‑44: Malleable Implant Procedures by Country, Europe, 2021 – 2031 |
| Figure 8‑1: Urinary Catheter Market by Segment, Europe, 2021 – 2031 (€M) |
| Figure 8‑2: Urinary Catheter Market by Segment, Europe, 2021 – 2031 (US$M) |
| Figure 8‑3: Total Urinary Catheter Market, Europe, 2021 – 2031 |
| Figure 8‑4: Units Sold by Country, Total Urinary Catheter Market, Europe, 2021 – 2031 (1 of 2) |
| Figure 8‑5: Units Sold by Country, Total Urinary Catheter Market, Europe, 2021 – 2031 (2 of 2) |
| Figure 8‑6: Average Selling Price by Country, Total Urinary Catheter Market, Europe, 2021 – 2031 (€) |
| Figure 8‑7: Average Selling Price by Country, Total Urinary Catheter Market, Europe, 2021 – 2031 (US$) |
| Figure 8‑8: Market Value by Country, Total Urinary Catheter Market, Europe, 2021 – 2031 (€M) |
| Figure 8‑9: Market Value by Country, Total Urinary Catheter Market, Europe, 2021 – 2031 (US$M) |
| Figure 8‑10: Intermittent Catheter Market, Europe, 2021 – 2031 |
| Figure 8‑11: Units Sold by Country, Intermittent Catheter Market, Europe, 2021 – 2031 (1 of 2) |
| Figure 8‑12: Units Sold by Country, Intermittent Catheter Market, Europe, 2021 – 2031 (2 of 2) |
| Figure 8‑13: Average Selling Price by Country, Intermittent Catheter Market, Europe, 2021 – 2031 (€) |
| Figure 8‑14: Average Selling Price by Country, Intermittent Catheter Market, Europe, 2021 – 2031 (US$) |
| Figure 8‑15: Market Value by Country, Intermittent Catheter Market, Europe, 2021 – 2031 (€M) |
| Figure 8‑16: Market Value by Country, Intermittent Catheter Market, Europe, 2021 – 2031 (US$M) |
| Figure 8‑17: Foley Catheter Market, Europe, 2021 – 2031 |
| Figure 8‑18: Units Sold by Country, Foley Catheter Market, Europe, 2021 – 2031 (1 of 2) |
| Figure 8‑19: Units Sold by Country, Foley Catheter Market, Europe, 2021 – 2031 (2 of 2) |
| Figure 8‑20: Average Selling Price by Country, Foley Catheter Market, Europe, 2021 – 2031 (€) |
| Figure 8‑21: Average Selling Price by Country, Foley Catheter Market, Europe, 2021 – 2031 (US$) |
| Figure 8‑22: Market Value by Country, Foley Catheter Market, Europe, 2021 – 2031 (€M) |
| Figure 8‑23: Market Value by Country, Foley Catheter Market, Europe, 2021 – 2031 (US$M) |
| Figure 8‑24: External Catheter Market by Segment, Europe, 2021 – 2031 (€M) |
| Figure 8‑25: External Catheter Market by Segment, Europe, 2021 – 2031 (US$M) |
| Figure 8‑26: Total External Catheter Market, Europe, 2021 – 2031 |
| Figure 8‑27: Male External Catheter Market, Europe, 2021 – 2031 |
| Figure 8‑28: Units Sold by Country, Male External Catheter Market, Europe, 2021 – 2031 |
| Figure 8‑29: Average Selling Price by Country, Male External Catheter Market, Europe, 2021 – 2031 (€) |
| Figure 8‑30: Average Selling Price by Country, Male External Catheter Market, Europe, 2021 – 2031 (US$) |
| Figure 8‑31: Market Value by Country, Male External Catheter Market, Europe, 2021 – 2031 (€M) |
| Figure 8‑32: Market Value by Country, Male External Catheter Market, Europe, 2021 – 2031 (US$M) |
| Figure 8‑33: Female External Catheter Market, Europe, 2021 – 2031 |
| Figure 8‑34: Leading Competitors, Urinary Catheter Market, Europe, 2024 |
| Figure 9‑1: Urinary Incontinence Device Market by Segment, Europe, 2021 – 2031 (€M) |
| Figure 9‑2: Urinary Incontinence Device Market by Segment, Europe, 2021 – 2031 (US$M) |
| Figure 9‑3: Urethral Bulking Agent Market, Europe, 2021 – 2031 |
| Figure 9‑4: Female Incontinence Sling Market by Segment, Europe, 2021 – 2031 (€M) |
| Figure 9‑5: Female Incontinence Sling Market by Segment, Europe, 2021 – 2031 (US$M) |
| Figure 9‑6: Total Female Incontinence Sling Market, Europe, 2021 – 2031 |
| Figure 9‑7: Units Sold by Country, Total Female Incontinence Sling Market, Europe, 2021 – 2031 |
| Figure 9‑8: Average Selling Price by Country, Total Female Incontinence Sling Market, Europe, 2021 – 2031 (€) |
| Figure 9‑9: Average Selling Price by Country, Total Female Incontinence Sling Market, Europe, 2021 – 2031 (US$) |
| Figure 9‑10: Market Value by Country, Total Female Incontinence Sling Market, Europe, 2021 – 2031 (€M) |
| Figure 9‑11: Market Value by Country, Total Female Incontinence Sling Market, Europe, 2021 – 2031 (US$M) |
| Figure 9‑12: Transvaginal Tape Female Incontinence Sling Market, Europe, 2021 – 2031 |
| Figure 9‑13: Units Sold by Country, Transvaginal Tape Female Incontinence Sling Market, Europe, 2021 – 2031 |
| Figure 9‑14: Average Selling Price by Country, Transvaginal Tape Female Incontinence Sling Market, Europe, 2021 – 2031 (€) |
| Figure 9‑15: Average Selling Price by Country, Transvaginal Tape Female Incontinence Sling Market, Europe, 2021 – 2031 (US$) |
| Figure 9‑16: Market Value by Country, Transvaginal Tape Female Incontinence Sling Market, Europe, 2021 – 2031 (€M) |
| Figure 9‑17: Market Value by Country, Transvaginal Tape Female Incontinence Sling Market, Europe, 2021 – 2031 (US$M) |
| Figure 9‑18: Transobturator Female Incontinence Sling Market, Europe, 2021 – 2031 |
| Figure 9‑19: Units Sold by Country, Transobturator Female Incontinence Sling Market, Europe, 2021 – 2031 |
| Figure 9‑20: Average Selling Price by Country, Transobturator Female Incontinence Sling Market, Europe, 2021 – 2031 (€) |
| Figure 9‑21: Average Selling Price by Country, Transobturator Female Incontinence Sling Market, Europe, 2021 – 2031 (US$) |
| Figure 9‑22: Market Value by Country, Transobturator Female Incontinence Sling Market, Europe, 2021 – 2031 (€M) |
| Figure 9‑23: Market Value by Country, Transobturator Female Incontinence Sling Market, Europe, 2021 – 2031 (US$M) |
| Figure 9‑24: Single-Incision Female Incontinence Sling Market, Europe, 2021 – 2031 |
| Figure 9‑25: Units Sold by Country, Single-Incision Female Incontinence Sling Market, Europe, 2021 – 2031 |
| Figure 9‑26: Average Selling Price by Country, Single-Incision Female Incontinence Sling Market, Europe, 2021 – 2031 (€) |
| Figure 9‑27: Average Selling Price by Country, Single-Incision Female Incontinence Sling Market, Europe, 2021 – 2031 (US$) |
| Figure 9‑28: Market Value by Country, Single-Incision Female Incontinence Sling Market, Europe, 2021 – 2031 (€M) |
| Figure 9‑29: Market Value by Country, Single-Incision Female Incontinence Sling Market, Europe, 2021 – 2031 (US$M) |
| Figure 9‑30: Male Implantable Device Market by Segment, Europe, 2021 – 2031 (€M) |
| Figure 9‑31: Male Implantable Device Market by Segment, Europe, 2021 – 2031 (US$M) |
| Figure 9‑32: Total Male Implantable Device Market, Europe, 2021 – 2031 |
| Figure 9‑33: Units Sold by Country, Male Implantable Device Market, Europe, 2021 – 2031 |
| Figure 9‑34: Average Selling Price by Country, Male Implantable Device Market, Europe, 2021 – 2031 (€) |
| Figure 9‑35: Average Selling Price by Country, Male Implantable Device Market, Europe, 2021 – 2031 (US$) |
| Figure 9‑36: Market Value by Country, Male Implantable Device Market, Europe, 2021 – 2031 (€M) |
| Figure 9‑37: Market Value by Country, Male Implantable Device Market, Europe, 2021 – 2031 (US$M) |
| Figure 9‑38: Male Urinary Incontinence Sling Market, Europe, 2021 – 2031 |
| Figure 9‑39: Units Sold by Country, Male Incontinence Sling Device Market, Europe, 2021 – 2031 |
| Figure 9‑40: Average Selling Price by Country, Male Incontinence Sling Market, Europe, 2021 – 2031 (€) |
| Figure 9‑41: Average Selling Price by Country, Male Incontinence Sling Device Market, Europe, 2021 – 2031 (US$) |
| Figure 9‑42: Market Value by Country, Male Incontinence Sling, Europe, 2021 – 2031 (€M) |
| Figure 9‑43: Market Value by Country, Male Incontinence Sling Market, Europe, 2021 – 2031 (US$M) |
| Figure 9‑44: Male Artificial Urinary Sphincter Market, Europe, 2021 – 2031 |
| Figure 9‑45: Units Sold by Country, Male Artificial Urinary Sphincter Market, Europe, 2021 – 2031 |
| Figure 9‑46: Average Selling Price by Country, Male Artificial Urinary Sphincter Market, Europe, 2021 – 2031 (€) |
| Figure 9‑47: Average Selling Price by Country, Male Artificial Urinary Sphincter Market, Europe, 2021 – 2031 (US$) |
| Figure 9‑48: Market Value by Country, Male Artificial Urinary Sphincter, Europe, 2021 – 2031 (€M) |
| Figure 9‑49: Market Value by Country, Male Artificial Urinary Sphincter, Europe, 2021 – 2031 (US$M) |
| Figure 9‑50: Urinary Bag Market by Segment, Europe, 2021 – 2031 (€M) |
| Figure 9‑51: Urinary Bag Market by Segment, Europe, 2021 – 2031 (US$M) |
| Figure 9‑52: Total Urinary Bag Market, Europe, 2021 – 2031 |
| Figure 9‑53: Units Sold by Country, Urinary Bag Market, Europe, 2021 – 2031 |
| Figure 9‑54: Average Selling Price by Country, Urinary Bag Market, Europe, 2021 – 2031 (€) |
| Figure 9‑55: Average Selling Price by Country, Urinary Bag Market, Europe, 2021 – 2031 (US$) |
| Figure 9‑56: Market Value by Country, Urinary Bag Market, Europe, 2021 – 2031 (€M) |
| Figure 9‑57: Market Value by Country, Urinary Bag Market, Europe, 2021 – 2031 (US$M) |
| Figure 9‑58: Bedside Urinary Bag Market, Europe, 2021 – 2031 |
| Figure 9‑59: Units Sold by Country, Bedside Urinary Bag Market, Europe, 2021 – 2031 |
| Figure 9‑60: Average Selling Price by Country, Bedside Urinary Bag Market, Europe, 2021 – 2031 (€) |
| Figure 9‑61: Average Selling Price by Country, Bedside Urinary Bag Device Market, Europe, 2021 – 2031 (US$) |
| Figure 9‑62: Market Value by Country, Bedside Urinary Bag Market, Europe, 2021 – 2031 (€M) |
| Figure 9‑63: Market Value by Country, Bedside Urinary Bag Market, Europe, 2021 – 2031 (US$M) |
| Figure 9‑64: Leg Urinary Bag Market, Europe, 2021 – 2031 |
| Figure 9‑65: Units Sold by Country, Leg Urinary Bag Market, Europe, 2021 – 2031 |
| Figure 9‑66: Average Selling Price by Country, Leg Urinary Bag Market, Europe, 2021 – 2031 (€) |
| Figure 9‑67: Average Selling Price by Country, Leg Urinary Bag Device Market, Europe, 2021 – 2031 (US$) |
| Figure 9‑68: Market Value by Country, Leg Urinary Bag Market, Europe, 2021 – 2031 (€M) |
| Figure 9‑69: Market Value by Country, Leg Urinary Bag Market, Europe, 2021 – 2031 (US$M) |
| Figure 9‑70: Leading Competitors, Urinary Incontinence Device Market, Europe, 2024 |
| Figure 9‑71: Competitive Analysis by Country, Urinary Incontinence Device Market, Europe, 2024 |
| Figure 9‑72: Competitive Analysis by Country, Urethral Bulking Agent Market, Europe, 2024 |
| Figure 9‑73: Competitive Analysis by Country, Female Incontinence Sling Market, Europe, 2024 |
| Figure 9‑74: Competitive Analysis by Country, Male Implantable Device Market, Europe, 2024 |
| Figure 10‑1: Stone Management Device Market by Segment, Europe, 2021 – 2031 (€M) |
| Figure 10‑2: Stone Management Device Market by Segment, Europe, 2021 – 2031 (US$M) |
| Figure 10‑3: ESWL Equipment Market, Europe, 2021 – 2031 |
| Figure 10‑4: Stone Management Laser Market by Segment, Europe, 2021 – 2031 (€M) |
| Figure 10‑5: Stone Management Laser Market by Segment, Europe, 2021 – 2031 (US$M) |
| Figure 10‑6: Holmium Stone Management Laser Market by Segment, Europe, 2021 – 2031 (€M) |
| Figure 10‑7: Holmium Stone Management Laser Market by Segment, Europe, 2021 – 2031 (US$M) |
| Figure 10‑8: Holmium Stone Management Laser Capital Equipment Market, Europe, 2021 – 2031 |
| Figure 10‑9: Units Sold by Country, Holmium Stone Management Laser Capital Equipment Market, Europe, 2021 – 2031 |
| Figure 10‑10: Average Selling Price by Country, Holmium Stone Management Laser Capital Equipment Market, Europe, 2021 – 2031 (€) |
| Figure 10‑11: Average Selling Price by Country, Holmium Stone Management Laser Capital Equipment Market, Europe, 2021 – 2031 (US$) |
| Figure 10‑12: Market Value by Country, Holmium Stone Management Laser Capital Equipment Market, Europe, 2021 – 2031 (€M) |
| Figure 10‑13: Market Value by Country, Holmium Stone Management Laser Capital Equipment Market, Europe, 2021 – 2031 (US$M) |
| Figure 10‑14: Holmium Stone Management Laser Fiber Market, Europe, 2021 – 2031 |
| Figure 10‑15: Units Sold by Country, Holmium Stone Management Laser Fiber Market, Europe, 2021 – 2031 |
| Figure 10‑16: Average Selling Price by Country, Holmium Stone Management Laser Fiber Market, Europe, 2021 – 2031 (€) |
| Figure 10‑17: Average Selling Price by Country, Holmium Stone Management Laser Fiber Market, Europe, 2021 – 2031 (US$) |
| Figure 10‑18: Market Value by Country, Holmium Stone Management Laser Fiber Market, Europe, 2021 – 2031 (€M) |
| Figure 10‑19: Market Value by Country, Holmium Stone Management Laser Fiber Market, Europe, 2021 – 2031 (US$M) |
| Figure 10‑20: Thulium Stone Management Laser Market by Segment, Europe, 2021 – 2031 (€M) |
| Figure 10‑21: Thulium Stone Management Laser Market by Segment, Europe, 2021 – 2031 (US$M) |
| Figure 10‑22: Thulium Stone Management Laser Capital Equipment Market, Europe, 2021 – 2031 |
| Figure 10‑23: Thulium Stone Management Laser Fiber Market, Europe, 2021 – 2031 |
| Figure 10‑24: Stone Fragment Retrieval Device Market by Segment, Europe, 2021 – 2031 (€M) |
| Figure 10‑25: Stone Fragment Retrieval Device Market by Segment, Europe, 2021 – 2031 (US$M) |
| Figure 10‑26: Total Stone Fragment Retrieval Device Market, Europe, 2021 – 2031 |
| Figure 10‑27: Units Sold by Country, Total Stone Fragment Retrieval Device Market, Europe, 2021 – 2031 |
| Figure 10‑28: Average Selling Price by Country, Total Stone Fragment Retrieval Device Market, Europe, 2021 – 2031 (€) |
| Figure 10‑29: Average Selling Price by Country, Total Stone Fragment Retrieval Device Market, Europe, 2021 – 2031 (US$) |
| Figure 10‑30: Market Value by Country, Total Stone Fragment Retrieval Device Market, Europe, 2021 – 2031 (€M) |
| Figure 10‑31: Market Value by Country, Total Stone Fragment Retrieval Device Market, Europe, 2021 – 2031 (US$M) |
| Figure 10‑32: Nitinol Stone Fragment Retrieval Device Market by Segment, Europe, 2021 – 2031 (€M) |
| Figure 10‑33: Nitinol Stone Fragment Retrieval Device Market by Segment, Europe, 2021 – 2031 (US$M) |
| Figure 10‑34: Total Nitinol Stone Fragment Retrieval Device Market, Europe, 2021 – 2031 |
| Figure 10‑35: Units Sold by Country, Total Nitinol Stone Fragment Retrieval Device Market, Europe, 2021 – 2031 |
| Figure 10‑36: Average Selling Price by Country, Total Nitinol Stone Fragment Retrieval Device Market, Europe, 2021 – 2031 (€) |
| Figure 10‑37: Average Selling Price by Country, Total Nitinol Stone Fragment Retrieval Device Market, Europe, 2021 – 2031 (US$) |
| Figure 10‑38: Market Value by Country, Total Nitinol Stone Fragment Retrieval Device Market, Europe, 2021 – 2031 (€M) |
| Figure 10‑39: Market Value by Country, Total Nitinol Stone Fragment Retrieval Device Market, Europe, 2021 – 2031 (US$M) |
| Figure 10‑40: Nitinol Basket Stone Fragment Retrieval Device Market, Europe, 2021 – 2031 |
| Figure 10‑41: Units Sold by Country, Nitinol Basket Stone Fragment Retrieval Device Market, Europe, 2021 – 2031 |
| Figure 10‑42: Average Selling Price by Country, Nitinol Basket Stone Fragment Retrieval Device Market, Europe, 2021 – 2031 (€) |
| Figure 10‑43: Average Selling Price by Country, Nitinol Basket Stone Fragment Retrieval Device Market, Europe, 2021 – 2031 (US$) |
| Figure 10‑44: Market Value by Country, Nitinol Basket Stone Fragment Retrieval Device Market, Europe, 2021 – 2031 (€M) |
| Figure 10‑45: Market Value by Country, Nitinol Basket Stone Fragment Retrieval Device Market, Europe, 2021 – 2031 (US$M) |
| Figure 10‑46: Nitinol Grasper Stone Fragment Retrieval Device Market, Europe, 2021 – 2031 |
| Figure 10‑47: Units Sold by Country, Nitinol Grasper Stone Fragment Retrieval Device Market, Europe, 2021 – 2031 |
| Figure 10‑48: Average Selling Price by Country, Nitinol Grasper Stone Fragment Retrieval Device Market, Europe, 2021 – 2031 (€) |
| Figure 10‑49: Average Selling Price by Country, Nitinol Grasper Stone Fragment Retrieval Device Market, Europe, 2021 – 2031 (US$) |
| Figure 10‑50: Market Value by Country, Nitinol Grasper Stone Fragment Retrieval Device Market, Europe, 2021 – 2031 (€M) |
| Figure 10‑51: Market Value by Country, Nitinol Grasper Stone Fragment Retrieval Device Market, Europe, 2021 – 2031 (US$M) |
| Figure 10‑52: Stainless-Steel Stone Fragment Retrieval Device Market by Segment, Europe, 2021 – 2031 (€M) |
| Figure 10‑53: Stainless-Steel Stone Fragment Retrieval Device Market by Segment, Europe, 2021 – 2031 (US$M) |
| Figure 10‑54: Total Stainless-Steel Stone Fragment Retrieval Device Market, Europe, 2021 – 2031 |
| Figure 10‑55: Units Sold by Country, Total Stainless-Steel Stone Fragment Retrieval Device Market, Europe, 2021 – 2031 |
| Figure 10‑56: Average Selling Price by Country, Total Stainless-Steel Stone Fragment Retrieval Device Market, Europe, 2021 – 2031 (€) |
| Figure 10‑57: Average Selling Price by Country, Total Stainless-Steel Stone Fragment Retrieval Device Market, Europe, 2021 – 2031 (US$) |
| Figure 10‑58: Market Value by Country, Total Stainless-Steel Stone Fragment Retrieval Device Market, Europe, 2021 – 2031 (€M) |
| Figure 10‑59: Market Value by Country, Total Stainless-Steel Stone Fragment Retrieval Device Market, Europe, 2021 – 2031 (US$M) |
| Figure 10‑60: Stainless-Steel Basket Stone Fragment Retrieval Device Market, Europe, 2021 – 2031 |
| Figure 10‑61: Units Sold by Country, Stainless-Steel Basket Stone Fragment Retrieval Device Market, Europe, 2021 – 2031 |
| Figure 10‑62: Average Selling Price by Country, Stainless-Steel Basket Stone Fragment Retrieval Device Market, Europe, 2021 – 2031 (€) |
| Figure 10‑63: Average Selling Price by Country, Stainless-Steel Basket Stone Fragment Retrieval Device Market, Europe, 2021 – 2031 (US$) |
| Figure 10‑64: Market Value by Country, Stainless-Steel Basket Stone Fragment Retrieval Device Market, Europe, 2021 – 2031 (€M) |
| Figure 10‑65: Market Value by Country, Stainless-Steel Basket Stone Fragment Retrieval Device Market, Europe, 2021 – 2031 (US$M) |
| Figure 10‑66: Stainless-Steel Grasper Stone Fragment Retrieval Device Market, Europe, 2021 – 2031 |
| Figure 10‑67: Units Sold by Country, Stainless-Steel Grasper Stone Fragment Retrieval Device Market, Europe, 2021 – 2031 |
| Figure 10‑68: Average Selling Price by Country, Stainless-Steel Grasper Stone Fragment Retrieval Device Market, Europe, 2021 – 2031 (€) |
| Figure 10‑69: Average Selling Price by Country, Stainless-Steel Grasper Stone Fragment Retrieval Device Market, Europe, 2021 – 2031 (US$) |
| Figure 10‑70: Market Value by Country, Stainless-Steel Grasper Stone Fragment Retrieval Device Market, Europe, 2021 – 2031 (€M) |
| Figure 10‑71: Market Value by Country, Stainless-Steel Grasper Stone Fragment Retrieval Device Market, Europe, 2021 – 2031 (US$M) |
| Figure 10‑72: Ureteral Stent Market, Europe, 2021 – 2031 |
| Figure 10‑73: Units Sold by Country, Ureteral Stent Market, Europe, 2021 – 2031 |
| Figure 10‑74: Average Selling Price by Country, Ureteral Stent Market, Europe, 2021 – 2031 (€) |
| Figure 10‑75: Average Selling Price by Country, Ureteral Stent Market, Europe, 2021 – 2031 (US$) |
| Figure 10‑76: Market Value by Country, Ureteral Stent Market, Europe, 2021 – 2031 (€M) |
| Figure 10‑77: Market Value by Country, Ureteral Stent Market, Europe, 2021 – 2031 (US$M) |
| Figure 10‑78: Access Sheath Market, Europe, 2021 – 2031 |
| Figure 10‑79: Leading Competitors, Stone Management Device Market, Europe, 2024 |
| Figure 11‑1: BPH Treatment Device Market by Segment, Europe, 2021 – 2031 (€M) |
| Figure 11‑2: BPH Treatment Device Market by Segment, Europe, 2021 – 2031 (US$M) |
| Figure 11‑3: TURP Market by Segment, Europe, 2021 – 2031 (€M) |
| Figure 11‑4: TURP Market by Segment, Europe, 2021 – 2031 (US$M) |
| Figure 11‑5: Total TURP Market, Europe, 2021 – 2031 |
| Figure 11‑6: Units Sold by Country, Total TURP Market, Europe, 2021 – 2031 |
| Figure 11‑7: Average Selling Price by Country, Total TURP Market, Europe, 2021 – 2031 (€) |
| Figure 11‑8: Average Selling Price by Country, Total TURP Market, Europe, 2021 – 2031 (US$) |
| Figure 11‑9: Market Value by Country, Total TURP Market, Europe, 2021 – 2031 (€M) |
| Figure 11‑10: Market Value by Country, Total TURP Market, Europe, 2021 – 2031 (US$M) |
| Figure 11‑11: Monopolar Electrode Market, Europe, 2021 – 2031 |
| Figure 11‑12: Units Sold by Country, Monopolar Electrode Market, Europe, 2021 – 2031 |
| Figure 11‑13: Average Selling Price by Country, Monopolar Electrode Market, Europe, 2021 – 2031 (€) |
| Figure 11‑14: Average Selling Price by Country, Monopolar Electrode Market, Europe, 2021 – 2031 (US$) |
| Figure 11‑15: Market Value by Country, Monopolar Electrode Market, Europe, 2021 – 2031 (€M) |
| Figure 11‑16: Market Value by Country, Monopolar Electrode Market, Europe, 2021 – 2031 (US$M) |
| Figure 11‑17: Bipolar Electrode Market, Europe, 2021 – 2031 |
| Figure 11‑18: Units Sold by Country, Bipolar Electrode Market, Europe, 2021 – 2031 |
| Figure 11‑19: Average Selling Price by Country, Bipolar Electrode Market, Europe, 2021 – 2031 (€) |
| Figure 11‑20: Average Selling Price by Country, Bipolar Electrode Market, Europe, 2021 – 2031 (US$) |
| Figure 11‑21: Market Value by Country, Bipolar Electrode Market, Europe, 2021 – 2031 (€M) |
| Figure 11‑22: Market Value by Country, Bipolar Electrode Market, Europe, 2021 – 2031 (US$M) |
| Figure 11‑23: Laser BPH Market by Segment, Europe, 2021 – 2031 (€M) |
| Figure 11‑24: Laser BPH Market by Segment, Europe, 2021 – 2031 (US$M) |
| Figure 11‑25: Holmium Laser BPH Market by Segment, Europe, 2021 – 2031 (€M) |
| Figure 11‑26: Holmium Laser BPH Market by Segment, Europe, 2021 – 2031 (US$M) |
| Figure 11‑27: Holmium Laser BPH Capital Equipment Market, Europe, 2021 – 2031 |
| Figure 11‑28: Units Sold by Country, Holmium Laser BPH Capital Equipment Market, Europe, 2021 – 2031 |
| Figure 11‑29: Average Selling Price by Country, Holmium Capital Equipment BPH Fiber Market, Europe, 2021 – 2031 (€) |
| Figure 11‑30: Average Selling Price by Country, Holmium Capital Equipment BPH Fiber Market, Europe, 2021 – 2031 (US$) |
| Figure 11‑31: Market Value by Country, Holmium Laser BPH Capital Equipment Market, Europe, 2021 – 2031 (€M) |
| Figure 11‑32: Market Value by Country, Holmium Laser BPH Capital Equipment Market, Europe, 2021 – 2031 (US$M) |
| Figure 11‑33: Holmium Laser BPH Fiber Market, Europe, 2021 – 2031 |
| Figure 11‑34: Units Sold by Country, Holmium Laser BPH Fiber Market, Europe, 2021 – 2031 |
| Figure 11‑35: Average Selling Price by Country, Holmium Laser BPH Fiber Market, Europe, 2021 – 2031 (€) |
| Figure 11‑36: Average Selling Price by Country, Holmium Laser BPH Fiber Market, Europe, 2021 – 2031 (US$) |
| Figure 11‑37: Market Value by Country, Holmium Laser BPH Fiber Market, Europe, 2021 – 2031 (€M) |
| Figure 11‑38: Market Value by Country, Holmium Laser BPH Fiber Market, Europe, 2021 – 2031 (US$M) |
| Figure 11‑39: Thulium Laser BPH Market by Segment, Europe, 2021 – 2031 (€M) |
| Figure 11‑40: Thulium Laser BPH Market by Segment, Europe, 2021 –2031(US$M) |
| Figure 11‑41: Thulium Laser BPH Capital Equipment Market, Europe, 2021 – 2031 |
| Figure 11‑42: Thulium Laser BPH Fiber Market, Europe, 2021 – 2031 |
| Figure 11‑43: UroLift Market, Europe, 2021 – 2031 |
| Figure 11‑44: Total Rezūm® Market by Segment, Europe, 2021 – 2031 (€M) |
| Figure 11‑45: Total Rezūm® Market by Segment, Europe, 2021 – 2031 (US$M) |
| Figure 11‑46: Rezūm Equipment Market, Europe, 2021 – 2031 |
| Figure 11‑47: Rezūm® Consumables Market, Europe, 2021 – 2031 |
| Figure 11‑48: Leading Competitors, BPH Treatment Device Market, Europe, 2021 |
| Figure 12‑1: Urological Endoscope Market by Segment, Europe, 2021 – 2031 (€M) |
| Figure 12‑2: Urological Endoscope Market by Segment, Europe, 2021 – 2031 (US$M) |
| Figure 12‑3: Urological Endoscope Market, Europe, 2021 – 2031 |
| Figure 12‑4: Reusable Urological Endoscope Market, Europe, 2021 – 2031 |
| Figure 12‑5: Single-Use Urological Endoscope Market, Europe, 2021 – 2031 |
| Figure 12‑6: Cystoscope Market by Segment, Europe, 2021 – 2031 (€M) |
| Figure 12‑7: Cystoscope Market by Segment, Europe, 2021 – 2031 (US$M) |
| Figure 12‑8: Total Cystoscope Market, Europe, 2021 – 2031 |
| Figure 12‑9: Reusable Cystoscope Market, Europe, 2021 – 2031 |
| Figure 12‑10: Single-Use Cystoscope Market, Europe, 2021 – 2031 |
| Figure 12‑11: Rigid Cystoscope Market, Europe, 2021 – 2031 |
| Figure 12‑12: Flexible Cystoscope Market by Segment, Europe, 2021 – 2031 (€M) |
| Figure 12‑13: Flexible Cystoscope Market by Segment, Europe, 2021 – 2031 (US$M) |
| Figure 12‑14: Total Flexible Cystoscope Market, Europe, 2021 – 2031 |
| Figure 12‑15: Flexible Fiber Optic Cystoscope Market, Europe, 2021 – 2031 |
| Figure 12‑16: Flexible Video Cystoscope Market, Europe, 2021 – 2031 |
| Figure 12‑17: Ureteroscope Market by Segment, Europe, 2021 – 2031 (€M) |
| Figure 12‑18: Ureteroscope Market by Segment, Europe, 2021 – 2031 (US$M) |
| Figure 12‑19: Total Ureteroscope Market, Europe, 2021 – 2031 |
| Figure 12‑20: Reusable Ureteroscope Market, Europe, 2021 – 2031 |
| Figure 12‑21: Single-Use Ureteroscope Market, Europe, 2021 – 2031 |
| Figure 12‑22: Semi-Rigid Ureteroscope Market, Europe, 2021 – 2031 |
| Figure 12‑23: Flexible Ureteroscope Market by Segment, Europe, 2021 – 2031 (€M) |
| Figure 12‑24: Flexible Ureteroscope Market by Segment, Europe, 2021 – 2031 (US$M) |
| Figure 12‑25: Total Flexible Ureteroscope Market, Europe, 2021 – 2031 |
| Figure 12‑26: Flexible Fiber Optic Ureteroscope Market, Europe, 2021 – 2031 |
| Figure 12‑27: Flexible Video Ureteroscope Market, Europe, 2021 – 2031 |
| Figure 12‑28: Resectoscope Market, Europe, 2021 – 2031 |
| Figure 12‑29: Nephroscope Market, Europe, 2021 – 2031 |
| Figure 12‑30: Leading Competitors, Urological Endoscope Market, Europe, 2024 |
| Figure 13‑1: LDR Brachytherapy Device Market by Segment, Europe, 2021 – 2031 (€M) |
| Figure 13‑2: LDR Brachytherapy Device Market by Segment, Europe, 2021 – 2031 (US$M) |
| Figure 13‑3: LDR Needle Market, Europe, 2021 – 2031 |
| Figure 13‑4: Procedures by Country, LDR Needle Market, Europe, 2021 – 2031 |
| Figure 13‑5: Average Selling Price by Country, LDR Needle Market, Europe, 2021 – 2031 (€) |
| Figure 13‑6: Average Selling Price by Country, LDR Needle Market, Europe, 2021 – 2031 (US$) |
| Figure 13‑7: Market Value by Country, LDR Needle Market, Europe, 2021 – 2031 (€M) |
| Figure 13‑8: Market Value by Country, LDR Needle Market, Europe, 2021 – 2031 (US$M) |
| Figure 13‑9: LDR Brachytherapy Iodine Seed Market, Europe, 2021 – 2031 |
| Figure 13‑10: Procedures by Country, LDR Brachytherapy Iodine Seed Market, Europe, 2021 – 2031 |
| Figure 13‑11: Average Selling Price by Country, LDR Brachytherapy Iodine Seed Market, Europe, 2021 – 2031 (€) |
| Figure 13‑12: Average Selling Price by Country, LDR Brachytherapy Iodine Seed Market, Europe, 2021 – 2031 (US$) |
| Figure 13‑13: Market Value by Country, LDR Brachytherapy Iodine Seed Market, Europe, 2021 – 2031 (€M) |
| Figure 13‑14: Market Value by Country, LDR Brachytherapy Iodine Seed Market, Europe, 2021 – 2031 (US$M) |
| Figure 13‑15: Leading Competitors, LDR Brachytherapy Device Market, Europe, 2024 |
| Figure 14‑1: Nephrostomy Device Market by Segment, Europe, 2021 – 2031 (€M) |
| Figure 14‑2: Nephrostomy Device Market by Segment, Europe, 2021 – 2031 (US$M) |
| Figure 14‑3: Percutaneous Nephrostomy Set Market, Europe, 2021 – 2031 |
| Figure 14‑4: Units Sold by Country, Percutaneous Nephrostomy Set Market, Europe, 2021 – 2031 |
| Figure 14‑5: Average Selling Price by Country, Percutaneous Nephrostomy Set Market, Europe, 2021 – 2031 (€) |
| Figure 14‑6: Average Selling Price by Country, Percutaneous Nephrostomy Set Market, Europe, 2021 – 2031 (US$) |
| Figure 14‑7: Market Value by Country, Percutaneous Nephrostomy Set Market, Europe, 2021 – 2031 (€M) |
| Figure 14‑8: Market Value by Country, Percutaneous Nephrostomy Set Market, Europe, 2021 – 2031 (US$M) |
| Figure 14‑9: Nephrostomy Balloon Catheter Market, Europe, 2021 – 2031 |
| Figure 14‑10: Units Sold by Country, Nephrostomy Balloon Catheter Market, Europe, 2021 – 2031 |
| Figure 14‑11: Average Selling Price by Country, Nephrostomy Balloon Catheter Market, Europe, 2021 – 2031 (€) |
| Figure 14‑12: Average Selling Price by Country, Nephrostomy Balloon Catheter Market, Europe, 2021 – 2031 (US$) |
| Figure 14‑13: Market Value by Country, Nephrostomy Balloon Catheter Market, Europe, 2021 – 2031 (€M) |
| Figure 14‑14: Market Value by Country, Nephrostomy Balloon Catheter Market, Europe, 2021 – 2031 (US$M) |
| Figure 14‑15: Nephrostomy Drainage Tube Market, Europe, 2021 – 2031 |
| Figure 14‑16: Units Sold by Country, Nephrostomy Drainage Tube Market, Europe, 2021 – 2031 |
| Figure 14‑17: Average Selling Price by Country, Nephrostomy Drainage Tube Market, Europe, 2021 – 2031 (€) |
| Figure 14‑18: Average Selling Price by Country, Nephrostomy Drainage Tube Market, Europe, 2021 – 2031 (US$) |
| Figure 14‑19: Market Value by Country, Nephrostomy Drainage Tube Market, Europe, 2021 – 2031 (€M) |
| Figure 14‑20: Market Value by Country, Nephrostomy Drainage Tube Market, Europe, 2021 – 2031 (US$M) |
| Figure 14‑21: Leading Competitors, Nephrostomy Device Market, Europe, 2024 |
| Figure 15‑1: Men’s Reproductive Health Device Market by Segment, Europe, 2021 – 2031 (€M) |
| Figure 15‑2: Men’s Reproductive Health Device Market by Segment, Europe, 2021 – 2031 (US$M) |
| Figure 15‑3: Total Men’s Reproductive Health Device Market, Europe, 2021 – 2031 |
| Figure 15‑4: Units Sold by Country, Total Men’s Reproductive Health Device Market, Europe, 2021 – 2031 |
| Figure 15‑5: Average Selling Price by Country, Total Men’s Reproductive Health Device Market, Europe, 2021 – 2031 (€) |
| Figure 15‑6: Average Selling Price by Country, Total Men’s Reproductive Health Device Market, Europe, 2021 – 2031 (US$) |
| Figure 15‑7: Market Value by Country, Total Men’s Reproductive Health Device Market, Europe, 2021 – 2031 (€M) |
| Figure 15‑8: Market Value by Country, Total Men’s Reproductive Health Device Market, Europe, 2021 – 2031 (US$M) |
| Figure 15‑9: Inflatable Erectile Dysfunction Device Market, Europe, 2021 – 2031 |
| Figure 15‑10: Units Sold by Country, Inflatable Erectile Dysfunction Device Market, Europe, 2021 – 2031 |
| Figure 15‑11: Average Selling Price by Country, Inflatable Erectile Dysfunction Device Market, Europe, 2021 – 2031 (€) |
| Figure 15‑12: Average Selling Price by Country, Inflatable Erectile Dysfunction Device Market, Europe, 2021 – 2031 (US$) |
| Figure 15‑13: Market Value by Country, Inflatable Erectile Dysfunction Device Market, Europe, 2021 – 2031 (€M) |
| Figure 15‑14: Market Value by Country, Inflatable Erectile Dysfunction Device Market, Europe, 2021 – 2031 (US$M) |
| Figure 15‑15: Malleable Erectile Dysfunction Device Market, Europe, 2021 – 2031 |
| Figure 15‑16: Units Sold by Country, Malleable Erectile Dysfunction Device Market, Europe, 2021 – 2031 |
| Figure 15‑17: Average Selling Price by Country, Malleable Erectile Dysfunction Device Market, Europe, 2021 – 2031 (€) |
| Figure 15‑18: Average Selling Price by Country, Malleable Erectile Dysfunction Device Market, Europe, 2021 – 2031 (US$) |
| Figure 15‑19: Market Value by Country, Malleable Erectile Dysfunction Device Market, Europe, 2021 – 2031 (€M) |
| Figure 15‑20: Market Value by Country, Malleable Erectile Dysfunction Device Market, Europe, 2021 – 2031 (US$M) |
| Figure 15‑21: Leading Competitors, Men’s Reproductive Health Device Market, Europe, 2024 |
| Figure 16‑1: Urinary Guidewire Market, Europe, 2021 – 2031 |
| Figure 16‑2: Leading Competitors, Urinary Guidewire Market, Europe, 2024 |