| Figure 1‑1: Medical Imaging Market Share Ranking by Segment, U.S., 2023 (1 of 2) |
| Figure 1‑2: Medical Imaging Market Share Ranking by Segment, U.S., 2023 (2 of 2) |
| Figure 1‑3: Companies Researched in This Report |
| Figure 1‑4: Factors Impacting the Medical Imaging Market by Segment, U.S. (1 of 2) |
| Figure 1‑5: Factors Impacting the Medical Imaging Market by Segment, U.S. (2 of 2) |
| Figure 1‑6: Recent Events in the U.S. Medical Imaging Market, U.S., 2019 – 2023 (1 of 2) |
| Figure 1‑7: Recent Events in the U.S. Medical Imaging Market, U.S., 2019 – 2023 (2 of 2) |
| Figure 1‑8: U.S. Medical Imaging Procedures Covered (1 of 4) |
| Figure 1‑9: U.S. Medical Imaging Procedures Covered (2 of 4) |
| Figure 1‑10: U.S. Medical Imaging Procedures Covered (3 of 4) |
| Figure 1‑11: U.S. Medical Imaging Procedures Covered (4 of 4) |
| Figure 1‑12: Procedure Codes Investigated (1 of 3) |
| Figure 1‑13: Procedure Codes Investigated (2 of 3) |
| Figure 1‑14: Procedure Codes Investigated (3 of 3) |
| Figure 1‑15: U.S. Medical Imaging Markets Covered (1 of 3) |
| Figure 1‑16: U.S. Medical Imaging Markets Covered (2 of 3) |
| Figure 1‑17: U.S. Medical Imaging Markets Covered (3 of 3) |
| Figure 1‑18: Key Report Updates |
| Figure 1‑19: Version History |
| Figure 2‑1: U.S. Medical Imaging Market by Segment, Worst Case Scenario, U.S., 2020 – 2030 (US$M) (1 of 2) |
| Figure 2‑2: U.S. Medical Imaging Market by Segment, Worst Case Scenario, U.S., 2020 – 2030 (US$M) (2 of 2) |
| Figure 2‑3: U.S. Medical Imaging Market by Segment, Worst Case Scenario, U.S., 2020 – 2030 (US$M) (1 of 2) |
| Figure 2‑4: U.S. Medical Imaging Market by Segment, Worst Case Scenario, U.S., 2020 – 2030 (US$M) (2 of 2) |
| Figure 2‑5: U.S. Medical Imaging Market by Segment, Worst Case Scenario, U.S., 2020 – 2030 (US$M) (1 of 2) |
| Figure 2‑6: U.S. Medical Imaging Market by Segment, Worst Case Scenario, U.S., 2020 – 2030 (US$M) (2 of 2) |
| Figure 3‑1: Analog X-ray Devices by Company |
| Figure 3‑2: Computed Radiography X-ray Devices by Company |
| Figure 3‑3: Digital Radiography X-ray Devices by Company (1 of 2) |
| Figure 3‑4: Digital Radiography X-ray Devices by Company (2 of 2) |
| Figure 3‑5: Fluoroscopy Devices by Company (1 of 2) |
| Figure 3‑6: Fluoroscopy Devices by Company (2 of 2) |
| Figure 3‑7: Cardiovascular X-ray Devices by Company |
| Figure 3‑8: Computed Radiography Mammography Devices by Company |
| Figure 3‑9: Digital Radiography Mammography Devices by Company |
| Figure 3‑10: Digital Breast Tomosynthesis Devices by Company |
| Figure 3‑11: Positron Emission Mammography Devices by Company |
| Figure 3‑12: Gamma Imaging Devices by Company |
| Figure 3‑13: Breast Ultrasound Devices by Company |
| Figure 3‑14: MRI Coil Market by Company |
| Figure 3‑15: Magnetic Resonance Imaging Market by Company (1 of 2) |
| Figure 3‑16: Magnetic Resonance Imaging Market by Company (2 of 2) |
| Figure 3‑17: Cardiology Ultrasound Devices by Company |
| Figure 3‑18: Radiology Ultrasound Devices by Company |
| Figure 3‑19: OB/GYN Ultrasound Devices by Company (1 of 2) |
| Figure 3‑20: OB/GYN Ultrasound Devices by Company (2 of 2) |
| Figure 3‑21: Urology Ultrasound Devices by Company |
| Figure 3‑22: Surgery Ultrasound Devices by Company |
| Figure 3‑23: Vascular Ultrasound Devices by Company |
| Figure 3‑24: Ophthalmic Ultrasound Devices by Company |
| Figure 3‑25: Point-of-Care Ultrasound Imaging Devices by Company |
| Figure 3‑26: Computed Tomography Imaging Market by Company |
| Figure 3‑27: PET/CT Devices by Company |
| Figure 3‑28: SPECT Devices by Company |
| Figure 3‑29: SPECT/CT Devices by Company |
| Figure 3‑30: 1.2.7 X-ray and CT Contrast Agent and Injector by Company |
| Figure 3‑31: MRI Contrast Agent and Injector by Company |
| Figure 3‑32: Ultrasound Contrast Agent and Injector by Company |
| Figure 3‑33: Contrast Injector by Company |
| Figure 3‑34: Class 2 Device Recall Philips Allura Xper, Allura Centron, Allura CV, Azurion, UNIQ Clarity, and MultiDiagnostEleva System |
| Figure 3‑35: Class 2 Device Recall DigitalDiagnost C90 |
| Figure 3‑36: Class 2 Device Recall Philips |
| Figure 3‑37: Class 2 Device Recall FDR AQRO (DRXD 1000) |
| Figure 3‑38: Class 2 Device Recall Luminos Agile Max |
| Figure 3‑39: Class 2 Device Recall Luminos dRF Max, Luminos Agile Max, Uroskop Omnia Max, Multitom Rax |
| Figure 3‑40: Class 2 Device Recall DigitalDiagnost C50 |
| Figure 3‑41: Class 2 Device Recall DigitalDiagnost C90 |
| Figure 3‑42: Class 2 Device Recall DigitalDiagnost |
| Figure 3‑43: Class 2 Device Recall ProxiDiagnost N90 |
| Figure 3‑44: Class 2 Device Recall Omnera |
| Figure 3‑45: Class 2 Device Recall Interventional Fluoroscopic Xray System |
| Figure 3‑46: Class 2 Device Recall DR 800 with MUSICA Dynamic |
| Figure 3‑47: Class 2 Device Recall Agfa DR 800 |
| Figure 3‑48: Class 2 Device Recall Ysio Max |
| Figure 3‑49: Class 2 Device Recall Ysio Max |
| Figure 3‑50: Class 2 Device Recall Cardio Vascular Allura Centron Interventional Fluoroscopic Xray System |
| Figure 3‑51: Class 2 Device Recall Fujifilm FDR Go Plus Mobile Xray System |
| Figure 3‑52: Class 2 Device Recall AGFA Digital Radiography X Ray System DR 800 |
| Figure 3‑53: Class 2 Device Recall Hologic |
| Figure 3‑54: Class 2 Device Recall EPIQ Ultrasound Systems, Model: EPIQ Elite, EPIQ 5G, EPIQ 5C, EPIQ 5W, EPIQ 7G, EPIQ 7C, EPIQ 7W, EP |
| Figure 3‑55: Class 2 Device Recall Philips EPIQ Diagnostic Ultrasound System |
| Figure 3‑56: Class 2 Device Recall MAMMOMAT Revelation |
| Figure 3‑57: Class 2 Device Recall Selenia Dimensions Mammography System |
| Figure 3‑58: Class 2 Device Recall MAMMOMAT Revelation |
| Figure 3‑59: Class 2 Device Recall GE Senographe Pristina |
| Figure 3‑60: Class 2 Device Recall Philips Ingenia Elition S |
| Figure 3‑61: Class 2 Device Recall Philips Ingenia Elition X |
| Figure 3‑62: Class 2 Device Recall SIGNA Premier |
| Figure 3‑63: Class 2 Device Recall GE Healthcare MR Systems. |
| Figure 3‑64: Class 2 Device Recall Signa 1.5T TwinSpeed |
| Figure 3‑65: Class 2 Device Recall 1.5T SIGNA Excite HD, 3.0T SIGNA Excite HD |
| Figure 3‑66: Class 2 Device Recall SIGNA Excite 3T |
| Figure 3‑67: Class 2 Device Recall 1.5T and 3.0T SIGNA HDx, 1.5T and 3.0T SIGNA HDxt, and 1.5T SIGNA HDxt Mobile |
| Figure 3‑68: Class 2 Device Recall SIGNA Architect |
| Figure 3‑69: Class 2 Device Recall SIGNA Artist |
| Figure 3‑70: Class 2 Device Recall SIGNA Creator, SIGNA Explorer |
| Figure 3‑71: Class 2 Device Recall SIGNA Voyager |
| Figure 3‑72: Class 2 Device Recall SIGNA Pioneer |
| Figure 3‑73: Class 2 Device Recall SIGNA Premier |
| Figure 3‑74: Class 2 Device Recall SIGNA Premier |
| Figure 3‑75: Class 2 Device Recall SIGNA Artist |
| Figure 3‑76: Class 2 Device Recall SIGNA Architect |
| Figure 3‑77: Class 2 Device Recall SIGNA Pioneer |
| Figure 3‑78: Class 2 Device Recall SIGNA Voyager |
| Figure 3‑79: Class 2 Device Recall SIGNA Creator, SIGNA Explorer |
| Figure 3‑80: Class 2 Device Recall SIGNA MR355, SIGNA MR360 |
| Figure 3‑81: Class 2 Device Recall Vantage Galan 3T |
| Figure 3‑82: Class 2 Device Recall ACUSON Redwood Systems with Software Version 2.0 |
| Figure 3‑83: Class 2 Device Recall GE Healthcare Vivid |
| Figure 3‑84: Class 2 Device Recall NovaGuide Intelligent Ultrasound System |
| Figure 3‑85: Class 2 Device Recall Vivid S5 |
| Figure 3‑86: Class 2 Device Recall Vivid S5 N |
| Figure 3‑87: Class 2 Device Recall Vivid S6 |
| Figure 3‑88: Class 2 Device Recall Vivid S6 N |
| Figure 3‑89: Class 2 Device Recall Vivid q |
| Figure 3‑90: Class 2 Device Recall Vivid q N |
| Figure 3‑91: Class 2 Device Recall Vivid i |
| Figure 3‑92: Class 2 Device Recall Vivid i N |
| Figure 3‑93: Class 2 Device Recall Canon Aplio Ultrasound System |
| Figure 3‑94: Class 2 Device Recall ACUSON Juniper Diagnostic Ultrasound System |
| Figure 3‑95: Class 2 Device Recall ACUSON Sequoia Ultrasound Imaging System |
| Figure 3‑96: Class 2 Device Recall Fujifilm |
| Figure 3‑97: Class 2 Device Recall EPIQ CVxi Diagnostic Ultrasound Systems |
| Figure 3‑98: Class 2 Device Recall Philips EPIQ Diagnostic Ultrasound Systems |
| Figure 3‑99: Class 2 Device Recall Philips Afiniti Diagnostic Ultrasound Systems |
| Figure 3‑100: Class 2 Device Recall EPIQ Ultrasound Systems, Model: EPIQ Elite, EPIQ 5G, EPIQ 5C, EPIQ 5W, EPIQ 7G, EPIQ 7C, EPIQ 7W, EP |
| Figure 3‑101: Class 2 Device Recall ACUSON Juniper ultrasound imaging system |
| Figure 3‑102: Class 2 Device Recall Philips Incisive CT |
| Figure 3‑103: Class 2 Device Recall Philips |
| Figure 3‑104: Class 2 Device Recall Spectral CT 7500 |
| Figure 3‑105: Class 2 Device Recall Incisive CT |
| Figure 3‑106: Class 2 Device Recall SOMATOM Confidence |
| Figure 3‑107: Class 2 Device Recall SOMATOM Edge Plus |
| Figure 3‑108: Class 2 Device Recall SOMATOM Definition AS |
| Figure 3‑109: Class 2 Device Recall SOMATOM Definition Edge |
| Figure 3‑110: Class 2 Device Recall Siemens |
| Figure 3‑111: Class 2 Device Recall Revolution CT, Revolution CT ES, Revolution Apex, Revolution CT with Apex Edition |
| Figure 3‑112: Class 2 Device Recall Philips |
| Figure 3‑113: Class 2 Device Recall Revolution CT with Apex Edition CT System |
| Figure 3‑114: Class 2 Device Recall Biograph mCT, Biograph Horizon, Biograph Vision |
| Figure 3‑115: Class 2 Device Recall Symbia |
| Figure 3‑116: Class 2 Device Recall GE NM/CT 850 |
| Figure 3‑117: Class 2 Device Recall GE NM/CT 860 |
| Figure 3‑118: Class 2 Device Recall Optima NM/CT 640 |
| Figure 3‑119: Class 2 Device Recall MEDRAD Stellant FLEX Syringe Kits |
| Figure 3‑120: Optimization of Bedside Chest X-rays Taken in the Intensive Care Unit by Using Current Software-Based Techniques |
| Figure 3‑121: Identify Coronavirus Disease by Chest X-ray |
| Figure 3‑122: Next Generation X-ray Imaging System |
| Figure 3‑123: Radiation Dose Reduction Using Advanced Fluoroscopy Options in Coronary Cath Lab |
| Figure 3‑124: Chest X-ray in Diagnosis of Heart Failure |
| Figure 3‑125: Comparison of Breast Cancer Screening with CESM to DBT in Women with Dense Breasts (CMIST) |
| Figure 3‑126: Preoperative Magnetic Resonance Imaging to Obtain Adequate Resection Margins in Breast Conserving Surgery, (PRIMAR) Trial |
| Figure 3‑127: Novel Thermal Imaging Technique for Breast Screening |
| Figure 3‑128: An Imaging Technology, Contrast-Enhanced Mammography, in Predicting Breast Cancer |
| Figure 3‑129: Mammography, Early Detection Biomarkers, Risk Assessment, and Imaging Technologies, MERIT Study |
| Figure 3‑130: Automated Breast Ultrasound as an Adjunct to Screening Digital Breast Tomosynthesis (AMELIA) |
| Figure 3‑131: Discomfort Assessment of Senographe Pristina Patient-assisted Versus Standard Compression Mode and Quality Assessment of Screening Mammograms |
| Figure 3‑132: Breast Density Measurements in Digital Mammography and Breast Tomosynthesis Systems of Different Pixel Size |
| Figure 3‑133: Simulated Screening Study for Breast Imaging |
| Figure 3‑134: Molecular Breast Imaging in Screening Breast Cancer |
| Figure 3‑135: Evaluation of New Magnetic Resonance Techniques |
| Figure 3‑136: New Heart Imaging Techniques to Evaluate Possible Heart Disease |
| Figure 3‑137: Magnetic Resonance Imaging of Breast Cancer |
| Figure 3‑138: Development of Magnetic Resonance Spectroscopic Imaging Techniques for Imaging Metabolites in Human Brain and Muscle |
| Figure 3‑139: MR Imaging- Guided High Intensity Focused Ultrasound (HIFU) Therapy of Bone Metastases |
| Figure 3‑140: Refinement and Assessment of New Magnetic Resonance Imaging Technologies for Neurological Exams |
| Figure 3‑141: A Percutaneous Ultrasound Device with Needle Guide for Vascular Access |
| Figure 3‑142: 3D Ultrasound Breast Imaging |
| Figure 3‑143: Ultrasound Imaging of Kidney Stones and Lithotripsy |
| Figure 3‑144: Safety and Effectiveness of the Ultrasonic Propulsion of Kidney Stones |
| Figure 3‑145: Point of Care Ultrasound in Obstetric Triage (POCUS) |
| Figure 3‑146: Point-of-Care Ultrasound in Primary Care (POCUS iGP 1) |
| Figure 3‑147: Use of POC Pocket Ultrasound in the Estimation of Left and Right Atrial Pressures |
| Figure 3‑148: Point of Care Ultrasonography |
| Figure 3‑149: Prospective Evaluation of Myocardial Perfusion Computed Tomography Trial (PERFUSERCT) |
| Figure 3‑150: Computed Tomography vs. Endoscopy Study |
| Figure 3‑151: Computed Tomography Scanning in ICU |
| Figure 3‑152: Evaluating New Radiation Techniques for Cardiovascular Imaging |
| Figure 3‑153: 4D CT Scan Versus 3D CT Scan Concerning Cardiac Dosimetry Assessment for Left Sided Breast Cancers Radiotherapy |
| Figure 3‑154: Spectral CT Clinical Trial Protocol |
| Figure 3‑155: Computed Tomography for COVID-19 Diagnosis |
| Figure 3‑156: Fluorocholine PET/CT Basket Trial |
| Figure 3‑157: SPECT-CT vs MRI for the Diagnosis of Osteoarthritis in the Foot and Ankle |
| Figure 3‑158: SPECT/CT for the Characterization of Renal Masses |
| Figure 3‑159: Gated and Non-Gated Dynamic PET/CT Imaging |
| Figure 3‑160: Assessing Ultra-low Dose PET/CT and CT-less PET Using a Long Axial Field-of-view PET/CT System |
| Figure 3‑161: Evaluation of a New Generation of PET-CT OMNI |
| Figure 3‑162: Demonstration of a Next Generation PET CT System |
| Figure 3‑163: Standard PET/CT vs. Digital PET/CT |
| Figure 3‑164: Radio-opaque Contrast Agents for Liver Cancer Targeting with KIM During Radiation Therapy (ROCK-RT) |
| Figure 3‑165: Dotarem vs Gadobutrol Contrast for Breast MRI |
| Figure 3‑166: Chest CT Using Low-Concentration Iodine Contrast Media |
| Figure 3‑167: A Study Called GUS to Understand How Much of the Contrast Agent Gadavist Is Used and How Much Is Wasted in Two Different Containers (Single-Dose Vials and Imaging Bulk Packages) in a Real-World Setting |
| Figure 3‑168: Negative Oral Contrast Agents Utilization in PET/CT Studies |
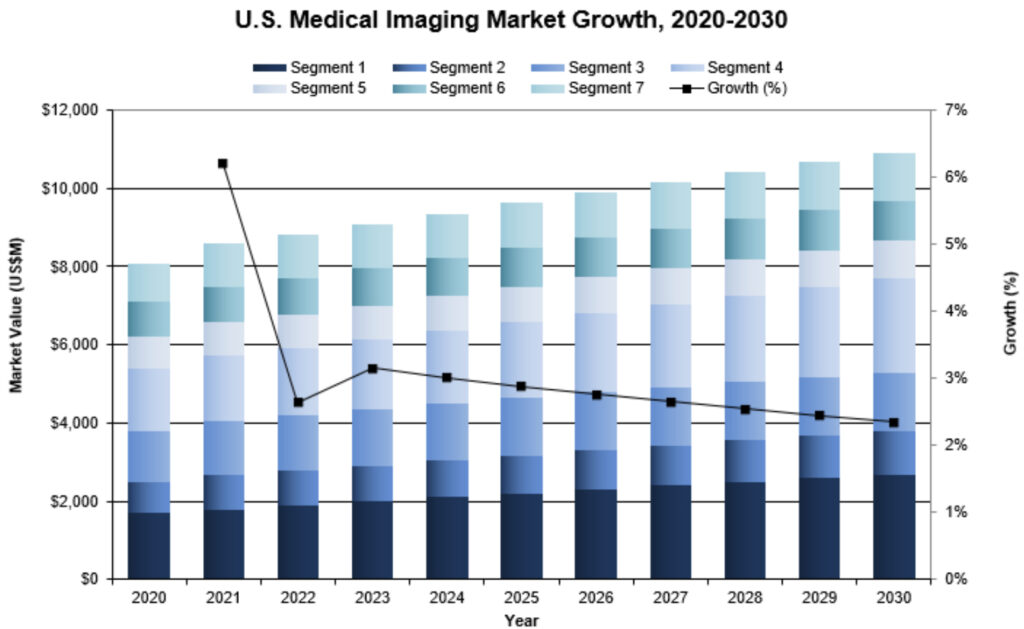
| Figure 4‑1: U.S. Medical Imaging Market by Segment, U.S., 2020 – 2030 (US$M) (1 of 2) |
| Figure 4‑2: U.S. Medical Imaging Market by Segment, U.S., 2020 – 2030 (US$M) (2 of 2) |
| Figure 4‑3: Leading Competitors, U.S. Medical Imaging Market, U.S., 2023 (1 of 2) |
| Figure 4‑4: Leading Competitors, U.S. Medical Imaging Market, U.S., 2023 (2 of 2) |
| Figure 4‑5: SWOT Analysis, Bayer |
| Figure 4‑6: SWOT Analysis, Canon Medical |
| Figure 4‑7: SWOT Analysis, Fujifilm |
| Figure 4‑8: SWOT Analysis, Hologic |
| Figure 5‑1: Procedure Codes Investigated (1 of 3) |
| Figure 5‑2: Procedure Codes Investigated (2 of 3) |
| Figure 5‑3: Procedure Codes Investigated (3 of 3) |
| Figure 5‑4: U.S. Medical Imaging Procedures by Segment, U.S., 2020 – 2030 |
| Figure 5‑5: X-ray Procedures by Segment, U.S., 2020 – 2030 |
| Figure 5‑6: Diagnostic X-ray Procedures by Anatomy, U.S., 2020 – 2030 (1 of 4) |
| Figure 5‑7: Diagnostic X-ray Procedures by Anatomy, U.S., 2020 – 2030 (2 of 4) |
| Figure 5‑8: Diagnostic X-ray Procedures by Anatomy, U.S., 2020 – 2030 (3 of 4) |
| Figure 5‑9: Diagnostic X-ray Procedures by Anatomy, U.S., 2020 – 2030 (4 of 4) |
| Figure 5‑10: Fluoroscopy X-ray Procedures by Type, U.S., 2020 – 2030 |
| Figure 5‑11: Cardiovascular X-ray Procedures by Anatomy, U.S., 2020 – 2030 |
| Figure 5‑12: Breast Imaging Procedures by Modality, U.S., 2020 – 2030 |
| Figure 5‑13: Magnetic Resonance Imaging Procedures by Modality, U.S., 2020 – 2030 |
| Figure 5‑14: Diagnostic Magnetic Resonance Imaging Procedures by Anatomy, U.S., 2020 – 2030 (1 of 3) |
| Figure 5‑15: Diagnostic Magnetic Resonance Imaging Procedures by Anatomy, U.S., 2020 – 2030 (2 of 3) |
| Figure 5‑16: Diagnostic Magnetic Resonance Imaging Procedures by Anatomy, U.S., 2020 – 2030 (3 of 3) |
| Figure 5‑17: Magnetic Resonance Angiography Procedures by Anatomy, U.S., 2020 – 2030 (1 of 2) |
| Figure 5‑18: Magnetic Resonance Angiography Procedures by Anatomy, U.S., 2020 – 2030 (2 of 2) |
| Figure 5‑19: Guidance Magnetic Resonance Imaging Procedures, U.S., 2020 – 2030 |
| Figure 5‑20: Intraoperative Magnetic Resonance Imaging Procedures, U.S., 2020 – 2030 |
| Figure 5‑21: Ultrasound Procedures by Type, U.S., 2020 – 2030 |
| Figure 5‑22: Ultrasound Procedures by Anatomy, U.S., 2020 – 2030 (1 of 2) |
| Figure 5‑23: Ultrasound Procedures by Anatomy, U.S., 2020 – 2030 (2 of 2) |
| Figure 5‑24: Cardiac Ultrasound Procedures, U.S. by Type, 2020 – 2030 |
| Figure 5‑25: Ultrasound Guidance Procedures, U.S., 2020 – 2030 |
| Figure 5‑26: Computed Tomography Procedures by Type, U.S., 2020 – 2030 |
| Figure 5‑27: Diagnostic Computed Tomography Procedures by Anatomy, U.S., 2020 – 2030 (1 of 3) |
| Figure 5‑28: Diagnostic Computed Tomography Procedures by Anatomy, U.S., 2020 – 2030 (2 of 3) |
| Figure 5‑29: Diagnostic Computed Tomography Procedures by Anatomy, U.S., 2020 – 2030 (3 of 3) |
| Figure 5‑30: Computed Tomography Angiography Procedures by Anatomy, U.S., 2020 – 2030 (1 of 2) |
| Figure 5‑31: Computed Tomography Angiography Procedures by Anatomy, U.S., 2020 – 2030 (2 of 2) |
| Figure 5‑32: Computed Tomography Guidance Procedures, U.S., 2020 – 2030 |
| Figure 5‑33: Nuclear Medicine Procedures by Modality, U.S., 2020 – 2030 |
| Figure 5‑34: SPECT Procedures by Anatomy, U.S., 2020 – 2030 (1 of 2) |
| Figure 5‑35: SPECT Procedures by Modality, U.S., 2020 – 2030 (2 of 2) |
| Figure 5‑36: PET Procedures by Anatomy, U.S., 2020 – 2030 |
| Figure 6‑1: X-ray Imaging Market by Segment, U.S., 2020 – 2030 (US$M) |
| Figure 6‑2: Total X-ray Market, U.S., 2020 – 2030 |
| Figure 6‑3: Analog X-ray Market, U.S., 2020 – 2030 |
| Figure 6‑4: Computed Radiography X-ray Market, U.S., 2020 – 2030 |
| Figure 6‑5: Digital Radiography X-ray Market, U.S., 2020 – 2030 |
| Figure 6‑6: Fluoroscopy Radiography X-ray Market, U.S., 2020 – 2030 |
| Figure 6‑7: Cardiovascular X-ray Market, U.S., 2020 – 2030 |
| Figure 6‑8: Leading Competitors, X-ray Market, U.S., 2023 |
| Figure 7‑1: Breast Imaging Market by Type, U.S., 2020 – 2030 (US$M) |
| Figure 7‑2: Mammography Market by Segment, U.S., 2020 – 2030 (US$M) |
| Figure 7‑3: Computed Radiography Market by Segment, U.S., 2020 – 2030 (US$M) |
| Figure 7‑4: Digital Radiography Market, U.S., 2020 – 2030 (US$M) |
| Figure 7‑5: Digital Tomosynthesis Market, U.S., 2020 – 2030 (US$M) |
| Figure 7‑6: Molecular Breast Imaging Market by Type, U.S., 2020 – 2030 (US$M) |
| Figure 7‑7: Total Molecular Breast Imaging Market, U.S., 2020 – 2030 (US$M) |
| Figure 7‑8: Positron Emission Mammography Market, U.S., 2020 – 2030 (US$M) |
| Figure 7‑9: Gamma Imaging Market, U.S., 2020 – 2030 (US$M) |
| Figure 7‑10: Ultrasound Breast Imaging Market by Type, U.S., 2020 – 2030 (US$M) |
| Figure 7‑11: Total Breast Ultrasound, U.S., 2020 – 2030 |
| Figure 7‑12: Manual Breast Market, U.S., 2020 – 2030 (US$M) |
| Figure 7‑13: Automated Breast Ultrasound Market, U.S., 2020 – 2030 (US$M) |
| Figure 7‑14: MRI Coil Market, U.S., 2020 – 2030 |
| Figure 7‑15: Leading Competitors, Breast Imaging Market, U.S., 2023 |
| Figure 8‑1: MRI Market by Type, U.S., 2020 – 2030 (US$M) |
| Figure 8‑2: Total Closed-Bore MRI Market by Segment, 2020 – 2030 (US$M) |
| Figure 8‑3: Low-Field Closed-Bore MRI Market, U.S., 2020 – 2030 |
| Figure 8‑4: Mid-Field Closed-bore MRI Market, U.S., 2020 – 2030 |
| Figure 8‑5: High-Field Closed-Bore MRI Market, U.S., 2020 – 2030 |
| Figure 8‑6: Total Wide-Bore MRI Market by Segment, 2020 – 2030 (US$M) |
| Figure 8‑7: Low-Field Wide-Bore MRI Market, U.S., 2020 – 2030 |
| Figure 8‑8: Mid-Field Wide-Bore MRI Market, U.S., 2020 – 2030 |
| Figure 8‑9: High-Field Wide-Bore MRI Market, U.S., 2020 – 2030 |
| Figure 8‑10: Leading Competitors, Magnetic Resonance Imaging Market, U.S., 2023 |
| Figure 9‑1: Ultrasound Market by Type, U.S., 2020 – 2030 (US$M) (1 of 2) |
| Figure 9‑2: Ultrasound Market by Type, U.S., 2020 – 2030 (US$M) (2 of 2) |
| Figure 9‑3: Total Ultrasound Imaging Market, U.S., 2020 – 2030 |
| Figure 9‑4: Cardiology Ultrasound Market, U.S., 2020 – 2030 |
| Figure 9‑5 High-End Cardiology Ultrasound Market, U.S., 2020 – 2030 |
| Figure 9‑6 Hand Carried Cardiology Ultrasound Market, U.S., 2020 – 2030 |
| Figure 9‑7 Hospital Cardiology Ultrasound Market, U.S., 2020 – 2030 |
| Figure 9‑8 Office Cardiology Ultrasound Market, U.S., 2020 – 2030 |
| Figure 9‑9: Radiology Ultrasound Market, U.S., 2020 – 2030 |
| Figure 9‑10 High-End Radiology Ultrasound Market, U.S., 2020 – 2030 |
| Figure 9‑11 Hand Carried Radiology Ultrasound Market, U.S., 2020 – 2030 |
| Figure 9‑12 Hospital Radiology Ultrasound Market, U.S., 2020 – 2030 |
| Figure 9‑13 Office Radiology Ultrasound Market, U.S., 2020 – 2030 |
| Figure 9‑14: Obstetrics and Gynecology Ultrasound Market, U.S., 2020 – 2030 |
| Figure 9‑15 High-End Obstetrics and Gynecology Ultrasound Market, U.S., 2020 – 2030 |
| Figure 9‑16 Hand Carried Obstetrics and Gynecology Ultrasound Market, U.S., 2020 – 2030 |
| Figure 9‑17 Hospital Obstetrics and Gynecology Ultrasound Market, U.S., 2020 – 2030 |
| Figure 9‑18 Office Obstetrics and Gynecology Ultrasound Market, U.S., 2020 – 2030 |
| Figure 9‑19: Urology Ultrasound Market, U.S., 2020 – 2030 |
| Figure 9‑20 High-End Urology Ultrasound Market, U.S., 2020 – 2030 |
| Figure 9‑21 Hand Carried Urology Ultrasound Market, U.S., 2020 – 2030 |
| Figure 9‑22 Hospital Urology Ultrasound Market, U.S., 2020 – 2030 |
| Figure 9‑23 Office Urology Ultrasound Market, U.S., 2020 – 2030 |
| Figure 9‑24: Surgery Ultrasound Market, U.S., 2020 – 2030 |
| Figure 9‑25: Vascular Ultrasound Market, U.S., 2020 – 2030 |
| Figure 9‑26: Ophthalmic Ultrasound Equipment Market by Segment, U.S., 2020 – 2030 (US$M) |
| Figure 9‑27: Total Ophthalmic Ultrasound Market, U.S., 2020 – 2030 |
| Figure 9‑28: Pachymeter Ultrasound Market, U.S., 2020 – 2030 |
| Figure 9‑29: A-Scan Ultrasound Market, U.S., 2020 – 2030 |
| Figure 9‑30: B-Scan Ultrasound Market, U.S., 2020 – 2030 |
| Figure 9‑31: A/B Scan Ultrasound Market, U.S., 2020 – 2030 |
| Figure 9‑32: Ultrasound Biomicroscope Market, U.S., 2020 – 2030 |
| Figure 9‑33: Point-of-Care Ultrasound Market by Segment, U.S., 2020 – 2030 (US$M) |
| Figure 9‑34: Total Point-of-Care Ultrasound Market, U.S., 2020 – 2030 |
| Figure 9‑35: Emergency Medicine Ultrasound Market, U.S., 2020 – 2030 |
| Figure 9‑36 Hand Carried Emergency Medicine Ultrasound Market, U.S., 2020 – 2030 |
| Figure 9‑37 Cart-Based Emergency Medicine Ultrasound Market, U.S., 2020 – 2030 |
| Figure 9‑38: Total Anesthesia Ultrasound Market, U.S., 2020 – 2030 |
| Figure 9‑39 Hand-Carried Anesthesia Ultrasound Market, U.S., 2020 – 2030 |
| Figure 9‑40 Cart-Based Anesthesia Ultrasound Market, U.S., 2020 – 2030 |
| Figure 9‑41 Regional Anesthesia Ultrasound Market, U.S., 2020 – 2030 |
| Figure 9‑42 General Anesthesia Ultrasound Market, U.S., 2020 – 2030 |
| Figure 9‑43: Critical Care Ultrasound Market, U.S., 2020 – 2030 |
| Figure 9‑44 Hand-Carried Critical Care Ultrasound Market, U.S., 2020 – 2030 |
| Figure 9‑45 Cart-Based Critical Care Ultrasound Market, U.S., 2020 – 2030 |
| Figure 9‑46: Musculoskeletal Ultrasound Market, U.S., 2020 – 2030 |
| Figure 9‑47: Other Point-of-Care Ultrasound Market, U.S., 2020 – 2030 |
| Figure 9‑48: Leading Competitors, Ultrasound Imaging Market, U.S., 2023 (1 of 2) |
| Figure 9‑49: Leading Competitors, Ultrasound Imaging Market, U.S., 2023 (2 of 2) |
| Figure 10‑1: Computed Tomography Imaging Market by Type, U.S., 2020 – 2030 (US$M) |
| Figure 10‑2: Total Computed Tomography Imaging Market, U.S., 2020 – 2030 |
| Figure 10‑3: 16/20 Slice Market, U.S., 2020 – 2030 |
| Figure 10‑4: 32/40 Slice Market, U.S., 2020 – 2030 |
| Figure 10‑5: 64 Slice Market, U.S., 2020 – 2030 |
| Figure 10‑6: Ultra-Premium Slice Market, U.S., 2020 – 2030 |
| Figure 10‑7: Leading Competitors, Computed Tomography Imaging Market, U.S., 2023 |
| Figure 11‑1: Nuclear Medicine Imaging Market by Type, U.S., 2020 – 2030 (US$M) |
| Figure 11‑2: PET/CT Nuclear Medicine Imaging Market, U.S., 2020 – 2030 |
| Figure 11‑3: SPECT Nuclear Medicine Imaging Market, U.S., 2020 – 2030 |
| Figure 11‑4: SPECT/CT Nuclear Medicine Imaging Market, U.S., 2020 – 2030 |
| Figure 11‑5: Leading Competitors, Nuclear Medicine Imaging Market, U.S., 2023 |
| Figure 12‑1: Contrast Agent and Injector Market by Segment, U.S., 2020 – 2030 (US$M) |
| Figure 12‑2: Total Contrast Agents by Segment, U.S., 2020 – 2030 (US$M) |
| Figure 12‑3: X-ray/CT Contrast Agent Market, U.S., 2020 – 2030 |
| Figure 12‑4: MRI Contrast Agent Market, U.S., 2020 – 2030 |
| Figure 12‑5: Ultrasound Contrast Agent Market, U.S., 2020 – 2030 |
| Figure 12‑6: Contrast Injector Market, U.S., 2020 – 2030 |
| Figure 12‑7: Leading Competitors, Computed Tomography Imaging Market, U.S., 2023 |