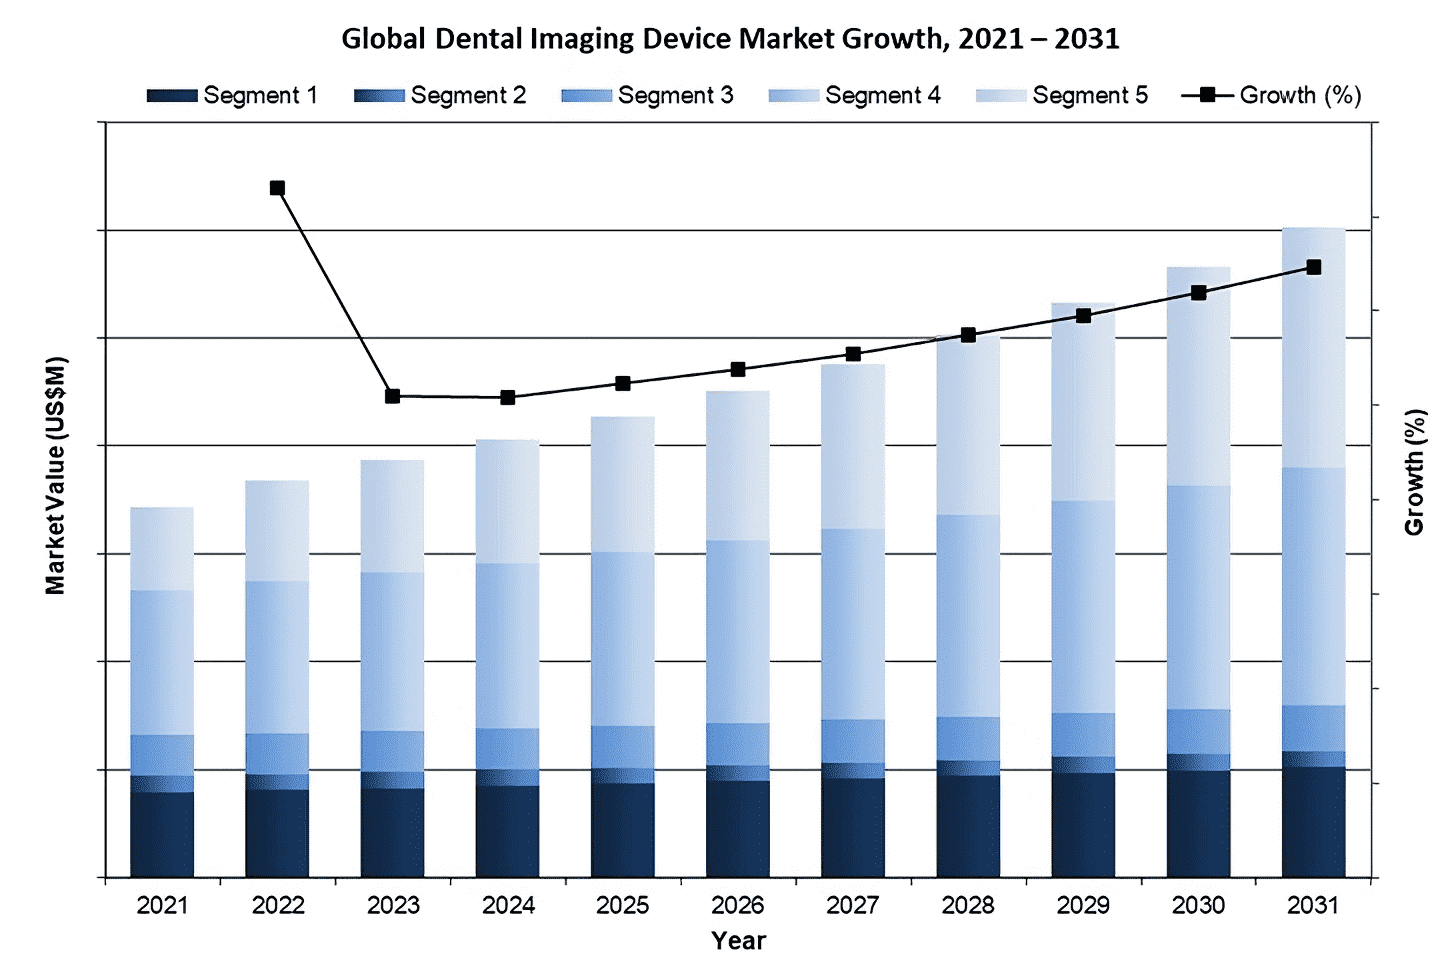
Dental Imaging Market Size, Share & COVID-19 Impact Analysis | Global | 2022-2028 | MedSuite | Includes: Intraoral X-Ray Imaging, Extraoral X-Ray Imaging, and 1 more
- Year: 2022
- Scope: 10 Years
- Region: Global
- Pages: 253
- Published Date: 07/12/2022
- Type: MedSuite
Overall, the Global dental imaging device market was valued at $2.5 billion in 2021. This is expected to increase over the forecast period and grow at a CAGR of 2% to reach $2.7 billion.
MARKET REPORT DATA TYPES INCLUDED
- Unit Sales, Average Selling Prices, Market Value & Growth Trends
- Forecasts Until 2028, and Historical Data to 2018
- Market Drivers & Limiters for Each Segment
- Competitive Analysis with Market Shares for Each Segment
- Recent Mergers & Acquisitions
- Procedure Volumes
- Company Profiles, Product Portfolios and SWOT for Top Competitors
- COVID-19 Impact Analysis
Global Dental Imaging Device Market Trends
Integration between devices is allowing CAD/CAM devices to have additional information and is aiding automated chairside milling. As these devices are becoming more standardized, so is the communication between all forms of imaging and photographing, improving dentist identification of typically unnoticed health concerns and aiding patient comfort during surgery.
GLOBAL DENTAL IMAGING DEVICE MARKET SHARE INSIGHTS
Overall, within the European Dental Imaging Device Market there are three dominant competitors: KaVo Kerr, Carestream, and Dentsply Sirona.
KaVo Kerr is the leading company in the global dental imaging market, holding a dominant share in both the intraoral X-ray imaging equipment and CBCT segments. KaVo Kerr has three dental sensors, the GXS-700™, IXS™ and the KaVo Kerr Titanium. In the intraoral X-ray segment, the company offered two options: the NOMAD Pro 2™ and the FOCUS™.
MARKET SEGMENTATION SUMMARY
While this report suite contains all Global Dental Imaging market data, each of the market segments is also available as a stand-alone report, MedCore. This allows you to get access to only the Dental Imaging market research that you need.
- Intraoral X-Ray Imaging – MedCore – Includes:
- Intraoral X-Ray Devices, PSP Systems, Digital Sensors, Analog Film, and PSP Plates.
- Extraoral X-Ray Systems – MedCore – Includes:
- Digital Panoramic Systems, and Pan/Ceph Systems.
- Cone Beam Computed Tomography Scanners – MedCore – Includes:
- Small FOV, Medium FOV, and Large FOV.
Research Scope Summary
Report Attribute | Details |
---|---|
Regions | North America (Canada, United States) Latin America (Argentina, Brazil, Chile, Colombia, Mexico, Peru, Venezuela) Western Europe (Austria, Benelux, France, Germany, Italy, Portugal, Scandinavia, Spain, Switzerland, U.K.) Central & Eastern Europe (Baltic States, Bulgaria, Croatia, Czech Republic, Greece, Hungary, Kazakhstan, Poland, Romania, Russia, Turkey, Ukraine) Middle East (Bahrain, Iran, Israel, Kuwait, Oman, Qatar, Saudi Arabia, United Arab Emirates) Asia Pacific (Australia, Cambodia, China, Hong Kong, India, Indonesia, Japan, Malaysia, Myanmar, New Zealand, Philippines, Singapore, South Korea, Taiwan, Thailand, Vietnam) Africa (Algeria, Egypt, Ghana, Kenya, Libya, Morocco, Nigeria, South Africa, Sudan, Uganda) |
Base Year | 2020 |
Forecast Period | 2021-2027 |
Historical Data | 2017-2020 |
Quantitative Data | Market Size, Market Share, Market Growth Rates, Units Sold, Average Selling Prices |
Qualitative Data | COVID-19 Impact, Market Growth Trends, Market Limiters, Competitive Analysis & SWOT for Top Competitors, Mergers & Acquisitions, Company Profiles, Product Portfolios |
Data Sources | Primary Interviews with Industry Leaders, Government Physician Data, Regulatory Data, Hospital Private Data, Import & Export Data.
Read more about iData’s 9-Step Research Methodology |
Table of Contents
TABLE of CONTENTS |
List of Figures |
List of Charts |
executive summary |
Global Dental Imaging Device Market Overview |
Competitive Analysis |
Market Trends |
Market Developments |
Procedures Included |
Markets Included |
Regions Included |
Version History |
research methodology |
Step 1: Project Initiation & Team Selection |
Step 2: Prepare Data Systems and Perform Secondary Research |
Step 3: Preparation for Interviews & Questionnaire Design |
Step 4: Performing Primary Research |
Step 5: Research Analysis: Establishing Baseline Estimates |
Step 6: Market Forecast and Analysis |
Step 7: Identify Strategic Opportunities |
Step 8: Final Review and Market Release |
Step 9: Customer Feedback and Market Monitoring |
impact of covid-19 on THE global Dental Imaging Device Market |
2.1 Introduction |
2.2 Regional Profiles |
2.3 Analysis By Market Segment |
2.3.1 Worst Case Scenario |
2.3.2 Base Case Scenario |
2.3.3 Best Case Scenario |
Product Assessment |
3.1 Introduction |
3.2 Product Portfolios |
3.2.1 Intraoral X-Ray Imaging Devices |
3.2.2 Extraoral X-Ray Imaging Devices |
3.2.3 CBCT Imaging Devices |
3.3 Regulatory Issues and Recalls |
3.3.1 KaVo Kerr |
3.4 Clinical Trials |
3.4.1 Intraoral X-Ray Imaging |
3.4.2 CBCT Imaging Devices |
Global Dental Imaging Device Market Overview |
4.1 Introduction |
4.2 Market Overview & Trend Analysis |
4.2.1 By Segment |
4.2.2 By Region |
4.3 Drivers and Limiters |
4.3.1 Market Drivers |
4.3.2 Market Limiters |
4.4 Competitive Market Share Analysis |
4.5 Mergers and Acquisitions |
4.6 Company Profiles |
4.6.1 Acteon Group |
4.6.2 Carestream |
4.6.3 Cefla Group |
4.6.4 Envista Holdings Corporation |
4.6.4.1 KaVo |
4.6.4.2 Kerr |
4.6.5 Dentsply Sirona |
4.6.6 Dürr Dental |
4.6.6.1 Air Techniques |
4.6.7 Midmark |
4.6.8 Planmeca |
4.6.9 Vatech |
4.7 SWOT Analysis |
4.7.1 Acteon Group |
4.7.2 Carestream |
4.7.3 Cefla Group |
4.7.4 Envista Holdings Corporation |
4.7.5 Dentsply Sirona |
4.7.6 Dürr Dental |
4.7.7 Midmark |
4.7.8 Planmeca |
4.7.9 Vatech |
Intraoral X-Ray Imaging equipment Market |
5.1 Executive Summary |
5.1.1 Global Intraoral X-Ray Equipment Market Overview |
5.1.2 Competitive Analysis |
5.1.3 Procedures Included |
5.1.4 Markets Included |
5.1.5 Regions Included |
5.2 Introduction |
5.3 Procedure Numbers |
5.3.1 Total Intraoral X-Ray Procedures |
5.3.2 Analog Film Procedures |
5.3.3 PSP System Procedures |
5.3.4 Digital Sensor Procedures |
5.4 Market Overview |
5.4.1 By Segment |
5.4.2 By Region |
5.5 Market Analysis and Forecast |
5.5.1 Intraoral X-Ray Device Market |
5.5.2 PSP System Market |
5.5.3 Digital Sensor Market |
5.6 Drivers and Limiters |
5.6.1 Market Drivers |
5.6.2 Market Limiters |
5.7 Competitive Market Share Analysis |
Intraoral X-Ray Consumables Market |
6.1 Executive Summary |
6.1.1 Global Intraoral X-Ray Consumables Market Overview |
6.1.2 Competitive Analysis |
6.1.3 Markets Included |
6.1.4 Regions Included |
6.2 Introduction |
6.3 Market Overview |
6.3.1 By Segment |
6.3.2 By Region |
6.4 Market Analysis and Forecast |
6.4.1 Analog Film Market |
6.4.2 PSP Plate Market |
6.5 Drivers and Limiters |
6.5.1 Market Drivers |
6.5.2 Market Limiters |
6.6 Competitive Market Share Analysis |
Extraoral X-Ray Imaging Market |
7.1 Executive Summary |
7.1.1 Global Extraoral X-Ray Imaging Market Overview |
7.1.2 Competitive Analysis |
7.1.3 Procedures Included |
7.1.4 Markets Included |
7.1.5 Regions Included |
7.2 Introduction |
7.3 Procedure Numbers |
7.3.1 Total Extraoral X-Ray Procedures |
7.3.2 Digital Panoramic Procedures |
7.3.3 Cephalometric Procedures |
7.4 Market Overview |
7.4.1 By Segment |
7.4.2 By Region |
7.5 Market Analysis and Forecast |
7.5.1 Total Extraoral X-Ray Imaging Market |
7.5.2 Digital Panoramic System Market |
7.5.3 Pan/Ceph System Market |
7.6 Drivers and Limiters |
7.6.1 Market Drivers |
7.6.2 Market Limiters |
7.7 Competitive Market Share Analysis |
Cone Beam Computed Tomography Market |
8.1 Executive Summary |
8.1.1 Global Cone Beam Computed Tomography Market Overview |
8.1.2 Competitive Analysis |
8.1.3 Markets Included |
8.1.4 Regions Included |
8.2 Introduction |
8.3 Procedure Numbers |
8.3.1 Cone Beam Computed Tomography Procedures |
8.4 Market Overview |
8.4.1 By Segment |
8.4.2 By Region |
8.5 Market Analysis and Forecast |
8.5.1 Total Cone Beam Computed Tomography Market |
8.5.2 Small FOV CBCT Market |
8.5.3 Medium FOV CBCT Market |
8.5.4 Large FOV CBCT Market |
8.6 Drivers and Limiters |
8.6.1 Market Drivers |
8.6.2 Market Limiters |
8.7 Competitive Market Share Analysis |
Abbreviations |
Companies Included:
· Acteon Group | · J. Morita |
· Agfa | · KaVo Kerr |
· Air Techniques | · Kulzer |
· Apixia | · Midmark |
· Belmont | · MyRay |
· Carestream | · Orixscan |
· Cefla Group | · Owandy |
· Chicago X-Ray Systems | · Panoramic |
· Cieos | · Patterson Dental Supply |
· Corix | · Planmeca |
· Cruxell | · PreXion |
· Cyber Medical Imaging | · Ray Medical |
· DentiMax | · Saevo |
· Dentsply Sirona | · Safco |
· Dürr Dental | · Sota Imaging |
· Flow Dental | · Trident |
· Foma | · Vatech |
· Fujifilm | · VideoDental Concepts |
· Genoray | · Villa Systemi Medicalli |
· Henry Schein | · XDR Radiology |
· ImageWorks | · Yoshida |
· Innixim |
List of Charts
Chart 1‑1: Dental Imaging Device Market by Segment, Global, 2021 – 2028 |
Chart 1‑2: Dental Imaging Device Procedures, Global, 2021 |
Chart 2‑1: Multi-Scenario Dental Imaging Device Market Forecast, Global, 2018 – 2028 (US$M) |
Chart 4‑1: Dental Imaging Device Market by Segment, Global, 2018 – 2028 |
Chart 4‑2: Dental Imaging Device Market by Region, Global, 2018 – 2028 |
Chart 4‑3: Leading Competitors, Dental Imaging Device Market, Global, 2021 |
Chart 5‑1: Intraoral X-Ray Equipment Market, Global, 2021 & 2028 |
Chart 5‑2: Intraoral X-Ray Imaging Procedures, Global, 2021 |
Chart 5‑3: Intraoral X-Ray Procedures by Segment, Global, 2018 – 2028 |
Chart 5‑4: Intraoral X-Ray Equipment Market by Segment, Global, 2018 – 2028 |
Chart 5‑5: Intraoral X-Ray Equipment Market by Region, Global, 2018 – 2028 |
Chart 5‑6: Leading Competitors, Intraoral X-Ray Equipment Market, Global, 2021 |
Chart 6‑1: Intraoral X-Ray Consumables Market, Global, 2021 & 2028 |
Chart 6‑2: Intraoral X-Ray Consumables Procedures, Global, 2021 |
Chart 6‑3: Intraoral X-Ray Consumables Device Market by Segment, Global, 2018 – 2028 |
Chart 6‑4: Intraoral X-Ray Consumables Device Market by Region, Global, 2018 – 2028 |
Chart 6‑5: Leading Competitors, Intraoral X-Ray Consumables Market, Global, 2021 |
Chart 7‑1: Extraoral X-Ray Imaging Market, Global, 2021 & 2028 |
Chart 7‑2: Extraoral X-Ray Imaging Procedures, Global, 2021 |
Chart 7‑3: Extraoral X-Ray Procedures by Segment, Global, 2018 – 2028 |
Chart 7‑4: Extraoral X-Ray Imaging Device Market by Segment, Global, 2018 – 2028 |
Chart 7‑5: Extraoral X-Ray Imaging Device Market by Region, Global, 2018 – 2028 |
Chart 7‑6: Leading Competitors, Extraoral X-Ray Imaging Market, Global, 2021 |
Chart 8‑1: Cone Beam Computed Tomography Market, Global, 2018 – 2028 |
Chart 8‑2: Cone Beam Computed Tomography Procedures, Global, 2021 |
Chart 8‑3: Cone Beam Computed Tomography Procedures by Region, Global, 2018 – 2028 |
Chart 8‑4: Cone Beam Computed Tomography Market by Segment, Global, 2018 – 2028 |
Chart 8‑5: Cone Beam Computed Tomography Market by Region, Global, 2018 – 2028 |
Chart 8‑6: Leading Competitors, Cone Beam Computed Tomography Market, Global, 2021 |
List of Figures
Figure 1‑1: Dental Imaging Device Market Share Ranking by Segment, Global, 2021 |
Figure 1‑2: Companies Researched in this Report |
Figure 1‑3: Factors Impacting the Dental Imaging Device Market by Segment, Global |
Figure 1‑4: Recent Events in the Dental Imaging Device Market, Global, 2019 – 2022 (1 of 2) |
Figure 1‑5: Recent Events in the Dental Imaging Device Market, Global, 2019 – 2022 (2 of 2) |
Figure 1‑6: Dental Imaging Device Procedures Covered |
Figure 1‑7: Dental Imaging Device Markets Covered |
Figure 1‑8: Dental Imaging Device Regions Covered, Global (1 of 2) |
Figure 1‑9: Dental Imaging Device Regions Covered, Global (2 of 2) |
Figure 1‑10: Version History |
Figure 2‑1: Dental Imaging Device Market by Segment, Worst Case Scenario, Global, 2018 – 2028 (US$M) |
Figure 2‑2: Dental Imaging Device Market by Segment, Base Case Scenario, Global, 2018 – 2028 (US$M) |
Figure 2‑3: Dental Imaging Device Market by Segment, Best Case Scenario, Global, 2018 – 2028 (US$M) |
Figure 3‑1:Intraoral Imaging Market by Company (1 of 3) |
Figure 3‑2:Intraoral Imaging Market by Company (2 of 3) |
Figure 3‑3:Intraoral Imaging Market by Company (3 of 3) |
Figure 3‑4 Extraoral Imaging Market by Company |
Figure 3‑5 CBCT Imaging Market by Company |
Figure 3‑1: Class 2 Device Recall DEXIS Titanium Intraoral Sensor |
Figure 1‑2: Class 2 Device Recall DIGORA Optime (FLAT PANEL/DIGITAL IMAGER) |
Figure 1‑3: The Use of Intraoral Imaging at Clinical Crown Lengthening Procedures |
Figure 1‑4: A Clinical Trial to Evaluate the Effectiveness and Safety of Dual Energy Cone-Beam Computed Tomography (DE-CBCT) Imaging for Quantitative Measurement of Jaw Bone Density |
Figure 1‑5: Using Superimposition of Intra-Oral Scan and CBCT in Single Implant Restorations in Aesthetic Zone. |
Figure 1‑6: Comparison of Standing Versus Supine 3D Cone Beam Computed Tomography in Patient With Obstructive Sleep Apnea (OSA) |
Figure 1‑7: Evaluation of Crestal Bone Topography of Edentulous Ridges: A Retrospective Study Comparing Ultrasonography to Cone-Beam Computed Tomography (CBCT) |
Figure 1‑8: Cone Beam Computed Tomography Versus Intraoral Digital Radiography in Detection and Measurements of Simulated Periodontal Bone Defects |
Figure 4‑1: Dental Imaging Device Market by Segment, Global, 2018 – 2028 (US$M) |
Figure 4‑2: Dental Imaging Device Market by Region, Global, 2018 – 2028 (US$M) |
Figure 4‑3: Leading Competitors, Dental Imaging Device Market by Segment, Global, 2021 |
Figure 4‑4: SWOT Analysis, Acteon Group |
Figure 4‑5: SWOT Analysis, Carestream |
Figure 4‑6: SWOT Analysis, Cefla Group |
Figure 4‑7: SWOT Analysis, Envista Holdings Corporation |
Figure 4‑8: SWOT Analysis, Dentsply Sirona |
Figure 4‑9: SWOT Analysis, Dürr Dental |
Figure 4‑10: SWOT Analysis, Midmark |
Figure 4‑11: SWOT Analysis, Planmeca |
Figure 4‑12: SWOT Analysis, Vatech |
Figure 5‑1: Intraoral X-Ray Imaging Procedures Covered |
Figure 5‑2: Intraoral X-Ray Equipment Markets Covered |
Figure 5‑3: Intraoral X-Ray Imaging Regions Covered, Global (1 of 2) |
Figure 5‑4: Intraoral X-Ray Imaging Regions Covered, Global (2 of 2) |
Figure 5‑5: Intraoral X-Ray Procedures by Segment, Global, 2018 – 2028 |
Figure 5‑6: Intraoral X-Ray Procedures by Region, Global, 2018 – 2028 |
Figure 5‑7 Analog Film Procedures by Region, Global, 2018 – 2028 |
Figure 5‑8: PSP System Procedures by Region, Global, 2018 – 2028 |
Figure 5‑9: Digital Sensor Procedures by Region, Global, 2018 – 2028 |
Figure 5‑10: Intraoral X-Ray Equipment Market by Segment, Global, 2018 – 2028 (US$M) |
Figure 5‑11: Intraoral X-Ray Equipment Market by Region, Global, 2018 – 2028 (US$M) |
Figure 5‑12: Intraoral X-Ray Device Market, Global, 2018 – 2028 |
Figure 5‑13: Units Sold by Region, Intraoral X-Ray Device Market, Global, 2018 – 2028 |
Figure 5‑14: Average Selling Price by Region, Intraoral X-Ray Device Market, Global, 2018 – 2028 (US$) |
Figure 5‑15: Market Value by Region, Intraoral X-Ray Device Market, Global, 2018 – 2028 (US$M) |
Figure 5‑16: Installed Base by Region, Intraoral X-Ray Device Market, Global, 2018 – 2028 |
Figure 5‑17: PSP System Market, Global, 2018 – 2028 |
Figure 5‑18: Units Sold by Region, PSP System Market, Global, 2018 – 2028 |
Figure 5‑19: Average Selling Price by Region, PSP System Market, Global, 2018 – 2028 (US$) |
Figure 5‑20: Market Value by Region, PSP System Market, Global, 2018 – 2028 (US$M) |
Figure 5‑21: Installed Base by Region, PSP System Market, Global, 2018 – 2028 |
Figure 5‑22: Digital Sensor Market, Global, 2018 – 2028 |
Figure 5‑23: Units Sold by Region, Digital Sensor Market, Global, 2018 – 2028 |
Figure 5‑24: Average Selling Price by Region, Digital Sensor Market, Global, 2018 – 2028 (US$) |
Figure 5‑25: Market Value by Region, Digital Sensor Market, Global, 2018 – 2028 (US$M) |
Figure 5‑26: Installed Base by Region, Digital Sensor Market, Global, 2018 – 2028 |
Figure 5‑27: Leading Competitors, Intraoral X-Ray Equipment Market, Global, 2021 |
Figure 6‑1: Intraoral X-Ray Consumables Markets Covered |
Figure 6‑2: Intraoral X-Ray Consumables Regions Covered, Global (1 of 2) |
Figure 6‑3: Intraoral X-Ray Consumables Regions Covered, Global (2 of 2) |
Figure 6‑4: Intraoral X-Ray Consumables Device Market by Segment, Global, 2018 – 2028 (US$M) |
Figure 6‑5: Intraoral X-Ray Consumables Device Market by Region, Global, 2018 – 2028 (US$M) |
Figure 6‑6: Analog Film Market, Global, 2018 – 2028 |
Figure 6‑7: Units Sold by Region, Analog Film Market, Global, 2018 – 2028 |
Figure 6‑8: Average Selling Price by Region, Analog Film Market, Global, 2018 – 2028 (US$) |
Figure 6‑9: Market Value by Region, Analog Film Market, Global, 2018 – 2028 (US$M) |
Figure 6‑10: PSP Plate Market, Global, 2018 – 2028 |
Figure 6‑11: Units Sold by Region, PSP Plate Market, Global, 2018 – 2028 |
Figure 6‑12: Average Selling Price by Region, PSP Plate Market, Global, 2018 – 2028 (US$) |
Figure 6‑13: Market Value by Region, PSP Plate Market, Global, 2018 – 2028 (US$M) |
Figure 6‑14: Leading Competitors, Intraoral X-Ray Consumables Market, Global, 2021 |
Figure 7‑1: Extraoral X-Ray Imaging Procedures Covered |
Figure 7‑2: Extraoral X-Ray Imaging Markets Covered |
Figure 7‑3: Extraoral X-Ray Imaging Regions Covered, Global (1 of 2) |
Figure 7‑4: Extraoral X-Ray Imaging Regions Covered, Global (2 of 2) |
Figure 7‑5: Extraoral X-Ray Procedures by Segment, Global, 2018 – 2028 |
Figure 7‑6: Extraoral X-Ray Procedures by Region, Global, 2018 – 2028 |
Figure 7‑7: Digital Panoramic Procedures by Region, Global, 2018 – 2028 |
Figure 7‑8: Cephalometric Procedures by Region, Global, 2018 – 2028 |
Figure 7‑9: Extraoral X-Ray Imaging Device Market by Segment, Global, 2018 – 2028 (US$M) |
Figure 7‑10: Extraoral X-Ray Imaging Device Market by Region, Global, 2018 – 2028 (US$M) |
Figure 7‑11: Extraoral X-Ray Imaging Market, Global, 2018 – 2028 |
Figure 7‑12: Units Sold by Region, Extraoral X-Ray Imaging Market, Global, 2018 – 2028 |
Figure 7‑13: Average Selling Price by Region, Extraoral X-Ray Imaging Market, Global, 2018 – 2028 (US$) |
Figure 7‑14: Market Value by Region, Extraoral X-Ray Imaging Market, Global, 2018 – 2028 (US$M) |
Figure 7‑15: Installed Base by Region, Extraoral X-Ray Imaging Market, Global, 2018 – 2028 |
Figure 7‑16: Digital Panoramic System Market, Global, 2018 – 2028 |
Figure 7‑17: Units Sold by Region, Digital Panoramic System Market, Global, 2018 – 2028 |
Figure 7‑18: Average Selling Price by Region, Digital Panoramic System Market, Global, 2018 – 2028 (US$) |
Figure 7‑19: Market Value by Region, Digital Panoramic System Market, Global, 2018 – 2028 (US$M) |
Figure 7‑20: Installed Base by Region, Digital Panoramic System Market, Global, 2018 – 2028 |
Figure 7‑21: Pan/Ceph System Market, Global, 2018 – 2028 |
Figure 7‑22: Units Sold by Region, Pan/Ceph System Market, Global, 2018 – 2028 |
Figure 7‑23: Average Selling Price by Region, Pan/Ceph System Market, Global, 2018 – 2028 (US$) |
Figure 7‑24: Market Value by Region, Pan/Ceph System Market, Global, 2018 – 2028 (US$M) |
Figure 7‑25: Installed Base by Region, Pan/Ceph System Market, Global, 2018 – 2028 |
Figure 7‑26: Leading Competitors, Extraoral X-Ray Imaging Market, Global, 2021 |
Figure 8‑1: Cone Beam Computed Tomography Markets Covered |
Figure 8‑2: Cone Beam Computed Tomography Regions Covered, Global (1 of 2) |
Figure 8‑3: Cone Beam Computed Tomography Regions Covered, Global (2 of 2) |
Figure 8‑4: Cone Beam Computed Tomography Procedures by Region, Global, 2018 – 2028 |
Figure 8‑5: Cone Beam Computed Tomography Market by Segment, Global, 2018 – 2028 (US$M) |
Figure 8‑6: Cone Beam Computed Tomography Market by Region, Global, 2018 – 2028 (US$M) |
Figure 8‑7: Cone Beam Computed Tomography Market, Global, 2018 – 2028 |
Figure 8‑8: Units Sold by Region, Cone Beam Computed Tomography Market, Global, 2018 – 2028 |
Figure 8‑9: Average Selling Price by Region, Cone Beam Computed Tomography Market, Global, 2018 – 2028 (US$) |
Figure 8‑10: Market Value by Region, Cone Beam Computed Tomography Market, Global, 2018 – 2028 (US$M) |
Figure 8‑11: Installed Base by Region, Cone Beam Computed Tomography Market, Global, 2018 – 2028 |
Figure 8‑12: Small FOV CBCT Market, Global, 2018 – 2028 |
Figure 8‑13: Units Sold by Region, Small FOV CBCT Market, Global, 2018 – 2028 |
Figure 8‑14: Average Selling Price by Region, Small FOV CBCT Market, Global, 2018 – 2028 (US$) |
Figure 8‑15: Market Value by Region, Small FOV CBCT Market, Global, 2018 – 2028 (US$M) |
Figure 8‑16: Installed Base by Region, Small FOV CBCT Market, Global, 2018 – 2028 |
Figure 8‑17: Medium FOV CBCT Market, Global, 2018 – 2028 |
Figure 8‑18: Units Sold by Region, Medium FOV CBCT Market, Global, 2018 – 2028 |
Figure 8‑19: Average Selling Price by Region, Medium FOV CBCT Market, Global, 2018 – 2028 (US$) |
Figure 8‑20: Market Value by Region, Medium FOV CBCT Market, Global, 2018 – 2028 (US$M) |
Figure 8‑21: Installed Base by Region, Medium FOV CBCT Market, Global, 2018 – 2028 |
Figure 8‑22: Large FOV CBCT Market, Global, 2018 – 2028 |
Figure 8‑23: Units Sold by Region, Large FOV CBCT Market, Global, 2018 – 2028 |
Figure 8‑24: Average Selling Price by Region, Large FOV CBCT Market, Global, 2018 – 2028 (US$) |
Figure 8‑25: Market Value by Region, Large FOV CBCT Market, Global, 2018 – 2028 (US$M) |
Figure 8‑26: Installed Base by Region, Large FOV CBCT Market, Global, 2018 – 2028 |
Figure 8‑27: Leading Competitors, Cone Beam Computed Tomography Market, Global, 2021 |
iData’s 9-Step Research Methodology
Our reports follow an in-depth 9-step methodology which focuses on the following research systems:- Original primary research that consists of the most up-to-date market data
- Strong foundation of quantitative and qualitative research
- Focused on the needs and strategic challenges of the industry participants
Step 1: Project Initiation & Team Selection During this preliminary investigation, all staff members involved in the industry discusses the topic in detail.
Step 2: Prepare Data Systems and Perform Secondary Research The first task of the research team is to prepare for the data collection process: Filing systems and relational databases are developed as needed.
Step 3: Preparation for Interviews & Questionnaire Design The core of all iData research reports is primary market research. Interviews with industry insiders represent the single most reliable way to obtain accurate, current data about market conditions, trends, threats and opportunities.
Step 4: Performing Primary Research At this stage, interviews are performed using contacts and information acquired in the secondary research phase.
Step 5: Research Analysis: Establishing Baseline Estimates Following the completion of the primary research phase, the collected information must be synthesized into an accurate view of the market status. The most important question is the current state of the market.
Step 6: Market Forecast and Analysis iData Research uses a proprietary method to combine statistical data and opinions of industry experts to forecast future market values.
Step 7: Identify Strategic Opportunities iData analysts identify in broad terms why some companies are gaining or losing share within a given market segment.
Step 8: Final Review and Market Release An integral part of the iData research methodology is a built-in philosophy of quality control and continuing improvement is integral to the iData philosophy.
Step 9: Customer Feedback and Market Monitoring iData philosophy of continuous improvement requires that reports and consulting projects be monitored after release for customer feedback and market accuracy.
Explore Options
Report Summary | FREE |
Dental Imaging Market Size, Share & COVID-19 Impact Analysis | Global | 2022-2028 | MedSuite | Includes: Intraoral X-Ray Imaging, Extraoral X-Ray Imaging, and 1 more
$9,995 – $13,995
iData’s full report suite on the global market for dental imaging devices includes intraoral X-ray imaging, intraoral X-ray imaging consumables, extraoral X-ray imaging and cone beam computed tomography.
- 2022
- 10 Years
- Global
- 07/12/2022
- 253
- MedSuite


