| Figure 1‑1: Dental Imaging Device Market Share Ranking by Segment, Europe, 2024 |
| Figure 1‑2: Companies Researched in This Report |
| Figure 1‑3: Recent Events in the Dental Imaging Device Market, Europe, 2021 – 2024 |
| Figure 1‑4: Factors Impacting the Dental Imaging Device Market by Segment, Europe |
| Figure 1‑5: Dental Imaging Device Procedure Segmentation, Europe |
| Figure 1‑6: Dental Imaging Device Market Segmentation, Europe |
| Figure 1‑7: Key Report Updates |
| Figure 1‑8: Version History |
| Figure 2‑1: Currency Exchange Rate, 2024 |
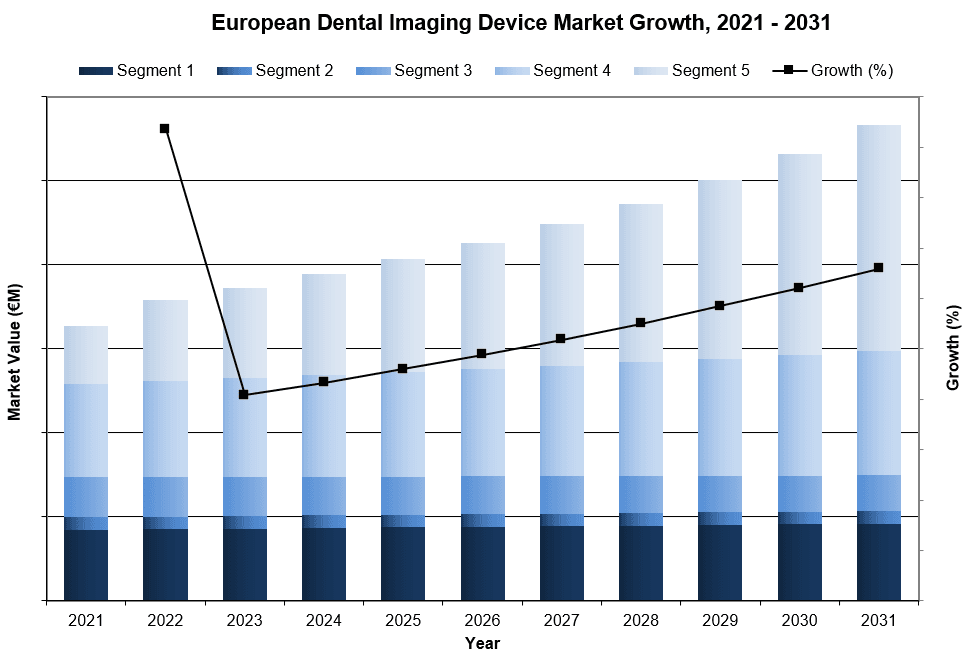
| Figure 2‑2: Dental Imaging Device Market by Segment, Europe, 2021 – 2031 (€M) |
| Figure 2‑3: Dental Imaging Device Market by Segment, Europe, 2021 – 2031 (US$M) |
| Figure 2‑4: Leading Competitors, Dental Imaging Device Market, Europe, 2024 |
| Figure 4‑1: Dental Imaging Device Procedures by Segment, Europe, 2021 – 2031 |
| Figure 4‑2: Dental Imaging Device Procedures by Country, Europe, 2021 – 2031 (1 of 2) |
| Figure 4‑3: Dental Imaging Device Procedures by Country, Europe, 2021 – 2031 (2 of 2) |
| Figure 4‑4: Intraoral X-ray Procedures by Type, Europe, 2021 – 2031 |
| Figure 4‑5: Extraoral X-ray Procedures by Type, Europe, 2021 – 2031 |
| Figure 4‑6: CBCT Procedures, Europe, 2021 – 2031 |
| Figure 5‑1: Intraoral X-ray Imaging Equipment Market by Segment, Europe, 2021 – 2031 (€M) |
| Figure 5‑2: Intraoral X-ray Imaging Equipment Market by Segment, Europe, 2021 – 2031 (US$M) |
| Figure 5‑3: Intraoral X-ray Imaging Equipment Market, Europe, 2021 – 2031 |
| Figure 5‑4: Units Sold by Country, Intraoral X-ray Imaging Equipment Market, Europe, 2021 – 2031 |
| Figure 5‑5: Average Selling Price by Country, Intraoral X-ray Imaging Equipment Market, Europe, 2021 – 2031 (€) |
| Figure 5‑6: Average Selling Price by Country, Intraoral X-ray Imaging Equipment Market, Europe, 2021 – 2031 (US$) |
| Figure 5‑7: Market Value by Country, Intraoral X-ray Imaging Equipment Market, Europe, 2021 – 2031 (€M) |
| Figure 5‑8: Market Value by Country, Intraoral X-ray Imaging Equipment Market, Europe, 2021 – 2031 (US$M) |
| Figure 5‑9: Intraoral X-ray Device Market, Europe, 2021 – 2031 |
| Figure 5‑10: Units Sold by Country, Intraoral X-ray Device Market, Europe, 2021 – 2031 |
| Figure 5‑11: Average Selling Price by Country, Intraoral X-ray Device Market, Europe, 2021 – 2031 (€) |
| Figure 5‑12: Average Selling Price by Country, Intraoral X-ray Device Market, Europe, 2021 – 2031 (US$) |
| Figure 5‑13: Market Value by Country, Intraoral X-ray Device Market, Europe, 2021 – 2031 (€M) |
| Figure 5‑14: Market Value by Country, Intraoral X-ray Device Market, Europe, 2021 – 2031 (US$M) |
| Figure 5‑15: PSP System Market, Europe, 2021 – 2031 |
| Figure 5‑16: Units Sold by Country, PSP System Market, Europe, 2021 – 2031 |
| Figure 5‑17: Average Selling Price by Country, PSP System Market, Europe, 2021 – 2031 (€) |
| Figure 5‑18: Average Selling Price by Country, PSP System Market, Europe, 2021 – 2031 (US$) |
| Figure 5‑19: Market Value by Country, PSP System Market, Europe, 2021 – 2031 (€M) |
| Figure 5‑20: Market Value by Country, PSP System Market, Europe, 2021 – 2031 (US$M) |
| Figure 5‑21: Digital Sensor Market, Europe, 2021 – 2031 |
| Figure 5‑22: Units Sold by Country, Digital Sensor Market, Europe, 2021 – 2031 |
| Figure 5‑23: Average Selling Price by Country, Digital Sensor Market, Europe, 2021 – 2031 (€) |
| Figure 5‑24: Average Selling Price by Country, Digital Sensor Market, Europe, 2021 – 2031 (US$) |
| Figure 5‑25: Market Value by Country, Digital Sensor Market, Europe, 2021 – 2031 (€M) |
| Figure 5‑26: Market Value by Country, Digital Sensor Market, Europe, 2021 – 2031 (US$M) |
| Figure 5‑27: Leading Competitors, Intraoral X-ray Imaging Equipment Market, Europe, 2024 |
| Figure 6‑1: Intraoral X-ray Consumables Market by Segment, Europe, 2021 – 2031 (€M) |
| Figure 6‑2: Intraoral X-ray Consumables Market by Segment, Europe, 2021 – 2031 (US$M) |
| Figure 6‑3: Intraoral X-ray Consumables Market, Europe, 2021 – 2031 |
| Figure 6‑4: Units Sold by Country, Intraoral X-ray Consumables Market, Europe, 2021 – 2031 |
| Figure 6‑5: Average Selling Price by Country, Intraoral X-ray Consumables Market, Europe, 2021 – 2031 (€) |
| Figure 6‑6: Average Selling Price by Country, Intraoral X-ray Consumables Market, Europe, 2021 – 2031 (US$) |
| Figure 6‑7: Market Value by Country, Intraoral X-ray Consumables Market, Europe, 2021 – 2031 (€M) |
| Figure 6‑8: Market Value by Country, Intraoral X-ray Consumables Market, Europe, 2021 – 2031 (US$M) |
| Figure 6‑9: Analog Film Market, Europe, 2021 – 2031 |
| Figure 6‑10: Units Sold by Country, Analog Film Market, Europe, 2021 – 2031 |
| Figure 6‑11: Average Selling Price by Country, Analog Film Market, Europe, 2021 – 2031 (€) |
| Figure 6‑12: Average Selling Price by Country, Analog Film Market, Europe, 2021 – 2031 (US$) |
| Figure 6‑13: Market Value by Country, Analog Film Market, Europe, 2021 – 2031 (€M) |
| Figure 6‑14: Market Value by Country, Analog Film Market, Europe, 2021 – 2031 (US$M) |
| Figure 6‑15: PSP Plate Market, Europe, 2021 – 2031 |
| Figure 6‑16: Units Sold by Country, PSP Plate Market, Europe, 2021 – 2031 |
| Figure 6‑17: Average Selling Price by Country, PSP Plate Market, Europe, 2021 – 2031 (€) |
| Figure 6‑18: Average Selling Price by Country, PSP Plate Market, Europe, 2021 – 2031 (US$) |
| Figure 6‑19: Market Value by Country, PSP Plate Market, Europe, 2021 – 2031 (€M) |
| Figure 6‑20: Market Value by Country, PSP Plate Market, Europe, 2021 – 2031 (US$M) |
| Figure 6‑21: Leading Competitors, Intraoral X-ray Consumable Market, Europe, 2024 |
| Figure 6‑22: Leading Competitors by Country, Intraoral X-ray Consumable Market, Europe, 2024 |
| Figure 7‑1: Extraoral X-ray Imaging Market by Segment, Europe, 2021 – 2031 (€M) |
| Figure 7‑2: Extraoral X-ray Imaging Market by Segment, Europe, 2021 – 2031 (US$M) |
| Figure 7‑3: Extraoral X-ray Imaging Market, Europe, 2021 – 2031 |
| Figure 7‑4: Units Sold by Country, Extraoral X-ray Imaging Market, Europe, 2021 – 2031 |
| Figure 7‑5: Average Selling Price by Country, Extraoral X-ray Imaging Market, Europe, 2021 – 2031 (€) |
| Figure 7‑6: Average Selling Price by Country, Extraoral X-ray Imaging Market, Europe, 2021 – 2031 (US$) |
| Figure 7‑7: Market Value by Country, Extraoral X-ray Imaging Market, Europe, 2021 – 2031 (€M) |
| Figure 7‑8: Market Value by Country, Extraoral X-ray Imaging Market, Europe, 2021 – 2031 (US$M) |
| Figure 7‑9: Digital Panoramic System Market, Europe, 2021 – 2031 |
| Figure 7‑10: Units Sold by Country, Digital Panoramic System Market, Europe, 2021 – 2031 |
| Figure 7‑11: Average Selling Price by Country, Digital Panoramic System Market, Europe, 2021 – 2031 (€) |
| Figure 7‑12: Average Selling Price by Country, Digital Panoramic System Market, Europe, 2021 – 2031 (US$) |
| Figure 7‑13: Market Value by Country, Digital Panoramic System Market, Europe, 2021 – 2031 (€M) |
| Figure 7‑14: Market Value by Country, Digital Panoramic System Market, Europe, 2021 – 2031 (US$M) |
| Figure 7‑15: Pan/Ceph System Market, Europe, 2021 – 2031 |
| Figure 7‑16: Units Sold by Country, Pan/Ceph System Market, Europe, 2021 – 2031 |
| Figure 7‑17: Average Selling Price by Country, Pan/Ceph System Market, Europe, 2021 – 2031 (€) |
| Figure 7‑18: Average Selling Price by Country, Pan/Ceph System Market, Europe, 2021 – 2031 (US$) |
| Figure 7‑19: Market Value by Country, Pan/Ceph System Market, Europe, 2021 – 2031 (€M) |
| Figure 7‑20: Market Value by Country, Pan/Ceph System Market, Europe, 2021 – 2031 (US$M) |
| Figure 7‑21: Leading Competitors by Country, Extraoral X-ray Imaging Market, Europe, 2024 |
| Figure 8‑1: Cone Beam Computed Tomography Market by Segment, Europe, 2021 – 2031 (€M) |
| Figure 8‑2: Cone Beam Computed Tomography Market by Segment, Europe, 2021 – 2031 (US$M) |
| Figure 8‑3: Cone Beam Computed Tomography Market, Europe, 2021 – 2031 |
| Figure 8‑4: Units Sold by Country, Cone Beam Computed Tomography Market, Europe, 2021 – 2031 |
| Figure 8‑5: Average Selling Price by Country, Cone Beam Computed Tomography Market, Europe, 2021 – 2031 (€) |
| Figure 8‑6: Average Selling Price by Country, Cone Beam Computed Tomography Market, Europe, 2021 – 2031 (US$) |
| Figure 8‑7: Market Value by Country, Cone Beam Computed Tomography Market, Europe, 2021 – 2031 (€M) |
| Figure 8‑8: Market Value by Country, Cone Beam Computed Tomography Market, Europe, 2021 – 2031 (US$M) |
| Figure 8‑9: Small-FOV CBCT Market, Europe, 2021 – 2031 |
| Figure 8‑10: Units Sold by Country, Small-FOV CBCT Market, Europe, 2021 – 2031 |
| Figure 8‑11: Average Selling Price by Country, Small-FOV CBCT Market, Europe, 2021 – 2031 (€) |
| Figure 8‑12: Average Selling Price by Country, Small-FOV CBCT Market, Europe, 2021 – 2031 (US$) |
| Figure 8‑13: Market Value by Country, Small-FOV CBCT Market, Europe, 2021 – 2031 (€M) |
| Figure 8‑14: Market Value by Country, Small-FOV CBCT Market, Europe, 2021 – 2031 (US$M) |
| Figure 8‑15: Medium-FOV CBCT Market, Europe, 2021 – 2031 |
| Figure 8‑16: Units Sold by Country, Medium-FOV CBCT Market, Europe, 2021 – 2031 |
| Figure 8‑17: Average Selling Price by Country, Medium-FOV CBCT Market, Europe, 2021 – 2031 (€) |
| Figure 8‑18: Average Selling Price by Country, Medium-FOV CBCT Market, Europe, 2021 – 2031 (US$) |
| Figure 8‑19: Market Value by Country, Medium-FOV CBCT Market, Europe, 2021 – 2031 (€M) |
| Figure 8‑20: Market Value by Country, Medium-FOV CBCT Market, Europe, 2021 – 2031 (US$M) |
| Figure 8‑21: Large-FOV CBCT Market, Europe, 2021 – 2031 |
| Figure 8‑22: Units Sold by Country, Large-FOV CBCT Market, Europe, 2021 – 2031 |
| Figure 8‑23: Average Selling Price by Country, Large-FOV CBCT Market, Europe, 2021 – 2031 (€) |
| Figure 8‑24: Average Selling Price by Country, Large-FOV CBCT Market, Europe, 2021 – 2031 (US$) |
| Figure 8‑25: Market Value by Country, Large-FOV CBCT Market, Europe, 2021 – 2031 (€M) |
| Figure 8‑26: Market Value by Country, Large-FOV CBCT Market, Europe, 2021 – 2031 (US$M) |
| Figure 9‑1: Intraoral Scanner Market, Europe, 2021 – 2031 |
| Figure 9‑2: Units Sold by Country, Intraoral Scanner Market, Europe, 2021 – 2031 |
| Figure 9‑3: Average Selling Price by Country, Intraoral Scanner Market, Europe, 2021 – 2031 (€) |
| Figure 9‑4: Average Selling Price by Country, Intraoral Scanner Market, Europe, 2021 – 2031 (US$) |
| Figure 9‑5: Market Value by Country, Intraoral Scanner Market, Europe, 2021 – 2031 (€M) |
| Figure 9‑6: Market Value by Country, Intraoral Scanner Market, Europe, 2021 – 2031 (US$M) |