| Figure 1‑1: Spinal Implant and VCF Market Share Ranking by Segment, Global, 2024 (1 of 2) |
| Figure 1‑2: Spinal Implant and VCF Market Share Ranking by Segment, Global, 2024 (2 of 2) |
| Figure 1‑3: Companies Researched in This Report (1 of 2) |
| Figure 1‑4: Companies Researched in This Report (2 of 2) |
| Figure 1‑5: Recent Events in the Spinal Implant and VCF Market, Global, 2020 – 2025 |
| Figure 1‑6: Factors Impacting the Spinal Implant and VCF Market by Segment, Global (1 of 2) |
| Figure 1‑7: Factors Impacting the Spinal Implant and VCF Market by Segment, Global (2 of 2) |
| Figure 1‑8: Spinal Implant and VCF Market Procedure Segmentation Procedure Segmentation |
| Figure 1‑9: Spinal Implant and VCF Market Segmentation Market Segmentation |
| Figure 1‑10: Spinal Implant and VCF Market Regions Covered, Global (1 of 2) |
| Figure 1‑11: Spinal Implant and VCF Market Regions Covered, Global (2 of 2) |
| Figure 1‑12: Version History |
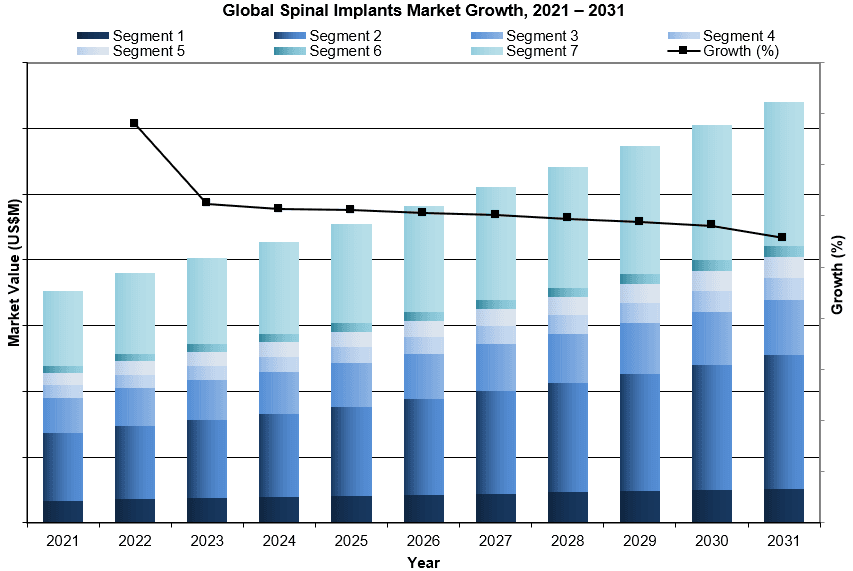
| Figure 4‑1: Spinal Implant and VCF Device Market by Segment, Global, 2021 – 2031 (US$M) |
| Figure 4‑2: Spinal Implant and VCF Device Market by Region, Global, 2021 – 2031 (US$M) |
| Figure 4‑3: Leading Competitors, Spinal Implant and VCF Device Market by Segment, Global, 2024 |
| Figure 5‑1: Cervical Fixation Procedure Segmentation |
| Figure 5‑2: Cervical Fixation Market Segmentation |
| Figure 5‑3: Cervical Fixation Regions Covered, Global (1 of 2) |
| Figure 5‑4: Cervical Fixation Regions Covered, Global (2 of 2) |
| Figure 5‑5: Cervical Fixation Procedures by Segment, Global, 2021 – 2031 |
| Figure 5‑6: Cervical Fixation Procedures by Region, Global, 2021 – 2031 |
| Figure 5‑7: Cervical Fixation Procedures by Country, North America, 2021 – 2031 |
| Figure 5‑8: Cervical Fixation Procedures by Country, Latin America, 2021 – 2031 (1 of 2) |
| Figure 5‑9: Cervical Fixation Procedures by Country, Latin America, 2021 – 2031 (2 of 2) |
| Figure 5‑10: Cervical Fixation Procedures by Country, Western Europe, 2021 – 2031 |
| Figure 5‑11: Cervical Fixation Procedures by Country, Central & Eastern Europe, 2021 – 2031 (1 of 2) |
| Figure 5‑12: Cervical Fixation Procedures by Country, Central & Eastern Europe, 2021 – 2031 (2 of 2) |
| Figure 5‑13: Cervical Fixation Procedures by Country, Middle East, 2021 – 2031 |
| Figure 5‑14: Cervical Fixation Procedures by Country, Asia-Pacific, 2021 – 2031 (1 of 3) |
| Figure 5‑15: Cervical Fixation Procedures by Country, Asia-Pacific, 2021 – 2031 (2 of 3) |
| Figure 5‑16: Cervical Fixation Procedures by Country, Asia-Pacific, 2021 – 2031 (3 of 3) |
| Figure 5‑17: Cervical Fixation Procedures by Country, Africa, 2021 – 2031 |
| Figure 5‑18: Anterior Cervical Fixation Procedures by Region, Global, 2021 – 2031 |
| Figure 5‑19: Anterior Cervical Fixation Procedures by Country, North America, 2021 – 2031 |
| Figure 5‑20: Anterior Cervical Fixation Procedures by Country, Latin America, 2021 – 2031 (1 0f 2) |
| Figure 5‑21: Anterior Cervical Fixation Procedures by Country, Latin America, 2021 – 2031 (2 of 2) |
| Figure 5‑22: Anterior Cervical Fixation Procedures by Country, Western Europe, 2021 – 2031 |
| Figure 5‑23: Anterior Cervical Fixation Procedures by Country, Central & Eastern Europe, 2021 – 2031 (1 of 2) |
| Figure 5‑24: Anterior Cervical Fixation Procedures by Country, Central & Eastern Europe, 2021 – 2031 (2 of 2) |
| Figure 5‑25: Anterior Cervical Fixation Procedures by Country, Middle East, 2021 – 2031 |
| Figure 5‑26: Anterior Cervical Fixation Procedures by Country, Asia-Pacific, 2021 – 2031 (1 of 3) |
| Figure 5‑27: Anterior Cervical Fixation Procedures by Country, Asia-Pacific, 2021 – 2031 (2 of 3) |
| Figure 5‑28: Anterior Cervical Fixation Procedures by Country, Asia-Pacific, 2021 – 2031 (3 of 3) |
| Figure 5‑29: Anterior Cervical Fixation Procedures by Country, Africa, 2021 – 2031 |
| Figure 5‑30: Posterior Cervical Fixation Procedures by Region, Global, 2021 – 2031 |
| Figure 5‑31: Posterior Cervical Fixation Procedures by Country, North America, 2021 – 2031 |
| Figure 5‑32: Posterior Cervical Fixation Procedures by Country, Latin America, 2021 – 2031 (1 0f 2) |
| Figure 5‑33: Posterior Cervical Fixation Procedures by Country, Latin America, 2021 – 2031 (2 of 2) |
| Figure 5‑34: Posterior Cervical Fixation Procedures by Country, Western Europe, 2021 – 2031 |
| Figure 5‑35: Posterior Cervical Fixation Procedures by Country, Central & Eastern Europe, 2021 – 2031 (1 of 2) |
| Figure 5‑36: Posterior Cervical Fixation Procedures by Country, Central & Eastern Europe, 2021 – 2031 (2 of 2) |
| Figure 5‑37: Posterior Cervical Fixation Procedures by Country, Middle East, 2021 – 2031 |
| Figure 5‑38: Posterior Cervical Fixation Procedures by Country, Asia-Pacific, 2021 – 2031 (1 of 3) |
| Figure 5‑39: Posterior Cervical Fixation Procedures by Country, Asia-Pacific, 2021 – 2031 (2 of 3) |
| Figure 5‑40: Posterior Cervical Fixation Procedures by Country, Asia-Pacific, 2021 – 2031 (3 of 3) |
| Figure 5‑41: Posterior Cervical Fixation Procedures by Country, Africa, 2021 – 2031 |
| Figure 5‑42: Cervical Fixation Device Market by Segment, Global, 2021 – 2031 (US$M) |
| Figure 5‑43: Cervical Fixation Device Market by Region, Global, 2021 – 2031 (US$M) |
| Figure 5‑44: Anterior Cervical Fixation Market, Global, 2021 – 2031 |
| Figure 5‑45: Units Sold by Region, Anterior Cervical Fixation Market, Global, 2021 – 2031 |
| Figure 5‑46: Average Selling Price by Region, Anterior Cervical Fixation Market, Global, 2021 – 2031 (US$) |
| Figure 5‑47: Market Value by Region, Anterior Cervical Fixation Market, Global, 2021 – 2031 (US$M) |
| Figure 5‑48: Posterior Cervical Fixation Market, Global, 2021 – 2031 |
| Figure 5‑49: Units Sold by Region, Posterior Cervical Fixation Market, Global, 2021 – 2031 |
| Figure 5‑50: Average Selling Price by Region, Posterior Cervical Fixation Market, Global, 2021 – 2031 (US$) |
| Figure 5‑51: Market Value by Region, Posterior Cervical Fixation Market, Global, 2021 – 2031 (US$M) |
| Figure 5‑52: Leading Competitors, Cervical Fixation Market, Global, 2024 |
| Figure 6‑1: Thoracolumbar Fixation Procedure Segmentation |
| Figure 6‑2: Thoracolumbar Fixation Market Segmentation |
| Figure 6‑3: Thoracolumbar Fixation Regions Covered, Global (1 of 2) |
| Figure 6‑4: Thoracolumbar Fixation Regions Covered, Global (2 of 2) |
| Figure 6‑5: Thoracolumbar Fixation Procedures by Segment, Global, 2021 – 2031 |
| Figure 6‑6: Thoracolumbar Fixation Procedures by Region, Global, 2021 – 2031 |
| Figure 6‑7: Thoracolumbar Fixation Procedures by Country, North America, 2021 – 2031 |
| Figure 6‑8: Thoracolumbar Fixation Procedures by Country, Latin America, 2021 – 2031 (1 of 2) |
| Figure 6‑9: Thoracolumbar Fixation Procedures by Country, Latin America, 2021 – 2031 (2 of 2) |
| Figure 6‑10: Thoracolumbar Fixation Procedures by Country, Western Europe, 2021 – 2031 |
| Figure 6‑11: Thoracolumbar Fixation Procedures by Country, Central & Eastern Europe, 2021 – 2031 (1 of 2) |
| Figure 6‑12: Thoracolumbar Fixation Procedures by Country, Central & Eastern Europe, 2021 – 2031 (2 of 2) |
| Figure 6‑13: Thoracolumbar Fixation Procedures by Country, Middle East, 2021 – 2031 |
| Figure 6‑14: Thoracolumbar Fixation Procedures by Country, Asia-Pacific, 2021 – 2031 (1 of 3) |
| Figure 6‑15: Thoracolumbar Fixation Procedures by Country, Asia-Pacific, 2021 – 2031 (2 of 3) |
| Figure 6‑16: Thoracolumbar Fixation Procedures by Country, Asia-Pacific, 2021 – 2031 (3 of 3) |
| Figure 6‑17: Thoracolumbar Fixation Procedures by Country, Africa, 2021 – 2031 |
| Figure 6‑18: Degenerative Thoracolumbar Fixation Procedures by Region, Global, 2021 – 2031 |
| Figure 6‑19: Degenerative Thoracolumbar Fixation Procedures by Country, North America, 2021 – 2031 |
| Figure 6‑20: Degenerative Thoracolumbar Fixation Procedures by Country, Latin America, 2021 – 2031 (1 of 2) |
| Figure 6‑21: Degenerative Thoracolumbar Fixation Procedures by Country, Latin America, 2021 – 2031 (2 of 2) |
| Figure 6‑22: Degenerative Thoracolumbar Fixation Procedures by Country, Western Europe, 2021 – 2031 |
| Figure 6‑23: Degenerative Thoracolumbar Fixation Procedures by Country, Central & Eastern Europe, 2021 – 2031 (1 of 2) |
| Figure 6‑24: Degenerative Thoracolumbar Fixation Procedures by Country, Central & Eastern Europe, 2021 – 2031 (2 of 2) |
| Figure 6‑25: Degenerative Thoracolumbar Fixation Procedures by Country, Middle East, 2021 – 2031 |
| Figure 6‑26: Degenerative Thoracolumbar Fixation Procedures by Country, Asia-Pacific, 2021 – 2031 (1 of 3) |
| Figure 6‑27: Degenerative Thoracolumbar Fixation Procedures by Country, Asia-Pacific, 2021 – 2031 (2 of 3) |
| Figure 6‑28: Degenerative Thoracolumbar Fixation Procedures by Country, Asia-Pacific, 2021 – 2031 (3 of 3) |
| Figure 6‑29: Degenerative Thoracolumbar Fixation Procedures by Country, Africa, 2021 – 2031 |
| Figure 6‑30: Deformity Correction Thoracolumbar Fixation Procedures by Region, Global, 2021 – 2031 |
| Figure 6‑31: Deformity Correction Thoracolumbar Fixation Procedures by Country, North America, 2021 – 2031 |
| Figure 6‑32: Deformity Correction Thoracolumbar Fixation Procedures by Country, Latin America, 2021 – 2031 (1 of 2) |
| Figure 6‑33: Deformity Correction Thoracolumbar Fixation Procedures by Country, Latin America, 2021 – 2031 (2 of 2) |
| Figure 6‑34: Deformity Correction Thoracolumbar Fixation Procedures by Country, Western Europe, 2021 – 2031 |
| Figure 6‑35: Deformity Correction Thoracolumbar Fixation Procedures by Country, Central & Eastern Europe, 2021 – 2031 (1 of 2) |
| Figure 6‑36: Deformity Correction Thoracolumbar Fixation Procedures by Country, Central & Eastern Europe, 2021 – 2031 (2 of 2) |
| Figure 6‑37: Deformity Correction Thoracolumbar Fixation Procedures by Country, Middle East, 2021 – 2031 |
| Figure 6‑38: Deformity Correction Thoracolumbar Fixation Procedures by Country, Asia-Pacific, 2021 – 2031 (1 of 3) |
| Figure 6‑39: Deformity Correction Thoracolumbar Fixation Procedures by Country, Asia-Pacific, 2021 – 2031 (2 of 3) |
| Figure 6‑40: Deformity Correction Thoracolumbar Fixation Procedures by Country, Asia-Pacific, 2021 – 2031 (3 of 3) |
| Figure 6‑41: Deformity Correction Thoracolumbar Fixation Procedures by Country, Africa, 2021 – 2031 |
| Figure 6‑42: Trauma/Tumor Thoracolumbar Fixation Procedures by Region, Global, 2021 – 2031 |
| Figure 6‑43: Trauma/Tumor Thoracolumbar Fixation Procedures by Country, North America, 2021 – 2031 |
| Figure 6‑44: Trauma/Tumor Thoracolumbar Fixation Procedures by Country, Latin America, 2021 – 2031 (1 of 2) |
| Figure 6‑45: Trauma/Tumor Thoracolumbar Fixation Procedures by Country, Latin America, 2021 – 2031 (2 of 2) |
| Figure 6‑46: Trauma/Tumor Thoracolumbar Fixation Procedures by Country, Western Europe, 2021 – 2031 |
| Figure 6‑47: Trauma/Tumor Thoracolumbar Fixation Procedures by Country, Central & Eastern Europe, 2021 – 2031 (1 of 2) |
| Figure 6‑48: Trauma/Tumor Thoracolumbar Fixation Procedures by Country, Central & Eastern Europe, 2021 – 2031 (2 of 2) |
| Figure 6‑49: Trauma/Tumor Thoracolumbar Fixation Procedures by Country, Middle East, 2021 – 2031 |
| Figure 6‑50: Trauma/Tumor Thoracolumbar Fixation Procedures by Country, Asia-Pacific, 2021 – 2031 (1 of 3) |
| Figure 6‑51: Trauma/Tumor Thoracolumbar Fixation Procedures by Country, Asia-Pacific, 2021 – 2031 (2 of 3) |
| Figure 6‑52: Trauma/Tumor Thoracolumbar Fixation Procedures by Country, Asia-Pacific, 2021 – 2031 (3 of 3) |
| Figure 6‑53: Trauma/Tumor Thoracolumbar Fixation Procedures by Country, Africa, 2021 – 2031 |
| Figure 6‑54: Thoracolumbar Fixation Device Market by Segment, Global, 2021 – 2031 (US$M) |
| Figure 6‑55: Thoracolumbar Fixation Device Market by Region, Global, 2021 – 2031 (US$M) |
| Figure 6‑56: Degenerative Thoracolumbar Fixation Market, Global, 2021 – 2031 |
| Figure 6‑57: Units Sold by Region, Degenerative Thoracolumbar Fixation Market, Global, 2021 – 2031 |
| Figure 6‑58: Average Selling Price by Region, Degenerative Thoracolumbar Fixation Market, Global, 2021 – 2031 (US$) |
| Figure 6‑59: Market Value by Region, Degenerative Thoracolumbar Fixation Market, Global, 2021 – 2031 (US$M) |
| Figure 6‑60: Deformity Correction Thoracolumbar Fixation Market, Global, 2021 – 2031 |
| Figure 6‑61: Units Sold by Region, Deformity Correction Thoracolumbar Fixation Market, Global, 2021 – 2031 |
| Figure 6‑62: Average Selling Price by Region, Deformity Correction Thoracolumbar Fixation Market, Global, 2021 – 2031 (US$) |
| Figure 6‑63: Market Value by Region, Deformity Correction Thoracolumbar Fixation Market, Global, 2021 – 2031 (US$M) |
| Figure 6‑64: Trauma/Tumor Thoracolumbar Fixation Market, Global, 2021 – 2031 |
| Figure 6‑65: Units Sold by Region, Trauma/Tumor Thoracolumbar Fixation Market, Global, 2021 – 2031 |
| Figure 6‑66: Average Selling Price by Region, Trauma/Tumor Thoracolumbar Fixation Market, Global, 2021 – 2031 (US$) |
| Figure 6‑67: Market Value by Region, Trauma/Tumor Thoracolumbar Fixation Market, Global, 2021 – 2031 (US$M) |
| Figure 6‑68: Leading Competitors, Thoracolumbar Fixation Market, Global, 2024 |
| Figure 7‑1: Interbody Fusion Procedure Segmentation |
| Figure 7‑2: Interbody Fusion Market Segmentation |
| Figure 7‑3: Interbody Fusion Regions Covered, Global (1 of 2) |
| Figure 7‑4: Interbody Fusion Regions Covered, Global (2 of 2) |
| Figure 7‑5: Interbody Fusion Procedures by Segment, Global, 2021 – 2031 |
| Figure 7‑6: Interbody Fusion Procedures by Region, Global, 2021 – 2031 |
| Figure 7‑7: Interbody Fusion Procedures by Country, North America, 2021 – 2031 |
| Figure 7‑8: Interbody Fusion Procedures by Country, Latin America, 2021 – 2031 (1 of 2) |
| Figure 7‑9: Interbody Fusion Procedures by Country, Latin America, 2021 – 2031 (2 of 2) |
| Figure 7‑10: Interbody Fusion Procedures by Country, Western Europe, 2021 – 2031 |
| Figure 7‑11: Interbody Fusion Procedures by Country, Central & Eastern Europe, 2021 – 2031 (1 of 2) |
| Figure 7‑12: Interbody Fusion Procedures by Country, Central & Eastern Europe, 2021 – 2031 (2 of 2) |
| Figure 7‑13: Interbody Fusion Procedures by Country, Middle East, 2021 – 2031 |
| Figure 7‑14: Interbody Fusion Procedures by Country, Asia-Pacific, 2021 – 2031 (1 of 3) |
| Figure 7‑15: Deformity Correction Thoracolumbar Fixation Procedures by Country, Asia-Pacific, 2021 – 2031 (2 of 3) |
| Figure 7‑16: Deformity Correction Thoracolumbar Fixation Procedures by Country, Asia-Pacific, 2021 – 2031 (3 of 3) |
| Figure 7‑17: Interbody Fusion Procedures by Country, Africa, 2021 – 2031 |
| Figure 7‑18: ALIF Procedures by Region, Global, 2021 – 2031 |
| Figure 7‑19: ALIF Procedures by Country, North America, 2021 – 2031 |
| Figure 7‑20: ALIF Procedures by Country, Latin America, 2021 – 2031 (1 of 2) |
| Figure 7‑21: Deformity Correction Thoracolumbar Fixation Procedures by Country, Latin America, 2021 – 2031 (2 of 2) |
| Figure 7‑22: ALIF Procedures by Country, Western Europe, 2021 – 2031 |
| Figure 7‑23: ALIF Procedures by Country, Central & Eastern Europe, 2021 – 2031 (1 of 2) |
| Figure 7‑24: ALIF Procedures by Country, Central & Eastern Europe, 2021 – 2031 (2 of 2) |
| Figure 7‑25: ALIF Procedures by Country, Middle East, 2021 – 2031 |
| Figure 7‑26: ALIF Procedures by Country, Asia-Pacific, 2021 – 2031 (1 of 3) |
| Figure 7‑27: ALIF Procedures by Country, Asia-Pacific, 2021 – 2031 (2 of 3) |
| Figure 7‑28: ALIF Procedures by Country, Asia-Pacific, 2021 – 2031 (3 of 3) |
| Figure 7‑29: ALIF Procedures by Country, Africa, 2021 – 2031 |
| Figure 7‑30: PLIF Procedures by Region, Global, 2021 – 2031 |
| Figure 7‑31: PLIF Procedures by Country, North America, 2021 – 2031 |
| Figure 7‑32: PLIF Procedures by Country, Latin America, 2021 – 2031 (1 of 2) |
| Figure 7‑33: PLIF Procedures by Country, Latin America, 2021 – 2031 (2 of 2) |
| Figure 7‑34: PLIF Procedures by Country, Western Europe, 2021 – 2031 |
| Figure 7‑35: PLIF Procedures by Country, Central & Eastern Europe, 2021 – 2031 (1 of 2) |
| Figure 7‑36: PLIF Procedures by Country, Central & Eastern Europe, 2021 – 2031 (2 of 2) |
| Figure 7‑37: PLIF Procedures by Country, Middle East, 2021 – 2031 |
| Figure 7‑38: PLIF Procedures by Country, Asia-Pacific, 2021 – 2031 (1 of 3) |
| Figure 7‑39: PLIF Procedures by Country, Asia-Pacific, 2021 – 2031 (2 of 3) |
| Figure 7‑40: PLIF Procedures by Country, Asia-Pacific, 2021 – 2031 (3 of 3) |
| Figure 7‑41: PLIF Procedures by Country, Africa, 2021 – 2031 |
| Figure 7‑42: TLIF Procedures by Region, Global, 2021 – 2031 |
| Figure 7‑43: TLIF Procedures by Country, North America, 2021 – 2031 |
| Figure 7‑44: TLIF Procedures by Country, Latin America, 2021 – 2031 (1 of 2) |
| Figure 7‑45: TLIF Procedures by Country, Latin America, 2021 – 2031 (2 of 2) |
| Figure 7‑46: TLIF Procedures by Country, Western Europe, 2021 – 2031 |
| Figure 7‑47: TLIF Procedures by Country, Central & Eastern Europe, 2021 – 2031 (1 of 2) |
| Figure 7‑48: TLIF Procedures by Country, Central & Eastern Europe, 2021 – 2031 (2 of 2) |
| Figure 7‑49: TLIF Procedures by Country, Middle East, 2021 – 2031 |
| Figure 7‑50: TLIF Procedures by Country, Asia-Pacific, 2021 – 2031 (1 of 3) |
| Figure 7‑51: TLIF Procedures by Country, Asia-Pacific, 2021 – 2031 (2 of 3) |
| Figure 7‑52: TLIF Procedures by Country, Asia-Pacific, 2021 – 2031 (3 of 3) |
| Figure 7‑53: TLIF Procedures by Country, Africa, 2021 – 2031 |
| Figure 7‑54: CIF Procedures by Region, Global, 2021 – 2031 |
| Figure 7‑55: CIF Procedures by Country, North America, 2021 – 2031 |
| Figure 7‑56: CIF Procedures by Country, Latin America, 2021 – 2031 (1 of 2) |
| Figure 7‑57: CIF Procedures by Country, Latin America, 2021 – 2031 (2 of 2) |
| Figure 7‑58: CIF Procedures by Country, Western Europe, 2021 – 2031 |
| Figure 7‑59: CIF Procedures by Country, Central & Eastern Europe, 2021 – 2031 (1 of 2) |
| Figure 7‑60: CIF Procedures by Country, Central & Eastern Europe, 2021 – 2031 (2 of 2) |
| Figure 7‑61: CIF Procedures by Country, Middle East, 2021 – 2031 |
| Figure 7‑62: CIF Procedures by Country, Asia-Pacific, 2021 – 2031 (1 of 3) |
| Figure 7‑63: CIF Procedures by Country, Asia-Pacific, 2021 – 2031 (2 of 3) |
| Figure 7‑64: CIF Procedures by Country, Asia-Pacific, 2021 – 2031 (3 of 3) |
| Figure 7‑65: CIF Procedures by Country, Africa, 2021 – 2031 |
| Figure 7‑66: VBR/Corpectomy Procedures by Region, Global, 2021 – 2031 |
| Figure 7‑67: VBR/Corpectomy Procedures by Country, North America, 2021 – 2031 |
| Figure 7‑68: VBR/Corpectomy Procedures by Country, Latin America, 2021 – 2031 (1 of 2) |
| Figure 7‑69: VBR/Corpectomy Procedures by Country, Latin America, 2021 – 2031 (2 of 2) |
| Figure 7‑70: VBR/Corpectomy Procedures by Country, Western Europe, 2021 – 2031 |
| Figure 7‑71: VBR/Corpectomy Procedures by Country, Central & Eastern Europe, 2021 – 2031 (1 of 2) |
| Figure 7‑72: VBR/Corpectomy Procedures by Country, Central & Eastern Europe, 2021 – 2031 (2 of 2) |
| Figure 7‑73: VBR/Corpectomy Procedures by Country, Middle East, 2021 – 2031 |
| Figure 7‑74: VBR/Corpectomy Procedures by Country, Asia-Pacific, 2021 – 2031 (1 of 3) |
| Figure 7‑75: VBR/Corpectomy Procedures by Country, Asia-Pacific, 2021 – 2031 (2 of 3) |
| Figure 7‑76: VBR/Corpectomy Procedures by Country, Asia-Pacific, 2021 – 2031 (3 of 3) |
| Figure 7‑77: VBR/Corpectomy Procedures by Country, Africa, 2021 – 2031 |
| Figure 7‑78: Expandable Procedures by Region, Global, 2021 – 2031 |
| Figure 7‑79: Expandable Procedures by Country, North America, 2021 – 2031 |
| Figure 7‑80: Expandable Procedures by Country, Latin America, 2021 – 2031 (1 of 2) |
| Figure 7‑81: Expandable Procedures by Country, Latin America, 2021 – 2031 (2 of 2) |
| Figure 7‑82: Expandable Procedures by Country, Western Europe, 2021 – 2031 |
| Figure 7‑83: Expandable Procedures by Country, Central & Eastern Europe, 2021 – 2031 (1 of 2) |
| Figure 7‑84: Expandable Procedures by Country, Central & Eastern Europe, 2021 – 2031 (2 of 2) |
| Figure 7‑85: Expandable Procedures by Country, Middle East, 2021 – 2031 |
| Figure 7‑86: Expandable Procedures by Country, Asia-Pacific, 2021 – 2031 (1 of 3) |
| Figure 7‑87: Expandable Procedures by Country, Asia-Pacific, 2021 – 2031 (2 of 3) |
| Figure 7‑88: Expandable Procedures by Country, Asia-Pacific, 2021 – 2031 (3 of 3) |
| Figure 7‑89: Expandable Procedures by Country, Africa, 2021 – 2031 |
| Figure 7‑90: Interbody Fusion Device Market by Segment, Global, 2021 – 2031 (US$M) |
| Figure 7‑91: Interbody Fusion Device Market by Region, Global, 2021 – 2031 (US$M) |
| Figure 7‑92: Interbody Fusion Market, Global, 2021 – 2031 |
| Figure 7‑93: Units Sold by Region, Interbody Fusion Market, Global, 2021 – 2031 |
| Figure 7‑94: Average Selling Price by Region, Interbody Fusion Market, Global, 2021 – 2031 (US$) |
| Figure 7‑95: Market Value by Region, Interbody Fusion Market, Global, 2021 – 2031 (US$M) |
| Figure 7‑96: ALIF Market, Global, 2021 – 2031 |
| Figure 7‑97: Units Sold by Region, ALIF Market, Global, 2021 – 2031 |
| Figure 7‑98: Average Selling Price by Region, ALIF Market, Global, 2021 – 2031 (US$) |
| Figure 7‑99: Market Value by Region, ALIF Market, Global, 2021 – 2031 (US$M) |
| Figure 7‑100: PLIF Market, Global, 2021 – 2031 |
| Figure 7‑101: Units Sold by Region, PLIF Market, Global, 2021 – 2031 |
| Figure 7‑102: Average Selling Price by Region, PLIF Market, Global, 2021 – 2031 (US$) |
| Figure 7‑103: Market Value by Region, PLIF Market, Global, 2021 – 2031 (US$M) |
| Figure 7‑104: TLIF Market, Global, 2021 – 2031 |
| Figure 7‑105: Units Sold by Region, TLIF Market, Global, 2021 – 2031 |
| Figure 7‑106: Average Selling Price by Region, TLIF Market, Global, 2021 – 2031 (US$) |
| Figure 7‑107: Market Value by Region, TLIF Market, Global, 2021 – 2031 (US$M) |
| Figure 7‑108: CIF Market, Global, 2021 – 2031 |
| Figure 7‑109: Units Sold by Region, CIF Market, Global, 2021 – 2031 |
| Figure 7‑110: Average Selling Price by Region, CIF Market, Global, 2021 – 2031 (US$) |
| Figure 7‑111: Market Value by Region, CIF Market, Global, 2021 – 2031 (US$M) |
| Figure 7‑112: VBR/Corpectomy Interbody Device Market, Global, 2021 – 2031 |
| Figure 7‑113: Units Sold by Region, VBR/Corpectomy Interbody Device Market, Global, 2021 – 2031 |
| Figure 7‑114: Average Selling Price by Region, VBR/Corpectomy Interbody Device Market, Global, 2021 – 2031 (US$) |
| Figure 7‑115: Market Value by Region, VBR/Corpectomy Interbody Device Market, Global, 2021 – 2031 (US$M) |
| Figure 7‑116: Expandable Interbody Device Market, Global, 2021 – 2031 |
| Figure 7‑117: Units Sold by Region, Expandable Interbody Device Market, Global, 2021 – 2031 |
| Figure 7‑118: Average Selling Price by Region, Expandable Interbody Device Market, Global, 2021 – 2031 (US$) |
| Figure 7‑119: Market Value by Region, Expandable Interbody Device Market, Global, 2021 – 2031 (US$M) |
| Figure 7‑120: Leading Competitors, Interbody Fusion Market, Global, 2024 |
| Figure 8‑1: Motion Preservation Device Procedure Segmentation |
| Figure 8‑2: Motion Preservation Device Market Segmentation |
| Figure 8‑3: Motion Preservation Device Regions Covered, Global (1 of 2) |
| Figure 8‑4: Motion Preservation Device Regions Covered, Global (2 of 2) |
| Figure 8‑5: Motion Preservation Device Procedures by Segment, Global, 2021 – 2031 |
| Figure 8‑6: Motion Preservation Device Procedures by Region, Global, 2021 – 2031 |
| Figure 8‑7: Motion Preservation Device Procedures by Country, North America, 2021 – 2031 |
| Figure 8‑8: Motion Preservation Device Procedures by Country, Latin America, 2021 – 2031 (1 of 2) |
| Figure 8‑9: Motion Preservation Device Procedures by Country, Latin America, 2021 – 2031 (2 of 2) |
| Figure 8‑10: Motion Preservation Device Procedures by Country, Western Europe, 2021 – 2031 |
| Figure 8‑11: Motion Preservation Device Procedures by Country, Central & Eastern Europe, 2021 – 2031 (1 of 2) |
| Figure 8‑12: Motion Preservation Device Procedures by Country, Central & Eastern Europe, 2021 – 2031 (2 of 2) |
| Figure 8‑13: Motion Preservation Device Procedures by Country, Middle East, 2021 – 2031 |
| Figure 8‑14: Motion Preservation Device Procedures by Country, Asia-Pacific, 2021 – 2031 (1 of 3) |
| Figure 8‑15: Motion Preservation Device Procedures by Country, Asia-Pacific, 2021 – 2031 (2 of 3) |
| Figure 8‑16: Motion Preservation Device Procedures by Country, Asia-Pacific, 2021 – 2031 (3 of 3) |
| Figure 8‑17: Motion Preservation Device Procedures by Country, Africa, 2021 – 2031 |
| Figure 8‑18: Artificial Disc Procedures by Region, Global, 2021 – 2031 |
| Figure 8‑19: Artificial Disc Procedures by Country, North America, 2021 – 2031 |
| Figure 8‑20: Artificial Disc Procedures by Country, Latin America, 2021 – 2031 (1 of 2) |
| Figure 8‑21: Artificial Disc Procedures by Country, Latin America, 2021 – 2031 (2 of 2) |
| Figure 8‑22: Artificial Disc Procedures by Country, Western Europe, 2021 – 2031 |
| Figure 8‑23: Artificial Disc Procedures by Country, Central & Eastern Europe, 2021 – 2031 (1 of 2) |
| Figure 8‑24: Artificial Disc Procedures by Country, Central & Eastern Europe, 2021 – 2031 (2 of 2) |
| Figure 8‑25: Artificial Disc Procedures by Country, Middle East, 2021 – 2031 |
| Figure 8‑26: Artificial Disc Procedures by Country, Asia-Pacific, 2021 – 2031 (1 of 3) |
| Figure 8‑27: Artificial Disc Procedures by Country, Asia-Pacific, 2021 – 2031 (2 of 3) |
| Figure 8‑28: Artificial Disc Procedures by Country, Asia-Pacific, 2021 – 2031 (3 of 3) |
| Figure 8‑29: Artificial Disc Procedures by Country, Africa, 2021 – 2031 |
| Figure 8‑30: Dynamic Stabilization Procedures by Region, Global, 2021 – 2031 |
| Figure 8‑31: Dynamic Stabilization Procedures by Country, North America, 2021 – 2031 |
| Figure 8‑32: Dynamic Stabilization Procedures by Country, Latin America, 2021 – 2031 (1 of 2) |
| Figure 8‑33: Dynamic Stabilization Procedures by Country, Latin America, 2021 – 2031 (2 of 2) |
| Figure 8‑34: Dynamic Stabilization Procedures by Country, Western Europe, 2021 – 2031 |
| Figure 8‑35: Dynamic Stabilization Procedures by Country, Central & Eastern Europe, 2021 – 2031 (1 of 2) |
| Figure 8‑36: Dynamic Stabilization Procedures by Country, Central & Eastern Europe, 2021 – 2031 (2 of 2) |
| Figure 8‑37: Dynamic Stabilization Procedures by Country, Middle East, 2021 – 2031 |
| Figure 8‑38: Dynamic Stabilization Procedures by Country, Asia-Pacific, 2021 – 2031 (1 of 3) |
| Figure 8‑39: Dynamic Stabilization Procedures by Country, Asia-Pacific, 2021 – 2031 (2 of 3) |
| Figure 8‑40: Dynamic Stabilization Procedures by Country, Asia-Pacific, 2021 – 2031 (3 of 3) |
| Figure 8‑41: Dynamic Stabilization Procedures by Country, Africa, 2021 – 2031 |
| Figure 8‑42: Motion Preservation Device Market by Segment, Global, 2021 – 2031 (US$M) |
| Figure 8‑43: Motion Preservation Device Market by Region, Global, 2021 – 2031 (US$M) |
| Figure 8‑44: Artificial Disc Market, Global, 2021 – 2031 |
| Figure 8‑45: Units Sold by Region, Artificial Disc Market, Global, 2021 – 2031 |
| Figure 8‑46: Average Selling Price by Region, Artificial Disc Market, Global, 2021 – 2031 (US$) |
| Figure 8‑47: Market Value by Region, Artificial Disc Market, Global, 2021 – 2031 (US$M) |
| Figure 8‑48: Dynamic Stabilization Market, Global, 2021 – 2031 |
| Figure 8‑49: Units Sold by Region, Dynamic Stabilization Market, Global, 2021 – 2031 |
| Figure 8‑50: Average Selling Price by Region, Dynamic Stabilization Market, Global, 2021 – 2031 (US$) |
| Figure 8‑51: Market Value by Region, Dynamic Stabilization Market, Global, 2021 – 2031 (US$M) |
| Figure 8‑52: Leading Competitors, Motion Preservation Device Market, Global, 2024 |
| Figure 9‑1: Vertebral Compression Fracture Procedure Segmentation |
| Figure 9‑2: Vertebral Compression Fracture Market Segmentation |
| Figure 9‑3: Vertebral Compression Fracture Regions Covered, Global (1 of 2) |
| Figure 9‑4: Vertebral Compression Fracture Regions Covered, Global (2 of 2) |
| Figure 9‑5: Vertebral Compression Fracture Procedures by Segment, Global, 2021 – 2031 |
| Figure 9‑6: Vertebral Compression Fracture Procedures by Region, Global, 2021 – 2031 |
| Figure 9‑7: Vertebral Compression Fracture Procedures by Country, North America, 2021 – 2031 |
| Figure 9‑8: Vertebral Compression Fracture Procedures by Country, Latin America, 2021 – 2031 (1 of 2) |
| Figure 9‑9: Vertebral Compression Fracture Procedures by Country, Latin America, 2021 – 2031 (2 of 2) |
| Figure 9‑10: Vertebral Compression Fracture Procedures by Country, Western Europe, 2021 – 2031 |
| Figure 9‑11: Vertebral Compression Fracture Procedures by Country, Central & Eastern Europe, 2021 – 2031 (1 of 2) |
| Figure 9‑12: Vertebral Compression Fracture Procedures by Country, Central & Eastern Europe, 2021 – 2031 (2 of 2) |
| Figure 9‑13: Vertebral Compression Fracture Procedures by Country, Middle East, 2021 – 2031 |
| Figure 9‑14: Vertebral Compression Fracture Procedures by Country, Asia-Pacific, 2021 – 2031 (1 of 3) |
| Figure 9‑15: Deformity Correction Thoracolumbar Fixation Procedures by Country, Asia-Pacific, 2021 – 2031 (2 of 3) |
| Figure 9‑16: Deformity Correction Thoracolumbar Fixation Procedures by Country, Asia-Pacific, 2021 – 2031 (3 of 3) |
| Figure 9‑17: Vertebral Compression Fracture Procedures by Country, Africa, 2021 – 2031 |
| Figure 9‑18: Vertebroplasty Procedures by Region, Global, 2021 – 2031 |
| Figure 9‑19: Vertebroplasty Procedures by Country, North America, 2021-2031 |
| Figure 9‑20: Vertebroplasty Procedures by Country, Latin America, 2021 – 2031 (1 of 2) |
| Figure 9‑21: Vertebroplasty Procedures by Country, Latin America, 2021 – 2031 (2 of 2) |
| Figure 9‑22: Vertebroplasty Procedures by Country, Western Europe, 2021 – 2031 |
| Figure 9‑23: Vertebroplasty Procedures by Country, Central & Eastern Europe, 2021 – 2031 (1 of 2) |
| Figure 9‑24: Vertebroplasty Procedures by Country, Central & Eastern Europe, 2021 – 2031 (2 of 2) |
| Figure 9‑25: Vertebroplasty Procedures by Country, Middle East, 2021 – 2031 |
| Figure 9‑26: Vertebroplasty Procedures by Country, Asia-Pacific, 2021 – 2031 (1 of 3) |
| Figure 9‑27: Vertebroplasty Procedures by Country, Asia-Pacific, 2021 – 2031 (2 of 3) |
| Figure 9‑28: Vertebroplasty Procedures by Country, Asia-Pacific, 2021 – 2031 (3 of 3) |
| Figure 9‑29: Vertebroplasty Procedures by Country, Africa, 2021 – 2031 |
| Figure 9‑30: Percutaneous Vertebral Augmentation Procedures by Region, Global, 2021 – 2031 |
| Figure 9‑31: Percutaneous Vertebral Augmentation Procedures by Country, North America, 2021 – 2031 |
| Figure 9‑32: Percutaneous Vertebral Augmentation Procedures by Country, Latin America, 2021 – 2031 (1 of 2) |
| Figure 9‑33: Percutaneous Vertebral Augmentation Procedures by Country, Latin America, 2021 – 2031 (2 of 2) |
| Figure 9‑34: Percutaneous Vertebral Augmentation Procedures by Country, Western Europe, 2021 – 2031 |
| Figure 9‑35: Percutaneous Vertebral Augmentation Procedures by Country, Central & Eastern Europe, 2021 – 2031 (1 of 2) |
| Figure 9‑36: Percutaneous Vertebral Augmentation Procedures by Country, Central & Eastern Europe, 2021 – 2031 (2 of 2) |
| Figure 9‑37: Percutaneous Vertebral Augmentation Procedures by Country, Middle East, 2021 – 2031 |
| Figure 9‑38: Percutaneous Vertebral Augmentation Procedures by Country, Asia-Pacific, 2021 – 2031 (1 of 3) |
| Figure 9‑39: Percutaneous Vertebral Augmentation Procedures by Country, Asia-Pacific, 2021 – 2031 (2 of 3) |
| Figure 9‑40: Percutaneous Vertebral Augmentation Procedures by Country, Asia-Pacific, 2021 – 2031 (3 of 3) |
| Figure 9‑41: Percutaneous Vertebral Augmentation Procedures by Country, Africa, 2021 – 2031 |
| Figure 9‑42: Vertebral Compression Fracture Device Market by Segment, Global, 2021 – 2031 (US$M) |
| Figure 9‑43: Vertebral Compression Fracture Device Market by Region, Global, 2021 – 2031 (US$M) |
| Figure 9‑44: Vertebral Compression Fracture Market, Global, 2021 – 2031 |
| Figure 9‑45: Units Sold by Region, Vertebral Compression Fracture Market, Global, 2021 – 2031 |
| Figure 9‑46: Average Selling Price by Region, Vertebral Compression Fracture Market, Global, 2021 – 2031 (US$) |
| Figure 9‑47: Market Value by Region, Vertebral Compression Fracture Market, Global, 2021 – 2031 (US$M) |
| Figure 9‑48: Vertebroplasty Market, Global, 2021– 2031 |
| Figure 9‑49: Units Sold by Region, Vertebroplasty Market, Global, 2021 – 2031 |
| Figure 9‑50: Average Selling Price by Region, Vertebroplasty Market, Global, 2021 – 2031 (US$) |
| Figure 9‑51: Market Value by Region, Vertebroplasty Market, Global, 2021 – 2031 (US$M) |
| Figure 9‑52: Percutaneous Vertebral Augmentation Market, Global, 2021 – 2031 |
| Figure 9‑53: Units Sold by Region, Percutaneous Vertebral Augmentation Market, Global, 2021 – 2031 |
| Figure 9‑54: Average Selling Price by Region, Percutaneous Vertebral Augmentation Market, Global, 2021 – 2031 (US$) |
| Figure 9‑55: Market Value by Region, Percutaneous Vertebral Augmentation Market, Global, 2021 – 2031 (US$M) |
| Figure 9‑56: Leading Competitors, Vertebral Compression Fracture Market, Global, 2024 |
| Figure 10‑1: Electrical Stimulation Procedure Segmentation |
| Figure 10‑2: Electrical Stimulation Market Segmentation |
| Figure 10‑3: Electrical Stimulation Regions Covered, Global (1 of 2) |
| Figure 10‑4: Electrical Stimulation Regions Covered, Global (2 of 2) |
| Figure 10‑5: Total Electrical Stimulation Procedures by Segment, Global, 2021 – 2031 |
| Figure 10‑6: Total Electrical Stimulation Procedures by Region, Global, 2021 – 2031 |
| Figure 10‑7: Total Electrical Stimulation Procedures by Country, North America, 2021 – 2031 |
| Figure 10‑8: Total Electrical Stimulation Procedures by Country, Latin America, 2021 – 2031 (1 of 2) |
| Figure 10‑9: Total Electrical Stimulation Procedures by Country, Latin America, 2021 – 2031 (2 of 2) |
| Figure 10‑10: Total Electrical Stimulation Procedures by Country, Western Europe, 2021 – 2031 |
| Figure 10‑11: Total Electrical Stimulation by Country, Central & Eastern Europe, 2021 – 2031 (1 of 2) |
| Figure 10‑12: Total Electrical Stimulation by Country, Central & Eastern Europe, 2021 – 2031 (2 of 2) |
| Figure 10‑13: Total Electrical Stimulation Procedures by Country, Middle East, 2021 – 2031 |
| Figure 10‑14: Total Electrical Stimulation Procedures by Country, Asia-Pacific, 2021 – 2031 (1 of 3) |
| Figure 10‑15: Total Electrical Stimulation Procedures by Country, Asia-Pacific, 2021 – 2031 (2 of 3) |
| Figure 10‑16: Total Electrical Stimulation Procedures by Country, Asia-Pacific, 2021 – 2031 (3 of 3) |
| Figure 10‑17: Total Electrical Stimulation Procedures by Country, Africa, 2021 – 2031 |
| Figure 10‑18: Cervical Electrical Stimulation Procedures by Region, Global, 2021 – 2031 |
| Figure 10‑19: Cervical Electrical Stimulation Procedures by Country, North America, 2021 – 2031 |
| Figure 10‑20: Cervical Electrical Stimulation Procedures by Country, Latin America, 2021 – 2031 (1 of 2) |
| Figure 10‑21: Cervical Electrical Stimulation Procedures by Country, Latin America, 2021 – 2031 (2 of 2) |
| Figure 10‑22: Cervical Electrical Stimulation Procedures by Country, Western Europe, 2021 – 2031 |
| Figure 10‑23: Cervical Electrical Stimulation by Country, Central & Eastern Europe, 2021 – 2031 (1 of 2) |
| Figure 10‑24: Cervical Electrical Stimulation by Country, Central & Eastern Europe, 2021 – 2031 (2 of 2) |
| Figure 10‑25: Cervical Electrical Stimulation Procedures by Country, Middle East, 2021 – 2031 |
| Figure 10‑26: Cervical Electrical Stimulation Procedures by Country, Asia-Pacific, 2021 – 2031 (1 of 3) |
| Figure 10‑27: Cervical Electrical Stimulation Procedures by Country, Asia-Pacific, 2021 – 2031 (2 of 3) |
| Figure 10‑28: Cervical Electrical Stimulation Procedures by Country, Asia-Pacific, 2021 – 2031 (3 of 3) |
| Figure 10‑29: Cervical Electrical Stimulation Procedures by Country, Africa, 2021 – 2031 |
| Figure 10‑30: Lumbar Electrical Stimulation Procedures by Region, Global, 2021 – 2031 |
| Figure 10‑31: Lumbar Electrical Stimulation Procedures by Country, North America, 2021 – 2031 |
| Figure 10‑32: Lumbar Electrical Stimulation Procedures by Country, Latin America, 2021 – 2031 (1 of 2) |
| Figure 10‑33: Lumbar Electrical Stimulation Procedures by Country, Latin America, 2021 – 2031 (2 of 2) |
| Figure 10‑34: Lumbar Electrical Stimulation Procedures by Country, Western Europe, 2021 – 2031 |
| Figure 10‑35: Lumbar Electrical Stimulation by Country, Central & Eastern Europe, 2021 – 2031 (1 of 2) |
| Figure 10‑36: Lumbar Electrical Stimulation by Country, Central & Eastern Europe, 2021 – 2031 (2 of 2) |
| Figure 10‑37: Lumbar Electrical Stimulation Procedures by Country, Middle East, 2021 – 2031 |
| Figure 10‑38: Lumbar Electrical Stimulation Procedures by Country, Asia-Pacific, 2021 – 2031 (1 of 3) |
| Figure 10‑39: Lumbar Electrical Stimulation Procedures by Country, Asia-Pacific, 2021 – 2031 (2 of 3) |
| Figure 10‑40: Lumbar Electrical Stimulation Procedures by Country, Asia-Pacific, 2021 – 2031 (3 of 3) |
| Figure 10‑41: Lumbar Electrical Stimulation Procedures by Country, Africa, 2021 – 2031 |
| Figure 10‑42: Electrical Stimulation Market by Segment, Global, 2021 – 2031 (US$M) |
| Figure 10‑43: Electrical Stimulation Market by Region, Global, 2021 – 2031 (US$M) |
| Figure 10‑44: Electrical Stimulation Market, Global, 2021 – 2031 |
| Figure 10‑45: Units Sold by Region, Electrical Stimulation Market, Global, 2021 – 2031 |
| Figure 10‑46: Average Selling Price by Region, Electrical Stimulation Market, Global, 2021 – 2031 (US$) |
| Figure 10‑47: Market Value by Region, Electrical Stimulation Market, Global, 2021 – 2031 (US$M) |
| Figure 10‑48: Total Cervical Electrical Stimulation Device Market, Global, 2021 – 2031 |
| Figure 10‑49: Units Sold by Region, Cervical Electrical Stimulation Device Market, Global, 2021 – 2031 |
| Figure 10‑50: Average Selling Price by Region, Cervical Electrical Stimulation Device Market, Global, 2021 – 2031 (US$) |
| Figure 10‑51: Market Value by Region, Cervical Electrical Stimulation Device Market, Global, 2021 – 2031 (US$M) |
| Figure 10‑52: Lumbar Electrical Stimulation Device Market, Global, 2021 – 2031 |
| Figure 10‑53: Units Sold by Region, Lumbar Electrical Stimulation Device Market, Global, 2021 – 2031 |
| Figure 10‑54: Average Selling Price by Region, Lumbar Electrical Stimulation Device Market, Global, 2021 – 2031 (US$) |
| Figure 10‑55: Market Value by Region, Lumbar Electrical Stimulation Device Market, Global, 2021 – 2031 (US$M) |
| Figure 10‑56: Leading Competitors, Electrical Stimulation Market, Global, 2024 |
| Figure 11‑1: Spinal Surgery Instrumentation Regions Covered, Global (1 of 2) |
| Figure 11‑2: Spinal Surgery Instrumentation Regions Covered, Global (2 of 2) |
| Figure 11‑3: Spinal Surgery Instrumentation Market, Global, 2021 – 2031 |
| Figure 11‑4: Units Sold by Region, Spinal Surgery Instrumentation Market, Global, 2021 – 2031 |
| Figure 11‑5: Average Selling Price by Region, Spinal Surgery Instrumentation Market, Global, 2021 – 2031 (US$) |
| Figure 11‑6: Market Value by Region, Spinal Surgery Instrumentation Market, Global, 2021 – 2031 (US$M) |
| Figure 11‑7: Leading Competitors, Spinal Surgery Instrumentation Market, Global, 2021 |

 Growth in major segments of this market will be limited by the increasing popularity of minimally invasive surgery, including thoracolumbar fixation, interbody devices and instrumentation. Minimally invasive surgeries can result in faster recovery times, which will consequently decrease procedure costs for hospitals. This will create an increased demand for minimally invasive procedures and, conversely, gain some portion of the growth from traditional open spine procedures. In more developed regions, minimally invasive spinal (MIS) surgery is a more significant limiter to the spinal implant and VCF market, as its market share is growing rapidly. In less developed regions, such as Africa and the Middle East, MIS is still developing