| Figure 1‑1: Video and Integrated Operating Room Equipment Market Share Ranking by Segment, Global, 2025 (1 of 2) |
| Figure 1‑2: Video and Integrated Operating Room Equipment Market Share Ranking by Segment, Global, 2025 (2 of 2) |
| Figure 1‑3: Companies Researched in This Report (1 of 2) |
| Figure 1‑4: Companies Researched in This Report (2 of 2) |
| Figure 1‑5: Factors Impacting the Video and Integrated Operating Room Equipment Market by Segment, Global (1 of 3) |
| Figure 1‑6: Factors Impacting the Video and Integrated Operating Room Equipment Market by Segment, Global (2 of 3) |
| Figure 1‑7: Factors Impacting the Video and Integrated Operating Room Equipment Market by Segment, Global (3 of 3) |
| Figure 1‑8: Recent Events in the Video and Integrated Operating Room Equipment Market, Global, 2022 – 2025 (1 of 5) |
| Figure 1‑9: Recent Events in the Video and Integrated Operating Room Equipment Market, Global, 2022 – 2025 (2 of 5) |
| Figure 1‑10: Recent Events in the Video and Integrated Operating Room Equipment Market, Global, 2022 – 2025 (3 of 5) |
| Figure 1‑11: Recent Events in the Video and Integrated Operating Room Equipment Market, Global, 2022 – 2025 (4 of 5) |
| Figure 1‑12: Recent Events in the Video and Integrated Operating Room Equipment Market, Global, 2022 – 2025 (5 of 5) |
| Figure 1‑13: Video and Integrated Operating Room Equipment Markets Covered (1 of 2) |
| Figure 1‑14: Video and Integrated Operating Room Equipment Markets Covered (2 of 2) |
| Figure 1‑15: Video and Integrated Operating Room Equipment Regions Covered, Global (1 of 2) |
| Figure 1‑16: Video and Integrated Operating Room Equipment Regions Covered, Global (2 of 2) |
| Figure 1‑17: Key Report Updates |
| Figure 1‑18: Version History |
| Figure 3‑1: Video and Integrated Operating Room Equipment Market by Segment, Global, 2022 – 2032 (US$M) (1 of 2) |
| Figure 3‑2: Video and Integrated Operating Room Equipment Market by Segment, Global, 2022 – 2032 (US$M) (2 of 2) |
| Figure 3‑3: Video and Integrated Operating Room Equipment Market by Region, Global, 2022 – 2032 (US$M) |
| Figure 3‑4: Leading Competitors, Video and Integrated Operating Room Equipment Market by Segment, Global, 2025 (1 of 3) |
| Figure 3‑5: Leading Competitors, Video and Integrated Operating Room Equipment Market by Segment, Global, 2025 (2 of 3) |
| Figure 3‑6: Leading Competitors, Video and Integrated Operating Room Equipment Market by Segment, Global, 2025 (3 of 3) |
| Figure 4‑1: Integrated Operating Room Component Regions Covered, Global (1 of 2) |
| Figure 4‑2: Integrated Operating Room Component Regions Covered, Global (2 of 2) |
| Figure 4‑3: Integrated Operating Room Component Market, Global, 2025 – 2032 |
| Figure 4‑4: Units Sold by Region, Integrated Operating Room Component Market, Global, 2025 – 2032 |
| Figure 4‑5: Average Selling Price by Region, Integrated Operating Room Component Market, Global, 2025 – 2032 (US$) |
| Figure 4‑6: Market Value by Region, Integrated Operating Room Component Market, Global, 2025 – 2032 (US$M) |
| Figure 4‑7: Installed Base by Region, Integrated Operating Room Component Market, Global, 2025 – 2032 |
| Figure 4‑8: Leading Competitors, Integrated Operating Room Component Market, Global, 2025 |
| Figure 5‑1: Integrated Operating Room Management Software Regions Covered, Global (1 of 2) |
| Figure 5‑2: Integrated Operating Room Management Software Regions Covered, Global (2 of 2) |
| Figure 5‑3: Integrated Operating Room Management Software Market, Global, 2025 – 2032 |
| Figure 5‑4: Units Sold by Region, Integrated Operating Room Management Software Market, Global, 2025 – 2032 |
| Figure 5‑5: Average Selling Price by Region, Integrated Operating Room Management Software Market, Global, 2025 – 2032 (US$) |
| Figure 5‑6: Market Value by Region, Integrated Operating Room Management Software Market, Global, 2025 – 2032 (US$M) |
| Figure 5‑7: Installed Base by Region, Integrated Operating Room Management Software Market, Global, 2025 – 2032 |
| Figure 5‑8: Leading Competitors, Integrated Operating Room Management Software Market, Global, 2025 |
| Figure 6‑1: Teleconference and Connectivity Regions Covered, Global (1 of 2) |
| Figure 6‑2: Teleconference and Connectivity Regions Covered, Global (2 of 2) |
| Figure 6‑3: Teleconference and Connectivity Market, Global, 2022 – 2032 |
| Figure 6‑4: Units Sold by Region, Teleconference and Connectivity Market, Global, 2022 – 2032 |
| Figure 6‑5: Average Selling Price by Region, Teleconference and Connectivity Market, Global, 2022 – 2032 (US$) |
| Figure 6‑6: Market Value by Region, Teleconference and Connectivity Market, Global, 2022 – 2032 (US$M) |
| Figure 6‑7: Leading Competitors, Teleconference and Connectivity Market, Global, 2025 |
| Figure 7‑1: Hybrid Operating Room Regions Covered, Global (1 of 2) |
| Figure 7‑2: Hybrid Operating Room Regions Covered, Global (2 of 2) |
| Figure 7‑3: Hybrid Operating Room Market, Global, 2025 – 2032 |
| Figure 7‑4: Units Sold by Region, Hybrid Operating Room Market, Global, 2025 – 2032 |
| Figure 7‑5: Average Selling Price by Region, Hybrid Operating Room Market, Global, 2025 – 2032 (US$) |
| Figure 7‑6: Market Value by Region, Hybrid Operating Room Market, Global, 2025 – 2032 (US$M) |
| Figure 7‑7: Installed Base by Region, Hybrid Operating Room Market, Global, 2025 – 2032 |
| Figure 7‑8: Leading Competitors, Hybrid Operating Room Market, Global, 2025 |
| Figure 8‑1: Hybrid Operating Room Imaging System Market Covered |
| Figure 8‑2: Hybrid Operating Room Imaging System Regions Covered, Global (1 of 2) |
| Figure 8‑3: Hybrid Operating Room Imaging System Regions Covered, Global (2 of 2) |
| Figure 8‑4: Hybrid Operating Room Imaging System Market, Global, 2025 – 2032 |
| Figure 8‑5: Hybrid Operating Room Imaging System Market, Global, 2025 – 2032 |
| Figure 8‑6: Hybrid Operating Room Imaging System Market, Global, 2025 – 2032 |
| Figure 8‑7: Units Sold by Region, Hybrid Operating Room Imaging System Market, Global, 2025 – 2032 |
| Figure 8‑8: Average Selling Price by Region, Hybrid Operating Room Imaging System Market, Global, 2025 – 2032 (US$) |
| Figure 8‑9: Market Value by Region, Hybrid Operating Room Imaging System Market, Global, 2025 – 2032 (US$M) |
| Figure 8‑10: MRI Hybrid Operating Room Imaging System Market, Global, 2025 – 2032 |
| Figure 8‑11: Units Sold by Region, MRI Hybrid Operating Room Imaging System Market, Global, 2025 – 2032 |
| Figure 8‑12: Average Selling Price by Region, MRI Hybrid Operating Room Imaging System Market, Global, 2025 – 2032 (US$) |
| Figure 8‑13: Market Value by Region, MRI Hybrid Operating Room Imaging System Market, Global, 2025 – 2032 (US$M) |
| Figure 8‑14: CT Hybrid Operating Room Imaging System Market, Global, 2025 – 2032 |
| Figure 8‑15: Units Sold by Region, CT Hybrid Operating Room Imaging System Market, Global, 2025 – 2032 |
| Figure 8‑16: Average Selling Price by Region, CT Hybrid Operating Room Imaging System Market, Global, 2025 – 2032 (US$) |
| Figure 8‑17: Market Value by Region, CT Hybrid Operating Room Imaging System Market, Global, 2025 – 2032 (US$M) |
| Figure 8‑18: Angiography Hybrid Operating Room Imaging System Market, Global, 2025 – 2032 |
| Figure 8‑19: Units Sold by Region, Angiography Hybrid Operating Room Imaging System Market, Global, 2025 – 2032 |
| Figure 8‑20: Average Selling Price by Region, Angiography Hybrid Operating Room Imaging System Market, Global, 2025 – 2032 (US$) |
| Figure 8‑21: Market Value by Region, Angiography Hybrid Operating Room Imaging System Market, Global, 2025 – 2032 (US$M) |
| Figure 8‑22: Leading Competitors, Hybrid Operating Room Imaging System Market, Global, 2025 |
| Figure 9‑1: Surgical Display and PACS Monitor Markets Covered |
| Figure 9‑2: Surgical Display and PACS Monitor Regions Covered, Global (1 of 2) |
| Figure 9‑3: Surgical Display and PACS Monitor Regions Covered, Global (2 of 2) |
| Figure 9‑4: Surgical Display and PACS Monitor Market by Segment, Global, 2025 – 2032 (US$M) |
| Figure 9‑5: Surgical Display and PACS Monitor Market by Region, Global, 2025 – 2032 (US$M) |
| Figure 9‑6: Surgical Display and PACS Monitor Market, Global, 2025 – 2032 |
| Figure 9‑7: Units Sold by Region, Surgical Display and PACS Monitor Market, Global, 2025 – 2032 |
| Figure 9‑8: Average Selling Price by Region, Surgical Display and PACS Monitor Market, Global, 2025 – 2032 (US$) |
| Figure 9‑9: Market Value by Region, Surgical Display and PACS Monitor Market, Global, 2025 – 2032 (US$M) |
| Figure 9‑10: Surgical Display Market by Segment, Global, 2025 – 2032 (US$M) |
| Figure 9‑11: Total Surgical Display Market, Global, 2025 – 2032 |
| Figure 9‑12: Units Sold by Region, Surgical Display Market, Global, 2025 – 2032 |
| Figure 9‑13: Average Selling Price by Region, Surgical Display Market, Global, 2025 – 2032 (US$) |
| Figure 9‑14: Market Value by Region, Surgical Display Market, Global, 2025 – 2032 (US$M) |
| Figure 9‑15: HD Surgical Display Market by Segment, Global, 2025 – 2032 (US$M) |
| Figure 9‑16: HD Surgical Display Market, Global, 2025 – 2032 |
| Figure 9‑17: Units Sold by Region, HD Surgical Display Market, Global, 2025 – 2032 |
| Figure 9‑18: Average Selling Price by Region, HD Surgical Display Market, Global, 2025 – 2032 (US$) |
| Figure 9‑19: Market Value by Region, HD Surgical Display Market, Global, 2025 – 2032 (US$M) |
| Figure 9‑20: HD Surgical Display ≤27” Market, Global, 2025 – 2032 |
| Figure 9‑21: Units Sold by Region, HD Surgical Display ≤27” Market, Global, 2025 – 2032 |
| Figure 9‑22: Average Selling Price by Region, HD Surgical Display ≤27” Market, Global, 2025 – 2032 (US$) |
| Figure 9‑23: Market Value by Region, HD Surgical Display ≤27” Market, Global, 2025 – 2032 (US$M) |
| Figure 9‑24: HD Surgical Display ≥31” Market, Global, 2025 – 2032 |
| Figure 9‑25: Units Sold by Region, HD Surgical Display ≥31” Market, Global, 2025 – 2032 |
| Figure 9‑26: Average Selling Price by Region, HD Surgical Display ≥31” Market, Global, 2025 – 2032 (US$) |
| Figure 9‑27: Market Value by Region, HD Surgical Display ≥31” Market, Global, 2025 – 2032 (US$M) |
| Figure 9‑28: 4K Surgical Display Market by Segment, Global, 2025 – 2032 (US$M) |
| Figure 9‑29: 4K Surgical Display Market, Global, 2025 – 2032 |
| Figure 9‑30: Units Sold by Region, 4K Surgical Display Market, Global, 2025 – 2032 |
| Figure 9‑31: Average Selling Price by Region, 4K Surgical Display Market, Global, 2025 – 2032 (US$) |
| Figure 9‑32: Market Value by Region, 4K Surgical Display Market, Global, 2025 – 2032 (US$M) |
| Figure 9‑33: 4K Surgical Display ≤32” Market, Global, 2025 – 2032 |
| Figure 9‑34: Units Sold by Region, 4K Surgical Display ≤32” Market, Global, 2025 – 2032 |
| Figure 9‑35: Average Selling Price by Region, 4K Surgical Display ≤32” Market, Global, 2025 – 2032 (US$) |
| Figure 9‑36: Market Value by Region, 4K Surgical Display ≤32” Market, Global, 2025 – 2032 (US$M) |
| Figure 9‑37: 4K Surgical Display ≥55” Market, Global, 2025 – 2032 |
| Figure 9‑38: Units Sold by Region, 4K Surgical Display ≥55” Market, Global, 2025 – 2032 |
| Figure 9‑39: Average Selling Price by Region, 4K Surgical Display ≥55” Market, Global, 2025 – 2032 (US$) |
| Figure 9‑40: Market Value by Region, 4K Surgical Display ≥55” Market, Global, 2025 – 2032 (US$M) |
| Figure 9‑41: 8-Megapixel UHD Display Market, Global, 2025 – 2032 |
| Figure 9‑42: Units Sold by Region, 8-Megapixel UHD Display Market, Global, 2025 – 2032 |
| Figure 9‑43: Average Selling Price by Region, 8-Megapixel UHD Display Market, Global, 2025 – 2032 (US$) |
| Figure 9‑44: Market Value by Region, 8-Megapixel UHD Display Market, Global, 2025 – 2032 (US$M) |
| Figure 9‑45: PACS Monitor Market, Global, 2025 – 2032 |
| Figure 9‑46: Units Sold by Region, PACS Monitor Market, Global, 2025 – 2032 |
| Figure 9‑47: Average Selling Price by Region, PACS Monitor Market, Global, 2025 – 2032 (US$) |
| Figure 9‑48: Market Value by Region, PACS Monitor Market, Global, 2025 – 2032 (US$M) |
| Figure 9‑49: Leading Competitors, Surgical Display and PACS Monitor Market, Global, 2025 |
| Figure 10‑1: Surgical Lighting Regions Covered, Global (1 of 2) |
| Figure 10‑2: Surgical Lighting Regions Covered, Global (2 of 2) |
| Figure 10‑3: Surgical Lighting Market, Global, 2025 – 2032 |
| Figure 10‑4: Units Sold by Region, Surgical Lighting Market, Global, 2025 – 2032 |
| Figure 10‑5: Average Selling Price by Region, Surgical Lighting Market, Global, 2025 – 2032 (US$) |
| Figure 10‑6: Market Value by Region, Surgical Lighting Market, Global, 2025 – 2032 (US$M) |
| Figure 10‑7: Installed Base by Region, Surgical Lighting Market, Global, 2025 – 2032 (US$) |
| Figure 10‑8: Leading Competitors, Surgical Lighting Market, Global, 2025 |
| Figure 11‑1: Surgical Boom Markets Covered |
| Figure 11‑2: Surgical Boom Regions Covered, Global (1 of 2) |
| Figure 11‑3: Surgical Boom Regions Covered, Global (2 of 2) |
| Figure 11‑4: Surgical Boom Market by Segment, Global, 2025 – 2032 (US$M) |
| Figure 11‑5: Surgical Boom Market by Region, Global, 2025 – 2032 (US$M) |
| Figure 11‑6: Surgical Boom Market, Global, 2025 – 2032 |
| Figure 11‑7: Units Sold by Region, Surgical Boom Market, Global, 2025 – 2032 |
| Figure 11‑8: Average Selling Price by Region, Surgical Boom Market, Global, 2025 – 2032 (US$) |
| Figure 11‑9: Market Value by Region, Surgical Boom Market, Global, 2025 – 2032 (US$M) |
| Figure 11‑10: Equipment Boom Market, Global, 2025 – 2032 |
| Figure 11‑11: Units Sold by Region, Equipment Boom Market, Global, 2025 – 2032 |
| Figure 11‑12: Average Selling Price by Region, Equipment Boom Market, Global, 2025 – 2032 (US$) |
| Figure 11‑13: Market Value by Region, Equipment Boom Market, Global, 2025 – 2032 (US$M) |
| Figure 11‑14: Anesthesia/Nursing Boom Market, Global, 2025 – 2032 |
| Figure 11‑15: Units Sold by Region, Anesthesia/Nursing Boom Market, Global, 2025 – 2032 |
| Figure 11‑16: Average Selling Price by Region, Anesthesia/Nursing Boom Market, Global, 2025 – 2032 (US$) |
| Figure 11‑17: Market Value by Region, Anesthesia/Nursing Boom Market, Global, 2025 – 2032 (US$M) |
| Figure 11‑18: Utility Boom Market, Global, 2025 – 2032 |
| Figure 11‑19: Units Sold by Region, Utility Boom Market, Global, 2025 – 2032 |
| Figure 11‑20: Average Selling Price by Region, Utility Boom Market, Global, 2025 – 2032 (US$) |
| Figure 11‑21: Market Value by Region, Utility Boom Market, Global, 2025 – 2032 (US$M) |
| Figure 11‑22: Leading Competitors, Surgical Boom Market, Global, 2023 |
| Figure 12‑1: Surgical Table Markets Covered |
| Figure 12‑2: Surgical Table Regions Covered, Global (1 of 2) |
| Figure 12‑3: Surgical Table Regions Covered, Global (2 of 2) |
| Figure 12‑4: Surgical Table Market by Segment, Global, 2025 – 2032 (US$M) |
| Figure 12‑5: Surgical Table Market by Region, Global, 2025 – 2032 (US$M) |
| Figure 12‑6: Surgical Table Market, Global, 2025 – 2032 |
| Figure 12‑7: Units Sold by Region, Surgical Table Market, Global, 2025 – 2032 |
| Figure 12‑8: Average Selling Price by Region, Surgical Table Market, Global, 2025 – 2032 (US$) |
| Figure 12‑9: Market Value by Region, Surgical Table Market, Global, 2025 – 2032 (US$M) |
| Figure 12‑10: General Surgical Table Market, Global, 2025 – 2032 |
| Figure 12‑11: Units Sold by Region, General Surgical Table Market, Global, 2025 – 2032 |
| Figure 12‑12: Average Selling Price by Region, General Surgical Table Market, Global, 2025 – 2032 (US$) |
| Figure 12‑13: Market Value by Region, General Surgical Table Market, Global, 2025 – 2032 (US$M) |
| Figure 12‑14: Specialty Surgical Table Market by Segment, Global, 2025 – 2032 (US$M) |
| Figure 12‑15: Specialty Surgical Table Market, Global, 2025 – 2032 |
| Figure 12‑16: Units Sold by Region, Specialty Surgical Table Market, Global, 2025 – 2032 |
| Figure 12‑17: Average Selling Price by Region, Specialty Surgical Table Market, Global, 2025 – 2032 (US$) |
| Figure 12‑18: Market Value by Region, Specialty Surgical Table Market, Global, 2025 – 2032 (US$M) |
| Figure 12‑19: Orthopedic Surgical Table Market, Global, 2025 – 2032 |
| Figure 12‑20: Units Sold by Region, Orthopedic Surgical Table Market, Global, 2025 – 2032 |
| Figure 12‑21: Average Selling Price by Region, Orthopedic Surgical Table Market, Global, 2025 – 2032 (US$) |
| Figure 12‑22: Market Value by Region, Orthopedic Surgical Table Market, Global, 2025 – 2032 (US$M) |
| Figure 12‑23: Spine Surgical Table Market, Global, 2025 – 2032 |
| Figure 12‑24: Units Sold by Region, Spine Surgical Table Market, Global, 2025 – 2032 |
| Figure 12‑25: Average Selling Price by Region, Spine Surgical Table Market, Global, 2025 – 2032 (US$) |
| Figure 12‑26: Market Value by Region, Spine Surgical Table Market, Global, 2025 – 2032 (US$M) |
| Figure 12‑27: Neurosurgical Table Market, Global, 2025 – 2032 |
| Figure 12‑28: Units Sold by Region, Neurosurgical Table Market, Global, 2025 – 2032 |
| Figure 12‑29: Average Selling Price by Region, Neurosurgical Table Market, Global, 2025 – 2032 (US$) |
| Figure 12‑30: Market Value by Region, Neurosurgical Table Market, Global, 2025 – 2032 (US$M) |
| Figure 12‑31: Image-Guided Surgical Table Market, Global, 2025 – 2032 |
| Figure 12‑32: Units Sold by Region, Image-Guided Surgical Table Market, Global, 2025 – 2032 |
| Figure 12‑33: Average Selling Price by Region, Image-Guided Surgical Table Market, Global, 2025 – 2032 (US$) |
| Figure 12‑34: Market Value by Region, Image-Guided Surgical Table Market, Global, 2025 – 2032 (US$M) |
| Figure 12‑35: Leading Competitors, Surgical Table Market, Global, 2023 |
| Figure 13‑1: Surgical Headlight Regions Covered, Global (1 of 2) |
| Figure 13‑2: Surgical Headlight Regions Covered, Global (2 of 2) |
| Figure 13‑3: Surgical Headlight Market, Global, 2025 – 2032 |
| Figure 13‑4: Units Sold by Region, Surgical Headlight Market, Global, 2025 – 2032 |
| Figure 13‑5: Average Selling Price by Region, Surgical Headlight Market, Global, 2025 – 2032 (US$) |
| Figure 13‑6: Market Value by Region, Surgical Headlight Market, Global, 2025 – 2032 (US$M) |
| Figure 13‑7: Installed Base by Region, Surgical Headlight Table Market, Global, 2025 – 2032 |
| Figure 13‑8: Leading Competitors, Surgical Headlight Market, Global, 2023 |
| Figure 14‑1: Surgical Camera System Markets Covered |
| Figure 14‑2: Surgical Camera System Regions Covered, Global (1 of 2) |
| Figure 14‑3: Surgical Camera System Regions Covered, Global (2 of 2) |
| Figure 14‑4: Surgical Camera System Market by Segment, Global, 2025 – 2032 (US$M) |
| Figure 14‑5: Surgical Camera System Market by Region, Global, 2025 – 2032 (US$M) |
| Figure 14‑6: Surgical Camera System Market, Global, 2025 – 2032 |
| Figure 14‑7: Units Sold by Region, Surgical Camera System Market, Global, 2025 – 2032 |
| Figure 14‑8: Average Selling Price by Region, Surgical Camera System Market, Global, 2025 – 2032 (US$) |
| Figure 14‑9: Market Value by Region, Surgical Camera System Market, Global, 2025 – 2032 (US$M) |
| Figure 14‑10: HD Surgical Camera System Market by Segment, Global, 2025 – 2032 (US$M) |
| Figure 14‑11: Total HD Surgical Camera System Market, Global, 2025 – 2032 |
| Figure 14‑12: Units Sold by Region, HD Surgical Camera System Market, Global, 2025 – 2032 |
| Figure 14‑13: Average Selling Price by Region, HD Surgical Camera System Market, Global, 2025 – 2032 (US$) |
| Figure 14‑14: Market Value by Region, HD Surgical Camera System Market, Global, 2025 – 2032 (US$M) |
| Figure 14‑15: HD Surgical Camera Head Market, Global, 2025 – 2032 |
| Figure 14‑16: Units Sold by Region, HD Surgical Camera Head Market, Global, 2025 – 2032 |
| Figure 14‑17: Average Selling Price by Region, HD Surgical Camera Head Market, Global, 2025 – 2032 (US$) |
| Figure 14‑18: Market Value by Region, HD Surgical Camera Head Market, Global, 2025 – 2032 (US$M) |
| Figure 14‑19: HD Camera Control Unit Market, Global, 2025 – 2032 |
| Figure 14‑20: Units Sold by Region, HD Camera Control Unit Market, Global, 2025 – 2032 |
| Figure 14‑21: Average Selling Price by Region, HD Camera Control Unit Market, Global, 2025 – 2032 (US$) |
| Figure 14‑22: Market Value by Region, HD Camera Control Unit Market, Global, 2025 – 2032 (US$M) |
| Figure 14‑23: 4K Surgical Camera System Market by Segment, Global, 2025 – 2032 (US$M) |
| Figure 14‑24: Total 4K Surgical Camera System Market, Global, 2025 – 2032 |
| Figure 14‑25: Units Sold by Region, 4K Surgical Camera System Market, Global, 2025 – 2032 |
| Figure 14‑26: Average Selling Price by Region, 4K Surgical Camera System Market, Global, 2025 – 2032 (US$) |
| Figure 14‑27: Market Value by Region, 4K Surgical Camera System Market, Global, 2025 – 2032 (US$M) |
| Figure 14‑28: 4K Surgical Camera Head Market, Global, 2025 – 2032 |
| Figure 14‑29: Units Sold by Region, 4K Surgical Camera Head Market, Global, 2025 – 2032 |
| Figure 14‑30: Average Selling Price by Region, 4K Surgical Camera Head Market, Global, 2025 – 2032 (US$) |
| Figure 14‑31: Market Value by Region, 4K Surgical Camera Head Market, Global, 2025 – 2032 (US$M) |
| Figure 14‑32: 4K Camera Control Unit Market, Global, 2025 – 2032 |
| Figure 14‑33: Units Sold by Region, 4K Camera Control Unit Market, Global, 2025 – 2032 |
| Figure 14‑34: Average Selling Price by Region, 4K Camera Control Unit Market, Global, 2025 – 2032 (US$) |
| Figure 14‑35: Market Value by Region, 4K Camera Control Unit Market, Global, 2025 – 2032 (US$M) |
| Figure 14‑36: 3D Surgical Camera System Market by Segment, Global, 2025 – 2032 (US$M) |
| Figure 14‑37: Total 3D Surgical Camera System Market, Global, 2025 – 2032 |
| Figure 14‑38: Units Sold by Region, 3D Surgical Camera System Market, Global, 2025 – 2032 |
| Figure 14‑39: Average Selling Price by Region, 3D Surgical Camera System Market, Global, 2025 – 2032 (US$) |
| Figure 14‑40: Market Value by Region, 3D Surgical Camera System Market, Global, 2025 – 2032 (US$M) |
| Figure 14‑41: 3D Surgical Camera Head Market, Global, 2025 – 2032 |
| Figure 14‑42: Units Sold by Region, 3D Surgical Camera Head Market, Global, 2025 – 2032 |
| Figure 14‑43: Average Selling Price by Region, 3D Surgical Camera Head Market, Global, 2025 – 2032 (US$) |
| Figure 14‑44: Market Value by Region, 3D Surgical Camera Head Market, Global, 2025 – 2032 (US$M) |
| Figure 14‑45: 3D Camera Control Unit Market, Global, 2025 – 2032 |
| Figure 14‑46: Units Sold by Region, 3D Camera Control Unit Market, Global, 2025 – 2032 |
| Figure 14‑47: Average Selling Price by Region, 3D Camera Control Unit Market, Global, 2025 – 2032 (US$) |
| Figure 14‑48: Market Value by Region, 3D Camera Control Unit Market, Global, 2025 – 2032 (US$M) |
| Figure 14‑49: Leading Competitors, Surgical Camera System Market By Region, Global, 2025 |
| Figure 14‑50: Leading Competitors, Surgical Camera System Market By Segment, Global, 2025 |
| Figure 14‑51: Leading Competitors, HD Surgical Camera System Market, Global, 2025 |
| Figure 14‑52: Leading Competitors, 4K Surgical Camera System Market, Global, 2025 |
| Figure 14‑53: Leading Competitors, 3D Surgical Camera System Market, Global, 2025 |
| Figure 15‑1: Image Management Device Regions Covered, Global (1 of 2) |
| Figure 15‑2: Image Management Device Regions Covered, Global (2 of 2) |
| Figure 15‑3: Image Management Device Market, Global, 2022 – 2032 |
| Figure 15‑4: Units Sold by Region, Image Management Device Market, Global, 2022 – 2032 |
| Figure 15‑5: Average Selling Price by Region, Image Management Device Market, Global, 2022 – 2032 (US$) |
| Figure 15‑6: Market Value by Region, Image Management Device Market, Global, 2022 – 2032 (US$M) |
| Figure 15‑7: Installed Base by Region, Image Management Device Market, Global, 2022 – 2032 |
| Figure 15‑8: Leading Competitors, Image Management Device Market, Global, 2025 |
| Figure 16‑1: Surgical Light Source Regions Covered, Global (1 of 2) |
| Figure 16‑2: Surgical Light Source Regions Covered, Global (2 of 2) |
| Figure 16‑3: Surgical Light Source Market, Global, 2022 – 2032 |
| Figure 16‑4: Units Sold by Region, Surgical Light Source Market, Global, 2022 – 2032 |
| Figure 16‑5: Average Selling Price by Region, Surgical Light Source Market, Global, 2022 – 2032 (US$) |
| Figure 16‑6: Market Value by Region, Surgical Light Source Market, Global, 2022 – 2032 (US$M) |
| Figure 16‑7: Installed Base by Region, Surgical Light Source Market, Global, 2022 – 2032 |
| Figure 16‑8: Leading Competitors, Surgical Light Source Market, Global, 2025 |
| Figure 17‑1: Combination Console Markets Covered |
| Figure 17‑2: Combination Console Regions Covered, Global (1 of 2) |
| Figure 17‑3: Combination Console Regions Covered, Global (2 of 2) |
| Figure 17‑4: Combination Console Market by Segment, Global, 2025 – 2032 (US$M) |
| Figure 17‑5: Combination Console System Market by Region, Global, 2025 – 2032 (US$M) |
| Figure 17‑6: Combination Console Market, Global, 2022 – 2032 |
| Figure 17‑7: Units Sold by Region, Combination Console Market, Global, 2022 – 2032 |
| Figure 17‑8: Average Selling Price by Region, Combination Console Market, Global, 2022 – 2032 (US$) |
| Figure 17‑9: Market Value by Region, Combination Console Market, Global, 2022 – 2032 (US$M) |
| Figure 17‑10: HD Combination Console Market, Global, 2022 – 2032 |
| Figure 17‑11: Units Sold by Region, Combination Console Market, Global, 2022 – 2032 |
| Figure 17‑12: Average Selling Price by Region, Combination Console Market, Global, 2022 – 2032 (US$) |
| Figure 17‑13: Market Value by Region, Combination Console Market, Global, 2022 – 2032 (US$M) |
| Figure 17‑14: Combination Console Market, Global, 2022 – 2032 |
| Figure 17‑15: Units Sold by Region, Combination Console Market, Global, 2022 – 2032 |
| Figure 17‑16: Average Selling Price by Region, Combination Console Market, Global, 2022 – 2032 (US$) |
| Figure 17‑17: Market Value by Region, Combination Console Market, Global, 2022 – 2032 (US$M) |
| Figure 17‑18: Leading Competitors, Combination Console Market, Global, 2025 |

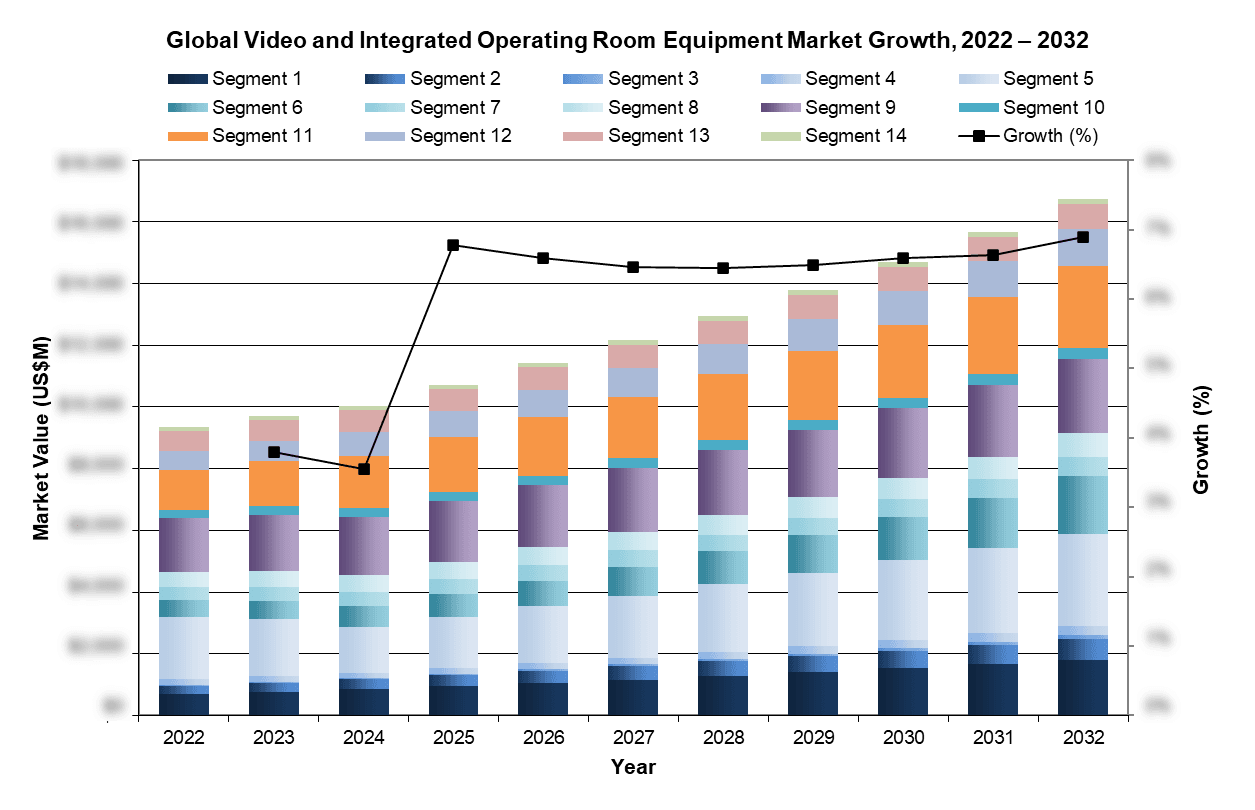 The increasing volume of complex and image guided procedures, combined with the adoption of surgical robotics, is driving demand for integrated ORs, as these interventions require a highly coordinated and digitally connected operating environment. Such procedures depend on seamless integration among surgical tables, advanced imaging platforms, displays, cameras and centralized control systems to support precise positioning, real-time visualization and efficient workflow management. Integrated ORs provide the infrastructure, spatial organization and interoperability needed to support complex, image-guided surgeries, enabling hospitals and ambulatory surgery centers (ASCs) to improve procedural efficiency, enhance clinical outcomes and expand advanced surgical programs. The video and integrated operating room equipment market is projected to grow at a high single-digit rate over the forecast period, with North America representing the largest and fastest-growing region, followed by Western Europe and Asia-Pacific.