| Figure 1‑1: Cardiac Rhythm Management, Electrophysiology & Cardiac Ablation Market Share Ranking by Segment, Global, 2025 (1 of 2) |
| Figure 1‑2: Cardiac Rhythm Management, Electrophysiology & Cardiac Ablation Market Share Ranking by Segment, Global, 2025 (2 of 2) |
| Figure 1‑3: Companies Researched in This Report |
| Figure 1‑4: Factors Impacting the Cardiac Rhythm Management, Electrophysiology & Cardiac Ablation Market by Segment, Global (1 of 2) |
| Figure 1‑5: Factors Impacting the Cardiac Rhythm Management, Electrophysiology & Cardiac Ablation Market by Segment, Global (2 of 2) |
| Figure 1‑6: Recent Events in the Cardiac Rhythm Management, Electrophysiology & Cardiac Ablation Market, Global, 2019 – 2025 (1 of 3) |
| Figure 1‑7: Recent Events in the Cardiac Rhythm Management, Electrophysiology & Cardiac Ablation Market, Global, 2019 – 2025 (2 of 3) |
| Figure 1‑8: Recent Events in the Cardiac Rhythm Management, Electrophysiology & Cardiac Ablation Market, Global, 2019 – 2025 (3 of 3) |
| Figure 1‑9: Cardiac Rhythm Management, Electrophysiology & Cardiac Ablation Procedure Segmentation |
| Figure 1‑10: Cardiac Rhythm Management, Electrophysiology & Cardiac Ablation Procedure Segmentation |
| Figure 1‑11: Cardiac Rhythm Management, Electrophysiology & Cardiac Ablation Markets Covered (1 of 2) |
| Figure 1‑12: Cardiac Rhythm Management, Electrophysiology & Cardiac Ablation Markets Covered (2 of 2) |
| Figure 1‑13: Cardiac Rhythm Management, Electrophysiology & Cardiac Ablation Regions Covered, Global (1 of 2) |
| Figure 1‑14: Cardiac Rhythm Management, Electrophysiology & Cardiac Ablation Regions Covered, Global (2 of 2) |
| Figure 1‑15: Key Analysis Updates |
| Figure 1‑16: Key Report Updates |
| Figure 1‑17: Version History |
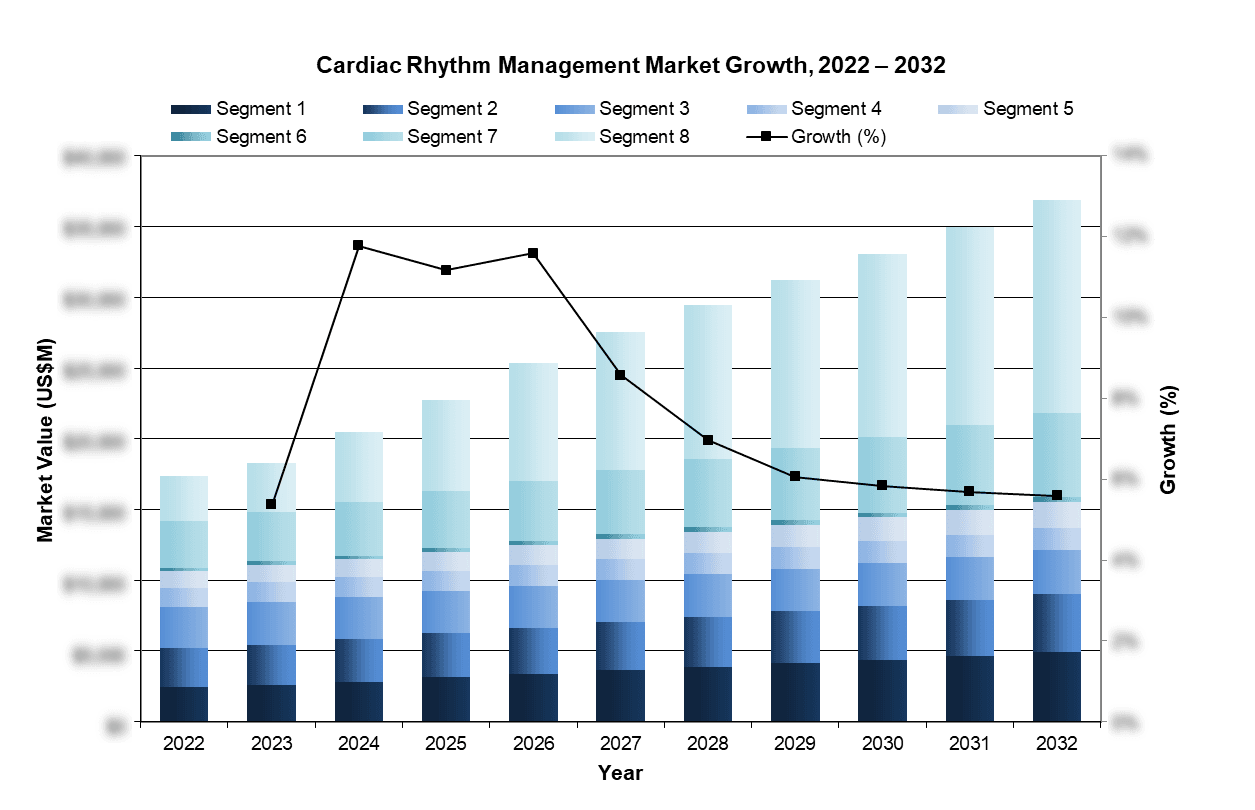
| Figure 3‑1: Cardiac Rhythm Management, Electrophysiology & Cardiac Ablation Market by Segment, Global, 2022 – 2032 (US$M) |
| Figure 3‑2: Cardiac Rhythm Management, Electrophysiology & Cardiac Ablation Market by Region, Global, 2022 – 2032 (US$M) |
| Figure 3‑3: Leading Competitors, Cardiac Rhythm Management, Electrophysiology & Cardiac Ablation Market by Segment, Global, 2025 (1 of 2) |
| Figure 3‑4: Leading Competitors, Cardiac Rhythm Management, Electrophysiology & Cardiac Ablation Market by Segment, Global, 2025 (2 of 2) |
| Figure 4‑1: Pacemaker Procedures Covered |
| Figure 4‑2: Pacemaker Markets Covered |
| Figure 4‑3: Pacemaker Regions Covered, Global (1 of 2) |
| Figure 4‑4: Pacemaker Regions Covered, Global (2 of 2) |
| Figure 4‑5: Pacemaker Placement Procedures by Segment, Global, 2022 – 2032 |
| Figure 4‑6: Pacemaker Placement Procedures by Region, Global, 2022 – 2032 |
| Figure 4‑7: Pacemaker Placement Procedures by Country, North America, 2022 – 2032 |
| Figure 4‑8: Pacemaker Placement Procedures by Country, Latin America, 2022 – 2032 (1 of 2) |
| Figure 4‑9: Pacemaker Placement Procedures by Country, Latin America, 2022 – 2032 (2 of 2) |
| Figure 4‑10: Pacemaker Placement Procedures by Country, Western Europe, 2022 – 2032 |
| Figure 4‑11: Pacemaker Placement Procedures by Country, Central & Eastern Europe, 2022 – 2032 (1 of 2) |
| Figure 4‑12: Pacemaker Placement Procedures by Country, Central & Eastern Europe, 2022 – 2032 (2 of 2) |
| Figure 4‑13: Pacemaker Placement Procedures by Country, Middle East, 2022 – 2032 |
| Figure 4‑14: Pacemaker Placement Procedures by Country, Asia-Pacific, 2022 – 2032 (1 of 3) |
| Figure 4‑15: Pacemaker Placement Procedures by Country, Asia-Pacific, 2022 – 2032 (2 of 3) |
| Figure 4‑16: Pacemaker Placement Procedures by Country, Asia-Pacific, 2022 – 2032 (3 of 3) |
| Figure 4‑17: Pacemaker Placement Procedures by Country, Africa, 2022 – 2032 |
| Figure 4‑18: Initial Placement Pacemaker Procedures by Region, Global, 2022 – 2032 |
| Figure 4‑19: Initial Placement Pacemaker Procedures by Country, North America, 2022 – 2032 |
| Figure 4‑20: Initial Placement Pacemaker Procedures by Country, Latin America, 2022 – 2032 (1 of 2) |
| Figure 4‑21: Initial Placement Pacemaker Procedures by Country, Latin America, 2022 – 2032 (2 of 2) |
| Figure 4‑22: Initial Placement Pacemaker Procedures by Country, Western Europe, 2022 – 2032 |
| Figure 4‑23: Initial Placement Pacemaker Procedures by Country, Central & Eastern Europe, 2022 – 2032 (1 of 2) |
| Figure 4‑24: Initial Placement Pacemaker Procedures by Country, Central & Eastern Europe, 2022 – 2032 (2 of 2) |
| Figure 4‑25: Initial Placement Pacemaker Procedures by Country, Middle East, 2022 – 2032 |
| Figure 4‑26: Initial Placement Pacemaker Procedures by Country, Asia-Pacific, 2022 – 2032 (1 of 3) |
| Figure 4‑27: Initial Placement Pacemaker Procedures by Country, Asia-Pacific, 2022 – 2032 (2 of 3) |
| Figure 4‑28: Initial Placement Pacemaker Procedures by Country, Asia-Pacific, 2022 – 2032 (3 of 3) |
| Figure 4‑29: Initial Placement Pacemaker Procedures by Country, Africa, 2022 – 2032 |
| Figure 4‑30: Replacement Pacemaker Procedures by Region, Global, 2022 – 2032 |
| Figure 4‑31: Replacement Pacemaker Procedures by Country, North America, 2022 – 2032 |
| Figure 4‑32: Replacement Pacemaker Procedures by Country, Latin America, 2022 – 2032 (1 of 2) |
| Figure 4‑33: Replacement Pacemaker Procedures by Country, Latin America, 2022 – 2032 (2 of 2) |
| Figure 4‑34: Replacement Pacemaker Procedures by Country, Western Europe, 2022 – 2032 |
| Figure 4‑35: Replacement Pacemaker Procedures by Country, Central & Eastern Europe, 2022 – 2032 (1 of 2) |
| Figure 4‑36: Replacement Pacemaker Procedures by Country, Central & Eastern Europe, 2022 – 2032 (2 of 2) |
| Figure 4‑37: Replacement Pacemaker Procedures by Country, Middle East, 2022 – 2032 |
| Figure 4‑38: Replacement Pacemaker Procedures by Country, Asia-Pacific, 2022 – 2032 (1 of 3) |
| Figure 4‑39: Replacement Pacemaker Procedures by Country, Asia-Pacific, 2022 – 2032 (2 of 3) |
| Figure 4‑40: Replacement Pacemaker Procedures by Country, Asia-Pacific, 2022 – 2032 (2 of 3) |
| Figure 4‑41: Replacement Pacemaker Procedures by Country, Africa, 2022 – 2032 |
| Figure 4‑42: Leadless Pacemaker Procedures by Region, Global, 2022 – 2032 |
| Figure 4‑43: Leadless Pacemaker Procedures by Country, North America, 2022 – 2032 |
| Figure 4‑44: Leadless Pacemaker Procedures by Country, Latin America, 2022 – 2032 (1 of 2) |
| Figure 4‑45: Leadless Pacemaker Procedures by Country, Latin America, 2022 – 2032 (2 of 2) |
| Figure 4‑46: Leadless Pacemaker Procedures by Country, Western Europe, 2022 – 2032 |
| Figure 4‑47: Leadless Pacemaker Procedures by Country, Central & Eastern Europe, 2022 – 2032 (1 of 2) |
| Figure 4‑48: Leadless Pacemaker Procedures by Country, Central & Eastern Europe, 2022 – 2032 (2 of 2) |
| Figure 4‑49: Leadless Pacemaker Procedures by Country, Middle East, 2022 – 2032 |
| Figure 4‑50: Leadless Pacemaker Procedures by Country, Asia-Pacific, 2022 – 2032 (1 of 3) |
| Figure 4‑51: Leadless Pacemaker Procedures by Country, Asia-Pacific, 2022 – 2032 (2 of 3) |
| Figure 4‑52: Leadless Pacemaker Procedures by Country, Asia-Pacific, 2022 – 2032 (2 of 3) |
| Figure 4‑53: Leadless Pacemaker Procedures by Country, Africa, 2022 – 2032 |
| Figure 4‑54: Pacemaker Market by Segment, Global, 2022 – 2032 (US$M) |
| Figure 4‑55: Pacemaker Market by Region, Global, 2022 – 2032 (US$M) |
| Figure 4‑56: Pacemaker Market, Global, 2022 – 2032 |
| Figure 4‑57: Units Sold by Region, Pacemaker Market, Global, 2022 – 2032 |
| Figure 4‑58: Average Selling Price by Region, Pacemaker Market, Global, 2022 – 2032 (US$) |
| Figure 4‑59: Market Value by Region, Pacemaker Market, Global, 2022 – 2032 (US$M) |
| Figure 4‑60: Standard Single-Chamber Pacemaker Market by Segment, Global, 2022 – 2032 (US$M) |
| Figure 4‑61: Standard Single-Chamber Pacemaker Market, Global, 2022 – 2032 |
| Figure 4‑62: Units Sold by Region, Standard Single-Chamber Pacemaker Market, Global, 2022 – 2032 |
| Figure 4‑63: Average Selling Price by Region, Standard Single-Chamber Pacemaker Market, Global, 2022 – 2032 (US$) |
| Figure 4‑64: Market Value by Region, Standard Single-Chamber Pacemaker Market, Global, 2022 – 2032 (US$M) |
| Figure 4‑65: Initial Placement Standard Single-Chamber Pacemaker Market, Global, 2022 – 2032 |
| Figure 4‑66: Units Sold by Region, Initial Placement Standard Single-Chamber Pacemaker Market, Global, 2022 – 2032 |
| Figure 4‑67: Average Selling Price by Region, Initial Placement Standard Single-Chamber Pacemaker Market, Global, 2022 – 2032 (US$) |
| Figure 4‑68: Market Value by Region, Initial Placement Standard Single-Chamber Pacemaker Market, Global, 2022 – 2032 (US$M) |
| Figure 4‑69: Replacement Standard Single-Chamber Pacemaker Market, Global, 2022 – 2032 |
| Figure 4‑70: Units Sold by Region, Replacement Standard Single-Chamber Pacemaker Market, Global, 2022 – 2032 |
| Figure 4‑71: Average Selling Price by Region, Replacement Standard Single-Chamber Pacemaker Market, Global, 2022 – 2032 (US$) |
| Figure 4‑72: Market Value by Region, Replacement Standard Single-Chamber Pacemaker Market, Global, 2022 – 2032 (US$M) |
| Figure 4‑73: Leadless Single-Chamber Pacemaker Market, Global, 2022 – 2032 |
| Figure 4‑74: Units Sold by Region, Leadless Single-Chamber Pacemaker Market, Global, 2022 – 2032 |
| Figure 4‑75: Average Selling Price by Region, Leadless Single-Chamber Pacemaker Market, Global, 2022 – 2032 (US$) |
| Figure 4‑76: Market Value by Region, Leadless Single-Chamber Pacemaker Market, Global, 2022 – 2032 (US$M) |
| Figure 4‑77: Standard Dual-Chamber Pacemaker Market, Global, 2022 – 2032 |
| Figure 4‑78: Units Sold by Region, Standard Dual-Chamber Pacemaker Market, Global, 2022 – 2032 |
| Figure 4‑79: Average Selling Price by Region, Standard Dual-Chamber Pacemaker Market, Global, 2022 – 2032 (US$) |
| Figure 4‑80: Market Value by Region, Standard Dual-Chamber Pacemaker Market, Global, 2022 – 2032 (US$M) |
| Figure 4‑81: Initial Placement Standard Dual-Chamber Pacemaker Market, Global, 2022 – 2032 |
| Figure 4‑82: Units Sold by Region, Initial Placement Standard Dual-Chamber Pacemaker Market, Global, 2022 – 2032 |
| Figure 4‑83: Average Selling Price by Region, Initial Placement Standard Dual-Chamber Pacemaker Market, Global, 2022 – 2032 (US$) |
| Figure 4‑84: Market Value by Region, Initial Placement Standard Dual-Chamber Pacemaker Market, Global, 2022 – 2032 (US$M) |
| Figure 4‑85: Replacement Standard Dual-Chamber Pacemaker Market, Global, 2022 – 2032 |
| Figure 4‑86: Units Sold by Region, Replacement Standard Dual-Chamber Pacemaker Market, Global, 2022 – 2032 |
| Figure 4‑87: Average Selling Price by Region, Replacement Standard Dual-Chamber Pacemaker Market, Global, 2022 – 2032 (US$) |
| Figure 4‑88: Market Value by Region, Replacement Standard Dual-Chamber Pacemaker Market, Global, 2022 – 2032 (US$M) |
| Figure 4‑89: Leadless Dual-Chamber Pacemaker Market, Global, 2022 – 2032 |
| Figure 4‑90: Units Sold by Region, Leadless Dual-Chamber Pacemaker Market, Global, 2022 – 2032 |
| Figure 4‑91: Average Selling Price by Region, Leadless Dual-Chamber Pacemaker Market, Global, 2022 – 2032 (US$) |
| Figure 4‑92: Market Value by Region, Leadless Dual-Chamber Pacemaker Market, Global, 2022 – 2032 (US$M) |
| Figure 4‑93: Leading Competitors, Pacemaker Market, Global, 2025 |
| Figure 4‑94: Leading Competitors by Region, Single-Chamber Pacemaker Market, Global, 2025 |
| Figure 4‑95: Leading Competitors by Region, Dual-Chamber Pacemaker Market, Global, 2025 |
| Figure 5‑1: Implantable Cardioverter Defibrillator Procedure Segmentation |
| Figure 5‑2: Implantable Cardioverter Defibrillator Market Segmentation |
| Figure 5‑3: Implantable Cardioverter Defibrillator Regions Covered, Global (1 of 2) |
| Figure 5‑4: Inferior Vena Cava Filter Regions Covered, Global (2 of 2) |
| Figure 5‑5: ICD Placement Procedures by Segment, Global, 2022 – 2032 |
| Figure 5‑6: ICD Placement Procedures by Region, Global, 2022 – 2032 |
| Figure 5‑7: ICD Placement Procedures by Country, North America, 2022 – 2032 |
| Figure 5‑8: ICD Placement Procedures by Country, Latin America, 2022 – 2032 (1 of 2) |
| Figure 5‑9: ICD Placement Procedures by Country, Latin America, 2022 – 2032 (2 of 2) |
| Figure 5‑10: ICD Placement Procedures by Country, Western Europe, 2022 – 2032 |
| Figure 5‑11: ICD Placement Procedures by Country, Central & Eastern Europe, 2022 – 2032 (1 of 2) |
| Figure 5‑12: ICD Placement Procedures by Country, Central & Eastern Europe, 2022 – 2032 (2 of 2) |
| Figure 5‑13: ICD Placement Procedures by Country, Middle East, 2022 – 2032 |
| Figure 5‑14: ICD Placement Procedures by Country, Asia-Pacific, 2022 – 2032 (1 of 3) |
| Figure 5‑15: ICD Placement Procedures by Country, Asia-Pacific, 2022 – 2032 (2 of 3) |
| Figure 5‑16: ICD Placement Procedures by Country, Asia-Pacific, 2022 – 2032 (3 of 3) |
| Figure 5‑17: ICD Placement Procedures by Country, Africa, 2022 – 2032 |
| Figure 5‑18: Initial Placement ICD Procedures by Region, Global, 2022 – 2032 |
| Figure 5‑19: Initial Placement ICD Procedures by Country, North America, 2022 – 2032 |
| Figure 5‑20: Initial Placement ICD Procedures by Country, Latin America, 2022 – 2032 (1 of 2) |
| Figure 5‑21: Initial Placement ICD Procedures by Country, Latin America, 2022 – 2032 (2 of 2) |
| Figure 5‑22: Initial Placement ICD Procedures by Country, Western Europe, 2022 – 2032 |
| Figure 5‑23: Initial Placement ICD Procedures by Country, Central & Eastern Europe, 2022 – 2032 (1 of 2) |
| Figure 5‑24: Initial Placement ICD Procedures by Country, Central & Eastern Europe, 2022 – 2032 (2 of 2) |
| Figure 5‑25: Initial Placement ICD Procedures by Country, Middle East, 2022 – 2032 |
| Figure 5‑26: Initial Placement ICD Procedures by Country, Asia-Pacific, 2022 – 2032 (1 of 3) |
| Figure 5‑27: Initial Placement ICD Procedures by Country, Asia-Pacific, 2022 – 2032 (2 of 3) |
| Figure 5‑28: Initial Placement ICD Procedures by Country, Asia-Pacific, 2022 – 2032 (3 of 3) |
| Figure 5‑29: Initial Placement ICD Procedures by Country, Africa, 2022 – 2032 |
| Figure 5‑30: Replacement ICD Procedures by Region, Global, 2022 – 2032 |
| Figure 5‑31: Replacement ICD Procedures by Country, North America, 2022 – 2032 |
| Figure 5‑32: Replacement ICD Procedures by Country, Latin America, 2022 – 2032 (1 of 2) |
| Figure 5‑33: Replacement ICD Procedures by Country, Latin America, 2022 – 2032 (2 of 2) |
| Figure 5‑34: Replacement ICD Procedures by Country, Western Europe, 2022 – 2032 |
| Figure 5‑35: Replacement ICD Procedures by Country, Central & Eastern Europe, 2022 – 2032 (1 of 2) |
| Figure 5‑36: Replacement ICD Procedures by Country, Central & Eastern Europe, 2022 – 2032 (2 of 2) |
| Figure 5‑37: Replacement ICD Procedures by Country, Middle East, 2022 – 2032 |
| Figure 5‑38: Replacement ICD Procedures by Country, Asia-Pacific, 2022 – 2032 (1 of 3) |
| Figure 5‑39: Replacement ICD Procedures by Country, Asia-Pacific, 2022 – 2032 (2 of 3) |
| Figure 5‑40: Replacement ICD Procedures by Country, Asia-Pacific, 2022 – 2032 (3 of 3) |
| Figure 5‑41: Replacement ICD Procedures by Country, Africa, 2022 – 2032 |
| Figure 5‑42: ICD Market by Segment, Global, 2022 – 2032 (US$M) |
| Figure 5‑43: ICD Market by Region, Global, 2022 – 2032 (US$M) |
| Figure 5‑44: ICD Market, Global, 2022 – 2032 |
| Figure 5‑45: Units Sold by Region, ICD Market, Global, 2022 – 2032 |
| Figure 5‑46: Average Selling Price by Region, ICD Market, Global, 2022 – 2032 (US$) |
| Figure 5‑47: Market Value by Region, ICD Market, Global, 2022 – 2032 (US$M) |
| Figure 5‑48: Single-Chamber ICD Market by Segment, Global, 2022 – 2032 (US$M) |
| Figure 5‑49: Single-Chamber ICD Market, Global, 2022 – 2032 |
| Figure 5‑50: Units Sold by Region, Single-Chamber ICD Market, Global, 2022 – 2032 |
| Figure 5‑51: Average Selling Price by Region, Single-Chamber ICD Market, Global, 2022 – 2032 (US$) |
| Figure 5‑52: Market Value by Region, Single-Chamber ICD Market, Global, 2022 – 2032 (US$M) |
| Figure 5‑53: Initial Placement Single-Chamber ICD Market, Global, 2022 – 2032 |
| Figure 5‑54: Units Sold by Region, Initial Placement Single-Chamber ICD Market, Global, 2022 – 2032 |
| Figure 5‑55: Average Selling Price by Region, Initial Placement Single-Chamber ICD Market, Global, 2022 – 2032 (US$) |
| Figure 5‑56: Market Value by Region, Initial Placement Single-Chamber ICD Market, Global, 2022 – 2032 (US$M) |
| Figure 5‑57: Replacement Single-Chamber ICD Market, Global, 2022 – 2032 |
| Figure 5‑58: Units Sold by Region, Replacement Single-Chamber ICD Market, Global, 2022 – 2032 |
| Figure 5‑59: Average Selling Price by Region, Replacement Single-Chamber ICD Market, Global, 2022 – 2032 (US$) |
| Figure 5‑60: Market Value by Region, Replacement Single-Chamber ICD Market, Global, 2022 – 2032 (US$M) |
| Figure 5‑61: Dual-Chamber ICD Market by Segment, Global, 2022 – 2032 (US$M) |
| Figure 5‑62: Dual-Chamber ICD Market, Global, 2022 – 2032 |
| Figure 5‑63: Units Sold by Region, Dual-Chamber ICD Market, Global, 2022 – 2032 |
| Figure 5‑64: Average Selling Price by Region, Dual-Chamber ICD Market, Global, 2022 – 2032 (US$) |
| Figure 5‑65: Market Value by Region, Dual-Chamber ICD Market, Global, 2022 – 2032 (US$M) |
| Figure 5‑66: Initial Placement Dual-Chamber ICD Market, Global, 2022 – 2032 |
| Figure 5‑67: Units Sold by Region, Initial Placement Dual-Chamber ICD Market, Global, 2022 – 2032 |
| Figure 5‑68: Average Selling Price by Region, Initial Placement Dual-Chamber ICD Market, Global, 2022 – 2032 (US$) |
| Figure 5‑69: Market Value by Region, Initial Placement Dual-Chamber ICD Market, Global, 2022 – 2032 (US$M) |
| Figure 5‑70: Replacement Dual-Chamber ICD Market, Global, 2022 – 2032 |
| Figure 5‑71: Units Sold by Region, Replacement Dual-Chamber ICD Market, Global, 2022 – 2032 |
| Figure 5‑72: Average Selling Price by Region, Replacement Dual-Chamber ICD Market, Global, 2022 – 2032 (US$) |
| Figure 5‑73: Market Value by Region, Replacement Dual-Chamber ICD Market, Global, 2022 – 2032 (US$M) |
| Figure 5‑74: S-ICD Market by Segment, Global, 2022 – 2032 (US$M) |
| Figure 5‑75: S-ICD Market, Global, 2022 – 2032 |
| Figure 5‑76: Units Sold by Region, S-ICD Market, Global, 2022 – 2032 |
| Figure 5‑77: Average Selling Price by Region, S-ICD Market, Global, 2022 – 2032 (US$) |
| Figure 5‑78: Market Value by Region, S-ICD Market, Global, 2022 – 2032 (US$M) |
| Figure 5‑79: Initial Placement S-ICD Market, Global, 2022 – 2032 |
| Figure 5‑80: Units Sold by Region, Initial Placement S-ICD Market, Global, 2022 – 2032 |
| Figure 5‑81: Average Selling Price by Region, Initial Placement S-ICD Market, Global, 2022 – 2032 (US$) |
| Figure 5‑82: Market Value by Region, Initial Placement S-ICD Market, Global, 2022 – 2032 (US$M) |
| Figure 5‑83: Replacement S-ICD Market, Global, 2022 – 2032 |
| Figure 5‑84: Units Sold by Region, Replacement S-ICD Market, Global, 2022 – 2032 |
| Figure 5‑85: Average Selling Price by Region, Replacement S-ICD Market, Global, 2022 – 2032 (US$) |
| Figure 5‑86: Market Value by Region, Replacement S-ICD Market, Global, 2022 – 2032 (US$M) |
| Figure 5‑87: EV-ICD Market, Global, 2022 – 2032 |
| Figure 5‑88: Units Sold by Region, EV-ICD Market, Global, 2022 – 2032 |
| Figure 5‑89: Average Selling Price by Region, EV-ICD Market, Global, 2022 – 2032 (US$) |
| Figure 5‑90: Market Value by Region, EV-ICD Market, Global, 2022 – 2032 (US$M) |
| Figure 5‑91: Leading Competitors, ICD Market, Global, 2025 |
| Figure 5‑92: Leading Competitors by Region, ICD Market, Global, 2025 |
| Figure 5‑93: Leading Competitors by Region, Single-Chamber ICD Market, Global, 2025 |
| Figure 5‑94: Leading Competitors by Region, Dual-Chamber ICD Market, Global, 2025 |
| Figure 6‑1: CRT Device Procedures Covered |
| Figure 6‑2: CRT Device Markets Covered |
| Figure 6‑3: CRT Device Regions Covered, Global (1 of 2) |
| Figure 6‑4: CRT Device Regions Covered, Global (2 of 2) |
| Figure 6‑5: CRT Placement Procedures by Segment, Global, 2022 – 2032 |
| Figure 6‑6: CRT Placement Procedures by Region, Global, 2022 – 2032 |
| Figure 6‑7: CRT Placement Procedures by Country, North America, 2022 – 2032 |
| Figure 6‑8: CRT Placement Procedures by Country, Latin America, 2022 – 2032 (1 of 2) |
| Figure 6‑9: CRT Placement Procedures by Country, Latin America, 2022 – 2032 (2 of 2) |
| Figure 6‑10: CRT Placement Procedures by Country, Western Europe, 2022 – 2032 |
| Figure 6‑11: CRT Placement Procedures by Country, Central & Eastern Europe, 2022 – 2032 (1 of 2) |
| Figure 6‑12: CRT Placement Procedures by Country, Central & Eastern Europe, 2022 – 2032 (2 of 2) |
| Figure 6‑13: CRT Placement Procedures by Country, Middle East, 2022 – 2032 |
| Figure 6‑14: CRT Placement Procedures by Country, Asia-Pacific, 2022 – 2032 (1 of 3) |
| Figure 6‑15: CRT Placement Procedures by Country, Asia-Pacific, 2022 – 2032 (2 of 3) |
| Figure 6‑16: CRT Placement Procedures by Country, Asia-Pacific, 2022 – 2032 (3 of 3) |
| Figure 6‑17: CRT Placement Procedures by Country, Africa, 2022 – 2032 |
| Figure 6‑18: Initial Placement CRT Procedures by Region, Global, 2022 – 2032 |
| Figure 6‑19: Initial Placement CRT Procedures by Country, North America, 2022 – 2032 |
| Figure 6‑20: Initial Placement CRT Procedures by Country, Latin America, 2022 – 2032 (1 of 2) |
| Figure 6‑21: Initial Placement CRT Procedures by Country, Latin America, 2022 – 2032 (2 of 2) |
| Figure 6‑22: Initial Placement CRT Procedures by Country, Western Europe, 2022 – 2032 |
| Figure 6‑23: Initial Placement CRT Procedures by Country, Central & Eastern Europe, 2022 – 2032 (1 of 2) |
| Figure 6‑24: Initial Placement CRT Procedures by Country, Central & Eastern Europe, 2022 – 2032 (2 of 2) |
| Figure 6‑25: Initial Placement CRT Procedures by Country, Middle East, 2022 – 2032 |
| Figure 6‑26: Initial Placement CRT Procedures by Country, Asia-Pacific, 2022 – 2032 (1 of 3) |
| Figure 6‑27: Initial Placement CRT Procedures by Country, Asia-Pacific, 2022 – 2032 (2 of 3) |
| Figure 6‑28: Initial Placement CRT Procedures by Country, Asia-Pacific, 2022 – 2032 (3 of 3) |
| Figure 6‑29: Initial Placement CRT Procedures by Country, Africa, 2022 – 2032 |
| Figure 6‑30: Replacement CRT Procedures by Region, Global, 2022 – 2032 |
| Figure 6‑31: Replacement CRT Procedures by Country, North America, 2022 – 2032 |
| Figure 6‑32: Replacement CRT Procedures by Country, Latin America, 2022 – 2032 (1 of 2) |
| Figure 6‑33: Replacement CRT Procedures by Country, Latin America, 2022 – 2032 (2 of 2) |
| Figure 6‑34: Replacement CRT Procedures by Country, Western Europe, 2022 – 2032 |
| Figure 6‑35: Replacement CRT Procedures by Country, Central & Eastern Europe, 2022 – 2032 (1 of 2) |
| Figure 6‑36: Replacement CRT Procedures by Country, Central & Eastern Europe, 2022 – 2032 (2 of 2) |
| Figure 6‑37: Replacement CRT Procedures by Country, Middle East, 2022 – 2032 |
| Figure 6‑38: Replacement CRT Procedures by Country, Asia-Pacific, 2022 – 2032 (1 of 3) |
| Figure 6‑39: Replacement CRT Procedures by Country, Asia-Pacific, 2022 – 2032 (2 of 3) |
| Figure 6‑40: Replacement CRT Procedures by Country, Asia-Pacific, 2022 – 2032 (3 of 3) |
| Figure 6‑41: Replacement CRT Procedures by Country, Africa, 2022 – 2032 |
| Figure 6‑42: CRT Device Market by Segment, Global, 2022 – 2032 (US$M) |
| Figure 6‑43: CRT Device Market by Region, Global, 2022 – 2032 (US$M) |
| Figure 6‑44: CRT Device Market, Global, 2022 – 2032 |
| Figure 6‑45: Units Sold by Region, CRT Device Market, Global, 2022 – 2032 |
| Figure 6‑46: Average Selling Price by Region, CRT Device Market, Global, 2022 – 2032 (US$) |
| Figure 6‑47: Market Value by Region, CRT Device Market, Global, 2022 – 2032 (US$M) |
| Figure 6‑48: CRT-P Market by Segment, Global, 2022 – 2032 (US$M) |
| Figure 6‑49: CRT-P Market, Global, 2022 – 2032 |
| Figure 6‑50: Units Sold by Region, CRT-P Market, Global, 2022 – 2032 |
| Figure 6‑51: Average Selling Price by Region, CRT-P Market, Global, 2022 – 2032 (US$) |
| Figure 6‑52: Market Value by Region, CRT-P Market, Global, 2022 – 2032 (US$M) |
| Figure 6‑53: Initial Placement CRT-P Market, Global, 2022 – 2032 |
| Figure 6‑54: Units Sold by Region, Initial Placement CRT-P Market, Global, 2022 – 2032 |
| Figure 6‑55: Average Selling Price by Region, Initial Placement CRT-P Market, Global, 2022 – 2032 (US$) |
| Figure 6‑56: Market Value by Region, Initial Placement CRT-P Market, Global, 2022 – 2032 (US$M) |
| Figure 6‑57: Replacement CRT-P Market, Global, 2022 – 2032 |
| Figure 6‑58: Units Sold by Region, Replacement CRT-P Market, Global, 2022 – 2032 |
| Figure 6‑59: Average Selling Price by Region, Replacement CRT-P Market, Global, 2022 – 2032 (US$) |
| Figure 6‑60: Market Value by Region, Replacement CRT-P Market, Global, 2022 – 2032 (US$M) |
| `Figure 6‑61: CRT-D Market by Segment, Global, 2022 – 2032 (US$M) |
| Figure 6‑62: CRT-D Market, Global, 2022 – 2032 |
| Figure 6‑63: Units Sold by Region, CRT-D Market, Global, 2022 – 2032 |
| Figure 6‑64: Average Selling Price by Region, CRT-D Market, Global, 2022 – 2032 (US$) |
| Figure 6‑65: Market Value by Region, CRT-D Market, Global, 2022 – 2032 (US$M) |
| Figure 6‑66: Initial Placement CRT-D Market, Global, 2022 – 2032 |
| Figure 6‑67: Units Sold by Region, Initial Placement CRT-D Market, Global, 2022 – 2032 |
| Figure 6‑68: Average Selling Price by Region, Initial Placement CRT-D Market, Global, 2022 – 2032 (US$) |
| Figure 6‑69: Market Value by Region, Initial Placement CRT-D Market, Global, 2022 – 2032 (US$M) |
| Figure 6‑70: Replacement CRT-D Market, Global, 2022 – 2032 |
| Figure 6‑71: Units Sold by Region, Replacement CRT-D Market, Global, 2022 – 2032 |
| Figure 6‑72: Average Selling Price by Region, Replacement CRT-D Market, Global, 2022 – 2032 (US$) |
| Figure 6‑73: Market Value by Region, Replacement CRT-D Market, Global, 2022 – 2032 (US$M) |
| Figure 6‑74: Leading Competitors, CRT Market, Global, 2025 |
| Figure 6‑75: Leading Competitors by Region, CRT Market, Global, 2025 |
| Figure 6‑76: Leading Competitors by Region, CRT-D Market, Global, 2025 |
| Figure 6‑77: Leading Competitors by Region, CRT-P Market, Global, 2025 |
| Figure 7‑1: Cardiac Lead Markets Covered |
| Figure 7‑2: Cardiac Lead Regions Covered, Global (1 of 2) |
| Figure 7‑3: Cardiac Lead Regions Covered, Global (2 of 2) |
| Figure 7‑4: Cardiac Lead Market by Segment, Global, 2022 – 2032 (US$M) |
| Figure 7‑5: Cardiac Lead Market by Region, Global, 2022 – 2032 (US$M) |
| Figure 7‑6: Cardiac Lead Market, Global, 2022 – 2032 |
| Figure 7‑7: Units Sold by Region, Cardiac Lead Market, Global, 2022 – 2032 |
| Figure 7‑8: Average Selling Price by Region, Cardiac Lead Market, Global, 2022 – 2032 (US$) |
| Figure 7‑9: Market Value by Region, Cardiac Lead Market, Global, 2022 – 2032 (US$M) |
| Figure 7‑10: Pacing Lead Market, Global, 2022 – 2032 |
| Figure 7‑11: Units Sold by Region, Pacing Lead Market, Global, 2022 – 2032 |
| Figure 7‑12: Average Selling Price by Region, Pacing Lead Market, Global, 2022 – 2032 (US$) |
| Figure 7‑13: Market Value by Region, Pacing Lead Market, Global, 2022 – 2032 (US$M) |
| Figure 7‑14: Defibrillation Lead Market, Global, 2022 – 2032 |
| Figure 7‑15: Units Sold by Region, Defibrillation Lead Market, Global, 2022 – 2032 |
| Figure 7‑16: Average Selling Price by Region, Defibrillation Lead Market, Global, 2022 – 2032 (US$) |
| Figure 7‑17: Market Value by Region, Defibrillation Lead Market, Global, 2022 – 2032 (US$M) |
| Figure 7‑18: LV Lead Market, Global, 2022 – 2032 |
| Figure 7‑19: Units Sold by Region, LV Lead Market, Global, 2022 – 2032 |
| Figure 7‑20: Average Selling Price by Region, LV Lead Market, Global, 2022 – 2032 (US$) |
| Figure 7‑21: Market Value by Region, LV Lead Market, Global, 2022 – 2032 (US$M) |
| Figure 7‑22: Leading Competitors, Cardiac Lead Market, Global, 2025 |
| Figure 8‑1: Insertable Cardiac Monitor Regions Covered, Global (1 of 2) |
| Figure 8‑2: Insertable Cardiac Monitor Regions Covered, Global (2 of 2) |
| Figure 8‑3: Insertable Cardiac Monitor Placement Procedures by Region, Global, 2022 – 2032 |
| Figure 8‑4: Insertable Cardiac Monitor Placement Procedures by Country, North America, 2022 – 2032 |
| Figure 8‑5: Insertable Cardiac Monitor Placement Procedures by Country, Latin America, 2022 – 2032 (1 of 2) |
| Figure 8‑6: Insertable Cardiac Monitor Placement Procedures by Country, Latin America, 2022 – 2032 (2 of 2) |
| Figure 8‑7: Insertable Cardiac Monitor Placement Procedures by Country, Western Europe, 2022 – 2032 |
| Figure 8‑8: Insertable Cardiac Monitor Placement Procedures by Country, Central & Eastern Europe, 2022 – 2032 (1 of 2) |
| Figure 8‑9: Insertable Cardiac Monitor Placement Procedures by Country, Central & Eastern Europe, 2022 – 2032 (2 of 2) |
| Figure 8‑10: Insertable Cardiac Monitor Placement Procedures by Country, Middle East, 2022 – 2032 |
| Figure 8‑11: Insertable Cardiac Monitor Placement Procedures by Country, Asia-Pacific, 2022 – 2032 (1 of 3) |
| Figure 8‑12: Insertable Cardiac Monitor Placement Procedures by Country, Asia-Pacific, 2022 – 2032 (2 of 3) |
| Figure 8‑13: Insertable Cardiac Monitor Placement Procedures by Country, Asia-Pacific, 2022 – 2032 (3 of 3) |
| Figure 8‑14: Insertable Cardiac Monitor Placement Procedures by Country, Africa, 2022 – 2032 |
| Figure 8‑15: Insertable Cardiac Monitor Market, Global, 2022 – 2032 |
| Figure 8‑16: Units Sold by Region, Insertable Cardiac Monitor Market, Global, 2022 – 2032 |
| Figure 8‑17: Average Selling Price by Region, Insertable Cardiac Monitor Market, Global, 2022 – 2032 (US$) |
| Figure 8‑18: Market Value by Region, Insertable Cardiac Monitor Market, Global, 2022 – 2032 (US$M) |
| Figure 8‑19: Leading Competitors, Insertable Cardiac Monitor Market, Global, 2025 |
| Figure 9‑1: Electrophysiology Lab System Markets Covered |
| Figure 9‑2: Electrophysiology Lab System Regions Covered, Global (1 of 2) |
| Figure 9‑3: Electrophysiology Lab System Regions Covered, Global (2 of 2) |
| Figure 9‑4: Electrophysiology Lab System Market by Segment, Global, 2022 – 2032 (US$M) |
| Figure 9‑5: Electrophysiology Lab System Market by Region, Global, 2022 – 2032 (US$M) |
| Figure 9‑6: Electrophysiology Lab System Market, Global, 2022 – 2032 |
| Figure 9‑7: Units Sold by Region, Electrophysiology Lab System Market, Global, 2022 – 2032 |
| Figure 9‑8: Average Selling Price by Region, Electrophysiology Lab System Market, Global, 2022 – 2032 (US$) |
| Figure 9‑9: Market Value by Region, Electrophysiology Lab System Market, Global, 2022 – 2032 (US$M) |
| Figure 9‑10: 3D Mapping System Market, Global, 2022 – 2032 |
| Figure 9‑11: Units Sold by Region, 3D Mapping System Market, Global, 2022 – 2032 |
| Figure 9‑12: Average Selling Price by Region, 3D Mapping System Market, Global, 2022 – 2032 (US$) |
| Figure 9‑13: Market Value by Region, 3D Mapping System Market, Global, 2022 – 2032 (US$M) |
| Figure 9‑14: EP Recording System Market, Global, 2022 – 2032 |
| Figure 9‑15: Units Sold by Region, EP Recording System Market, Global, 2022 – 2032 |
| Figure 9‑16: Average Selling Price by Region, EP Recording System Market, Global, 2022 – 2032 (US$) |
| Figure 9‑17: Market Value by Region, EP Recording System Market, Global, 2022 – 2032 (US$M) |
| Figure 9‑18: Leading Competitors, Electrophysiology Lab System Market, Global, 2025 |
| Figure 10‑1: Diagnostic Electrophysiology Catheter Markets Covered |
| Figure 10‑2: Diagnostic Electrophysiology Catheter Regions Covered, Global (1 of 2) |
| Figure 10‑3: Diagnostic Electrophysiology Catheter Regions Covered, Global (2 of 2) |
| Figure 10‑4: Diagnostic Electrophysiology Procedures by Region, Global, 2022 – 2032 |
| Figure 10‑5: Diagnostic Electrophysiology Procedures by Country, North America, 2022 – 2032 |
| Figure 10‑6: Diagnostic Electrophysiology Procedures by Country, Latin America, 2022 – 2032 (1 of 2) |
| Figure 10‑7: Diagnostic Electrophysiology Procedures by Country, Latin America, 2022 – 2032 (2 of 2) |
| Figure 10‑8: Diagnostic Electrophysiology Procedures by Country, Western Europe, 2022 – 2032 |
| Figure 10‑9: Diagnostic Electrophysiology Procedures by Country, Central & Eastern Europe, 2022 – 2032 (1 of 2) |
| Figure 10‑10: Diagnostic Electrophysiology Procedures by Country, Central & Eastern Europe, 2022 – 2032 (2 of 2) |
| Figure 10‑11: Diagnostic Electrophysiology Procedures by Country, Middle East, 2022 – 2032 |
| Figure 10‑12: Diagnostic Electrophysiology Procedures by Country, Asia-Pacific, 2022 – 2032 (1 of 3) |
| Figure 10‑13: Diagnostic Electrophysiology Procedures by Country, Asia-Pacific, 2022 – 2032 (2 of 3) |
| Figure 10‑14: Diagnostic Electrophysiology Procedures by Country, Asia-Pacific, 2022 – 2032 (3 of 3) |
| Figure 10‑15: Diagnostic Electrophysiology Procedures by Country, Africa, 2022 – 2032 |
| Figure 10‑16: Diagnostic Electrophysiology Catheter Market by Segment, Global, 2022 – 2032 (US$M) |
| Figure 10‑17: Diagnostic Electrophysiology Catheter Market by Region, Global, 2022 – 2032 (US$M) |
| Figure 10‑18: Units Sold by Region, Diagnostic Electrophysiology Catheter Market, Global, 2022 – 2032 |
| Figure 10‑19: Average Selling Price by Region, Diagnostic Electrophysiology Catheter Market, Global, 2022 – 2032 (US$) |
| Figure 10‑20: Market Value by Region, Diagnostic Electrophysiology Catheter Market, Global, 2022 – 2032 (US$M) |
| Figure 10‑21: Conventional Electrophysiology Catheter Market, Global, 2022 – 2032 |
| Figure 10‑22: Units Sold by Region, Conventional Electrophysiology Catheter Market, Global, 2022 – 2032 |
| Figure 10‑23: Average Selling Price by Region, Conventional Electrophysiology Catheter Market, Global, 2022 – 2032 (US$) |
| Figure 10‑24: Market Value by Region, Conventional Electrophysiology Catheter Market, Global, 2022 – 2032 (US$M) |
| Figure 10‑25: Advanced Electrophysiology Catheter Market, Global, 2022 – 2032 |
| Figure 10‑26: Units Sold by Region, Advanced Electrophysiology Catheter Market, Global, 2022 – 2032 |
| Figure 10‑27: Average Selling Price by Region, Advanced Electrophysiology Catheter Market, Global, 2022 – 2032 (US$) |
| Figure 10‑28: Market Value by Region, Advanced Electrophysiology Catheter Market, Global, 2022 – 2032 (US$M) |
| Figure 10‑29: ICE Catheter Market, Global, 2022 – 2032 |
| Figure 10‑30: Units Sold by Region, ICE Catheter Market, Global, 2022 – 2032 |
| Figure 10‑31: Average Selling Price by Region, ICE Catheter Market, Global, 2022 – 2032 (US$) |
| Figure 10‑32: Market Value by Region, ICE Catheter Market, Global, 2022 – 2032 (US$M) |
| Figure 10‑33: Leading Competitors, Diagnostic Electrophysiology Catheter Market, Global, 2025 |
| Figure 11‑1: Cardiac Ablation Catheter Procedures Covered |
| Figure 11‑2: Cardiac Ablation Catheter Markets Covered |
| Figure 11‑3: Cardiac Ablation Catheter Regions Covered, Global (1 of 2) |
| Figure 11‑4: Cardiac Ablation Catheter Regions Covered, Global (2 of 2) |
| Figure 11‑5: Cardiac Ablation Procedures by Segment, Global, 2022 – 2032 |
| Figure 11‑6: Cardiac Ablation Procedures by Region, Global, 2022 – 2032 |
| Figure 11‑7: Cardiac Ablation Procedures by Country, North America, 2022 – 2032 |
| Figure 11‑8: Cardiac Ablation Procedures by Country, Latin America, 2022 – 2032 (1 of 2) |
| Figure 11‑9: Cardiac Ablation Procedures by Country, Latin America, 2022 – 2032 (2 of 2) |
| Figure 11‑10: Cardiac Ablation Procedures by Country, Western Europe, 2022 – 2032 |
| Figure 11‑11: Cardiac Ablation Procedures by Country, Central & Eastern Europe, 2022 – 2032 (1 of 2) |
| Figure 11‑12: Cardiac Ablation Procedures by Country, Central & Eastern Europe, 2022 – 2032 (2 of 2) |
| Figure 11‑13: Cardiac Ablation Procedures by Country, Middle East, 2022 – 2032 |
| Figure 11‑14: Cardiac Ablation Procedures by Country, Asia-Pacific, 2022 – 2032 (1 of 3) |
| Figure 11‑15: Cardiac Ablation Procedures by Country, Asia-Pacific, 2022 – 2032 (2 of 3) |
| Figure 11‑16: Cardiac Ablation Procedures by Country, Asia-Pacific, 2022 – 2032 (3 of 3) |
| Figure 11‑17: Cardiac Ablation Procedures by Country, Africa, 2022 – 2032 |
| Figure 11‑18: RF Ablation Procedures by Region, Global, 2022 – 2032 |
| Figure 11‑19: RF Ablation Procedures by Country, North America, 2022 – 2032 |
| Figure 11‑20: RF Ablation Procedures by Country, Latin America, 2022 – 2032 (1 of 2) |
| Figure 11‑21: RF Ablation Procedures by Country, Latin America, 2022 – 2032 (2 of 2) |
| Figure 11‑22: RF Ablation Procedures by Country, Western Europe, 2022 – 2032 |
| Figure 11‑23: RF Ablation Procedures by Country, Central & Eastern Europe, 2022 – 2032 (1 of 2) |
| Figure 11‑24: RF Ablation Procedures by Country, Central & Eastern Europe, 2022 – 2032 (2 of 2) |
| Figure 11‑25: RF Ablation Procedures by Country, Middle East, 2022 – 2032 |
| Figure 11‑26: RF Ablation Procedures by Country, Asia-Pacific, 2022 – 2032 (1 of 3) |
| Figure 11‑27: RF Ablation Procedures by Country, Asia-Pacific, 2022 – 2032 (2 of 3) |
| Figure 11‑28: RF Ablation Procedures by Country, Asia-Pacific, 2022 – 2032 (3 of 3) |
| Figure 11‑29: RF Ablation Procedures by Country, Africa, 2022 – 2032 |
| Figure 11‑30: Cryoablation Procedures by Region, Global, 2022 – 2032 |
| Figure 11‑31: Cryoablation Procedures by Country, North America, 2022 – 2032 |
| Figure 11‑32: Cryoablation Procedures by Country, Latin America, 2022 – 2032 (1 of 2) |
| Figure 11‑33: Cryoablation Procedures by Country, Latin America, 2022 – 2032 (2 of 2) |
| Figure 11‑34: Cryoablation Procedures by Country, Western Europe, 2022 – 2032 |
| Figure 11‑35: Cryoablation Procedures by Country, Central & Eastern Europe, 2022 – 2032 (1 of 2) |
| Figure 11‑36: Cryoablation Procedures by Country, Central & Eastern Europe, 2022 – 2032 (2 of 2) |
| Figure 11‑37: Cryoablation Procedures by Country, Middle East, 2022 – 2032 |
| Figure 11‑38: Cryoablation Procedures by Country, Asia-Pacific, 2022 – 2032 (1 of 3) |
| Figure 11‑39: Cryoablation Procedures by Country, Asia-Pacific, 2022 – 2032 (2 of 3) |
| Figure 11‑40: Cryoablation Procedures by Country, Asia-Pacific, 2022 – 2032 (3 of 3) |
| Figure 11‑41: Cryoablation Procedures by Country, Africa, 2022 – 2032 |
| Figure 11‑42: PFA Procedures by Region, Global, 2022 – 2032 |
| Figure 11‑43: PFA Procedures by Country, North America, 2022 – 2032 |
| Figure 11‑44: PFA Procedures by Country, Latin America, 2022 – 2032 (1 of 2) |
| Figure 11‑45: PFA Procedures by Country, Latin America, 2022 – 2032 (2 of 2) |
| Figure 11‑46: PFA Procedures by Country, Western Europe, 2022 – 2032 |
| Figure 11‑47: PFA Procedures by Country, Central & Eastern Europe, 2022 – 2032 (1 of 2) |
| Figure 11‑48: PFA Procedures by Country, Central & Eastern Europe, 2022 – 2032 (2 of 2) |
| Figure 11‑49: PFA Procedures by Country, Middle East, 2022 – 2032 |
| Figure 11‑50: PFA Procedures by Country, Asia-Pacific, 2022 – 2032 (1 of 3) |
| Figure 11‑51: PFA Procedures by Country, Asia-Pacific, 2022 – 2032 (2 of 3) |
| Figure 11‑52: PFA Procedures by Country, Asia-Pacific, 2022 – 2032 (3 of 3) |
| Figure 11‑53: PFA Procedures by Country, Africa, 2022 – 2032 |
| Figure 11‑54: Cardiac Ablation Catheter Market by Segment, Global, 2022 – 2032 (US$M) |
| Figure 11‑55: Cardiac Ablation Catheter Market by Region, Global, 2022 – 2032 (US$M) |
| Figure 11‑56: Cardiac Ablation Catheter Market, Global, 2022 – 2032 |
| Figure 11‑57: Units Sold by Region, Cardiac Ablation Catheter Market, Global, 2022 – 2032 |
| Figure 11‑58: Average Selling Price by Region, Cardiac Ablation Catheter Market, Global, 2022 – 2032 (US$) |
| Figure 11‑59: Market Value by Region, Cardiac Ablation Catheter Market, Global, 2022 – 2032 (US$M) |
| Figure 11‑60: RF Ablation Catheter Market, Global, 2022 – 2032 |
| Figure 11‑61: Units Sold by Region, RF Ablation Catheter Market, Global, 2022 – 2032 |
| Figure 11‑62: Average Selling Price by Region, RF Ablation Catheter Market, Global, 2022 – 2032 (US$) |
| Figure 11‑63: Market Value by Region, RF Ablation Catheter Market, Global, 2022 – 2032 (US$M) |
| Figure 11‑64: Cryoablation Catheter Market, Global, 2022 – 2032 |
| Figure 11‑65: Units Sold by Region, Cryoablation Catheter Market, Global, 2022 – 2032 |
| Figure 11‑66: Average Selling Price by Region, Cryoablation Catheter Market, Global, 2022 – 2032 (US$) |
| Figure 11‑67: Market Value by Region, Cryoablation Catheter Market, Global, 2022 – 2032 (US$M) |
| Figure 11‑68: PFA Catheter Market, Global, 2022 – 2032 |
| Figure 11‑69: Units Sold by Region, PFA Catheter Market, Global, 2022 – 2032 |
| Figure 11‑70: Average Selling Price by Region, PFA Catheter Market, Global, 2022 – 2032 (US$) |
| Figure 11‑71: Market Value by Region, PFA Catheter Market, Global, 2022 – 2032 (US$M) |
| Figure 11‑72: Leading Competitors, Cardiac Ablation Catheter Market, Global, 2025 |
| Figure 11‑73: Leading Competitors by Region, Cardiac Ablation Catheter Market, Global, 2025 |

 The global cardiac rhythm management market demographic primarily includes patients with cardiovascular disease (CVD), with prevalence and device candidacy rising materially with age; therefore, as the global population continues to age, the incidence of CVD and associated rhythm disorders is expected to increase. CVD remains the leading cause of death globally, with an estimated 19.8 million deaths in 2022, representing approximately 32% of all global deaths, reinforcing a structurally expanding patient base. Demographic momentum is significant: the population aged 60+ reached 1 billion in 2020, outnumbering children under 5, and is projected to rise to 1.4 billion by 2030 (1 in 6 people) and 2.1 billion by 2050, with the 80+ cohort expected to reach 426 million and approximately 80% of older adults expected to reside in low- and middle-income countries by mid-century. In parallel, rising obesity continues to elevate cardiometabolic risk and downstream heart disease, with 2.5 billion adults overweight in 2022 and 890 million living with obesity (16% of adults).