| Figure 1‑1: Wound and Tissue Management Market Share Ranking by Segment, U.S., 2023 (1 of 2) |
| Figure 1‑2: Wound and Tissue Management Market Share Ranking by Segment, U.S., 2023 (2 of 2) |
| Figure 1‑3: Companies Researched in This Report (1 of 2) |
| Figure 1‑4: Companies Researched in This Report (2 of 2) |
| Figure 1‑5: Factors Impacting the Wound and Tissue Management Market by Segment, U.S. (1 of 2) |
| Figure 1‑6: Factors Impacting the Wound and Tissue Management Market by Segment, U.S. (2 of 2) |
| Figure 1‑7: Recent Events in the Wound and Tissue Management Market, U.S., 2020 – 2024 (1 of 2) |
| Figure 1‑8: Recent Events in the Wound and Tissue Management Market, U.S., 2020 – 2024 (2 of 2) |
| Figure 1‑9: Wound and Tissue Management Markets Covered (1 of 5) |
| Figure 1‑10: Wound and Tissue Management Markets Covered (2 of 5) |
| Figure 1‑11: Wound and Tissue Management Markets Covered (3 of 5) |
| Figure 1‑12: Wound and Tissue Management Markets Covered (4 of 5) |
| Figure 1‑13: Wound and Tissue Management Markets Covered (5 of 5) |
| Figure 1‑14: Key Report Updates |
| Figure 1‑15: Version History |
| Figure 2‑1: Wound and Tissue Management Market by Segment, Worst Case Scenario, U.S., 2020 – 2030 (US$M) (1 of 2) |
| Figure 2‑2: Wound and Tissue Management Market by Segment, Worst Case Scenario, U.S., 2020 – 2030 (US$M) (2 of 2) |
| Figure 2‑3: Wound and Tissue Management Market by Segment, Base Case Scenario, U.S., 2020 – 2030 (US$M) (1 of 2) |
| Figure 2‑4: Wound and Tissue Management Market by Segment, Base Case Scenario, U.S., 2020 – 2030 (US$M) (2 of 2) |
| Figure 2‑5: Wound and Tissue Management Market by Segment, Best Case Scenario, U.S., 2020 – 2030 (US$M) (1 of 2) |
| Figure 2‑6: Wound and Tissue Management Market by Segment, Best Case Scenario, U.S., 2020 – 2030 (US$M) (2 of 2) |
| Figure 4‑1 Wound Closure Device Products by Company (1 of 2) |
| Figure 4‑2 Wound Closure Device Market by Company (2 of 2) |
| Figure 4‑3 Traditional Wound Dressing Market by Company (1 of 2) |
| Figure 4‑4 Traditional Wound Dressings by Company (2 of 2) |
| Figure 4‑5 Advanced Wound Dressing Market by Company (1 of 3) |
| Figure 4‑6 Advanced Wound Dressing Market by Company (2 of 3) |
| Figure 4‑7 Advanced Wound Dressing Market by Company (3 of 3) |
| Figure 4‑8 Moist Dressing Market by Company (1 of 2) |
| Figure 4‑9 Moist Dressing Market by Company (2 of 2) |
| Figure 4‑10 Antimicrobial Dressing Market by Company |
| Figure 4‑11 Interactive Dressing Market by Company |
| Figure 4‑12 Non-Adherent Contact Layer Market by Company |
| Figure 4‑13 Surgical Hemostat Market by Company |
| Figure 4‑14 Tissue Sealant Products by Company |
| Figure 4‑15: Anti-Adhesion Market by Company |
| Figure 4‑16: Negative Pressure Wound Therapy Products by Company |
| Figure 4‑17: Static Compression Theraply by Company (1 of 3) |
| Figure 4‑18: Static Compression Theraply by Company (2 of 3) |
| Figure 4‑19: Static Compression Theraply by Company (3 of 3) |
| Figure 4‑20: Dynamic Compression Therapy by Company (1 of 2) |
| Figure 4‑21: Dynamic Compression Therapy by Company (2 of 2) |
| Figure 4‑22: Class 2 Device Recall Sofsilk Braided Silk sutures |
| Figure 4‑23: Class 2 Device Recall ECHELON Endopath Stapler |
| Figure 4‑24: Class 2 Device Recall Sofsilk Braided Silk sutures |
| Figure 4‑25: Class 2 Device Recall TriStaple 2.0 Black Intelligent Reload |
| Figure 4‑26: Class 2 Device Recall Medtronic |
| Figure 4‑27: Class 3 Device Recall Liquiband |
| Figure 4‑28: Class 2 Device Recall Class 2 Device Recall Ethicon ECHELON FLEX Powered Plus Stapler |
| Figure 4‑29: Class 2 Device Recall Ethicon Dermabond Advanced Topical Skin Adhesive-topical skin adhesive |
| Figure 4‑30: Class 2 Class 2 Class 2 Device Recall VICRYL MONOFILAMENT VIOLET |
| Figure 4‑31: Class 2 Device Recall Velosorb Fast Braided Absorbable Suture |
| Figure 4‑32: Class 2 Device Recall Endo GIA Auto Suture Universal Articulating Loading |
| Figure 4‑33: Class 2 Device Recall: MERSILK and PERMAHAND, Braided Silk and Virgin Silk Non-Absorbable Suture |
| Figure 4‑34: Class 2 Device Recall MERSILK and PERMAHAND, Braided Silk and Virgin Silk NonAbsorbable Suture |
| Figure 4‑35: Class 2 Device Recall |
| Figure 4‑36: Class 2 Device Recall Coated VICRYL (Polyglactin 910) Suture |
| Figure 4‑37: Class 2 Device Recall CarboFlex |
| Figure 4‑38: Class 2 Device Recall ConvaTec AQUACEL |
| Figure 4‑39: Class 2 Device Recall DuoDERM |
| Figure 4‑40: Class 2 Device Recall DuoDERM |
| Figure 4‑41: Class 2 Device Recall ConvaTec AQUACEL |
| Figure 4‑42: Class 2 Device Recall Gentrix Surgical Matrix Thick |
| Figure 4‑43: Class 2 Device Recall Baxter Ostene |
| Figure 4‑44: Class 2 Device Recall Baxter Floseal |
| Figure 4‑45: Class 2 Device Recall Baxter Coseal |
| Figure 4‑46: Class 2 Device Recall Ethicon |
| Figure 4‑47: Class 2 Device Recall Baxter Coseal |
| Figure 4‑48: Class 2 Device Recall Baxter Preveleak |
| Figure 4‑49: Class 2 Device Recall Baxter Seprafilm Adhesion Barrier |
| Figure 4‑50: Class 2 Device Recall Negative Pressure Wound Therapy Powered Suction Pump |
| Figure 4‑51: Class 3 Device Recall UNNA BOOT |
| Figure 4‑52: Class 2 Device Recall JOBST Compri2 & JOBST Compri2 Lite |
| Figure 4‑53: Vicryl Rapide Versus Nonabsorbable Suture in Repair of Simple Traumatic Extremity and Trunk Lacerations in Adult Patients |
| Figure 4‑54: Barbed Suture: A Look at Its Use for Hysterotomy Closure During Cesarean Section |
| Figure 4‑55: Subcuticular Absorbable Staples Versus Conventional Skin Closure in Women Undergoing Cesarean Delivery: A Randomized Control Trial |
| Figure 4‑56: Comparison of Negative Pressure Wound Therapy vs. Conventional Dressings for Prevention of Wound Complications After Revision THA |
| Figure 4‑57: PMS Study of Silver I Alginate Non-Woven Dressing (Hydro-Alginate) |
| Figure 4‑58: Novel Antimicrobial Dressing in Peripheral Intravenous Catheters (PIVCs) |
| Figure 4‑59: An Adaptive, Randomized, Controlled Trial Evaluating the Effectiveness of PermeaDerm® (PD) as Compared to Mepilex Ag® Used as Standard of Care in the Treatment of Adult and Pediatric Partial Thickness Burns. |
| Figure 4‑60: Effect of Negative Pressure Wound Therapy After Surgical Removal of Deep-Seated High-Malignant Soft Tissue Sarcomas of the Extremities and Trunk Wall. |
| Figure 4‑61: Effect of Negative Wound Pressure on P.S |
| Figure 4‑62: A Phase III Randomized Controlled Trial of Negative Pressure Wound Therapy in Post-Operative Incision Management |
| Figure 4‑63The Effect of Negative Pressure Wound Therapy on Wound Healing in Major Amputations |
| Figure 4‑64: PICO Negative Pressure Wound Therapy in Obese Women Undergoing Elective Cesarean Delivery. |
| Figure 4‑65: Negative Pressure Wound Therapy in Diabetic Wounds |
| Figure 4‑66: A Pilot Study to Compare the Efficacy of NPWT PRO Versus KCI Ulta® NPWT and to Compare NPWT PRO Versus NPWT PRO With Simultaneous Irrigation on Wound Healing |
| Figure 4‑67: GATT-Patch Versus SURGICEL® Original in Minimally Invasive Liver and Gallbladder Surgery |
| Figure 4‑68: ACCEL Absorbable Hemostat |
| Figure 4‑69: The EVARREST® Pediatric Mild or Moderate Liver and Soft Tissue Bleeding Study |
| Figure 4‑70: Assessment of Long-term Effects of Tachosil |
| Figure 4‑71: Observational Pilot Study With TachoSil as a Ventricular Sealant |
| Figure 4‑72: The ROle of Compression StocKings in Heart Failure Patients |
| Figure 4‑73: Use of Compression Bandages in the Prevention of Post-mastectomy Lymphoceles |
| Figure 4‑74: Adjustable Compression Wrap Versus Compression Bandage Reduce to Breast Cancer-related Lymphedema |
| Figure 4‑75: Effectiveness of Compression Stocking on Overnight Fluid Shift in Obstructive Sleep Apnoea Patients |
| Figure 4‑76: Evaluation of the Effect of Custom Compression Garments on Standing Static Balance in Ehlers Danlos Syndrome |
| Figure 4‑77: Effects of Dynamic Compression Garments in Children With CP |
| Figure 4‑78: Design Validation Hemodynamic Study of New Kendall SCD SmartFlow Compression System |
| Figure 4‑79: The Use of a Dynamic Compression Intramedullary Nail for Tibiotalocalcaneal Arthrodesis |
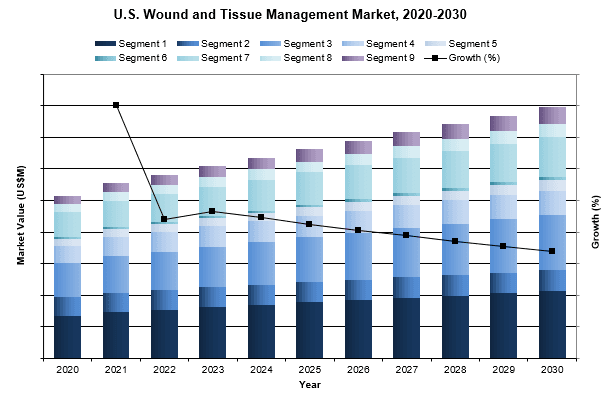
| Figure 5‑1: Wound and Tissue Management Market by Segment, U.S., 2020 – 2030 (US$M) (1 of 2) |
| Figure 5‑2: Wound and Tissue Management Market by Segment, U.S., 2020 – 2030 (US$M) (2 of 2) |
| Figure 5‑3: Leading Competitors, Wound and Tissue Management Market, U.S., 2023 (1 of 2) |
| Figure 5‑4: Leading Competitors, Wound and Tissue Management Market, U.S., 2023 (2 of 2) |
| Figure 5‑5: SWOT Analysis, Baxter |
| Figure 5‑6: SWOT Analysis Cardinal Health (1 of 2) |
| Figure 5‑7: SWOT Analysis, Essity |
| Figure 5‑8: SWOT Analysis, Ethicon |
| Figure 5‑9: SWOT Analysis, Integra LifeSciences |
| Figure 5‑10: SWOT Analysis, Intuitive Surgical |
| Figure 5‑11: SWOT Analysis, Medline |
| Figure 5‑12: SWOT Analysis, Medtronic |
| Figure 5‑13: SWOT Analysis, MiMedx |
| Figure 5‑14: SWOT Analysis, Organogenesis |
| Figure 5‑15: SWOT Analysis, Smith & Nephew |
| Figure 5‑16: SWOT Analysis, Tactile Medical |
| Figure 6‑1: Wound Closure Market by Segment, U.S., 2020 – 2030 (US$M) (1 of 2) |
| Figure 6‑2: Wound Closure Market by Segment, U.S., 2020 – 2030 (US$M) (2 of 2) |
| Figure 6‑3: Total Suture Market, U.S., 2020 – 2030 |
| Figure 6‑4: Suture Market by Device Type, U.S., 2020 – 2030 (US$M) |
| Figure 6‑5: Absorbable Suture Market, U.S., 2020 – 2030 |
| Figure 6‑6: Non-Absorbable Suture Market, U.S., 2020 – 2030 |
| Figure 6‑7: Knotless Tissue Closure Market, U.S., 2020 – 2030 |
| Figure 6‑8: Suture Market by Infection Control Type, U.S., 2020 – 2030 (US$M) |
| Figure 6‑9: Antibacterial Suture Market, U.S., 2020 – 2030 |
| Figure 6‑10: Standard Suture Market, U.S., 2020 – 2030 |
| Figure 6‑11: Suture Market by Care Setting, U.S., 2020 – 2030 (US$M) |
| Figure 6‑12: Hospital Suture Market, U.S., 2020 – 2030 |
| Figure 6‑13: Alternate Care Suture Market, U.S., 2020 – 2030 |
| Figure 6‑14: Stapler Market by Device Type, U.S., 2020 – 2030 (US$M) |
| Figure 6‑15: Open Surgery Stapler by Segment Market, U.S., 2020 – 2030 |
| Figure 6‑16: Open Surgery Firing Gun Market, U.S., 2020 – 2030 |
| Figure 6‑17: Open Surgery Cartridge Market, U.S., 2020 – 2030 |
| Figure 6‑18: Laparoscopic Stapler by Segment Market, U.S., 2020 – 2030 |
| Figure 6‑19: Laparoscopic Firing Gun Market, U.S., 2020 – 2030 |
| Figure 6‑20: Laparoscopic Cartridge Market, U.S., 2020 – 2030 |
| Figure 6‑21: Skin Stapler Market, U.S., 2020 – 2030 |
| Figure 6‑22: Stapler Market by Care Setting, U.S., 2020 – 2030 (US$M) |
| Figure 6‑23: Hospital Stapler Market, U.S., 2020 – 2030 |
| Figure 6‑24: Alternate Care Stapler Market, U.S., 2020 – 2030 |
| Figure 6‑25: Ligating Clip Applier Market by Device Type, U.S., 2020 – 2030 (US$M) |
| Figure 6‑26: Open Surgery Ligation by Segment Market, U.S., 2020 – 2030 |
| Figure 6‑27: Open Surgery Multi-Fire Clip Applier Market, U.S., 2020 – 2030 |
| Figure 6‑28: Open Surgery Single-Fire Clip Applier Market, U.S., 2020 – 2030 |
| Figure 6‑29: Laparoscopic Ligation by Segment Market, U.S., 2020 – 2030 |
| Figure 6‑30: Laparoscopic Multi-Fire Clip Applier Market, U.S., 2020 – 2030 |
| Figure 6‑31: Laparoscopic Single-Fire Clip Applier Market, U.S., 2020 – 2030 |
| Figure 6‑32: Ligation Market by Care Setting, U.S., 2020 – 2030 (US$M) |
| Figure 6‑33: Hospital Ligation Market, U.S., 2020 – 2030 |
| Figure 6‑34: Alternate Care Ligation Market, U.S., 2020 – 2030 |
| Figure 6‑35: Skin Closure Strip Market by Care Setting, U.S., 2020 – 2030 (US$M) |
| Figure 6‑36: Total Skin Closure Strip Market, U.S., 2020 – 2030 |
| Figure 6‑37: Hospital Skin Closure Strip Market, U.S., 2020 – 2030 |
| Figure 6‑38: Alternate Care Skin Closure Strip Market, U.S., 2020 – 2030 |
| Figure 6‑39: Total Mesh and Cyanoacrylate-Based Skin Closure System Market, U.S., 2020 – 2030 |
| Figure 6‑40: Total Zip Surgical Skin Closure Market, U.S., 2020 – 2030 |
| Figure 6‑41: Cyanoacrylate-Based Tissue Adhesive Market by Care Setting, U.S., 2020 – 2030 (US$M) |
| Figure 6‑42: Total Cyanoacrylate-Based Tissue Adhesive Market, U.S., 2020 – 2030 |
| Figure 6‑43: Hospital Cyanoacrylate-Based Tissue Adhesive Market, U.S., 2020 – 2030 |
| Figure 6‑44: Alternate Care Cyanoacrylate-Based Tissue Adhesive Market, U.S., 2020 – 2030 |
| Figure 6‑45: Leading Competitors, Wound Closure Market, U.S., 2023 |
| Figure 7‑1: Traditional Wound Dressing Market by Segment, U.S., 2020 – 2030 (US$M) |
| Figure 7‑2: Gauze Market by Care Setting, U.S., 2020 – 2030 (US$M) |
| Figure 7‑3: Total Gauze Market, U.S., 2020 – 2030 |
| Figure 7‑4: Hospital Gauze Market, U.S., 2020 – 2030 |
| Figure 7‑5: Alternate Care Gauze Market, U.S., 2020 – 2030 |
| Figure 7‑6: Tape Market by Care Setting, U.S., 2020 – 2030 (US$M) |
| Figure 7‑7: Total Tape Market, U.S., 2020 – 2030 |
| Figure 7‑8: Hospital Tape Market, U.S., 2020 – 2030 |
| Figure 7‑9: Alternate Care Tape Market, U.S., 2020 – 2030 |
| Figure 7‑10: Bandage Market by Segment, U.S., 2020 – 2030 (US$M) |
| Figure 7‑11: Total Bandage Market, U.S., 2020 – 2030 |
| Figure 7‑12: Hospital Bandage Market, U.S., 2020 – 2030 |
| Figure 7‑13: Alternate Care Bandage Market, U.S., 2020 – 2030 |
| Figure 7‑14: Cotton Market by Segment, U.S., 2020 – 2030 (US$M) |
| Figure 7‑15: Total Cotton Market, U.S., 2020 – 2030 |
| Figure 7‑16: Hospital Cotton Market, U.S., 2020 – 2030 |
| Figure 7‑17: Alternate Care Cotton Market, U.S., 2020 – 2030 |
| Figure 7‑18: Leading Competitors, Traditional Wound Dressing Market, U.S., 2023 |
| Figure 8‑1: Advanced Wound Dressing Market by Segment, U.S., 2020 – 2030 (US$M) |
| Figure 8‑2: Advanced Wound Dressing Market, U.S., 2020 – 2030 |
| Figure 8‑3: Moist Dressing Market, U.S., 2020 – 2030 |
| Figure 8‑4: Antimicrobial Dressing Market, U.S., 2020 – 2030 |
| Figure 8‑5: Interactive Advanced Dressing Market, U.S., 2020 – 2030 |
| Figure 8‑6: Non-Adherent Contact Layer Market, U.S., 2020 – 2030 |
| Figure 8‑7: Leading Competitors, Advanced Wound Dressing Market, U.S., 2023 |
| Figure 9‑1: Moist Dressing Market by Segment, U.S., 2020 – 2030 (US$M) |
| Figure 9‑2: Moist Dressing Market, U.S., 2020 – 2030 |
| Figure 9‑3: Foam Dressing Market, U.S., 2020 – 2030 |
| Figure 9‑4: Transparent Film Dressing Market, U.S., 2020 – 2030 |
| Figure 9‑5: Hydrocolloid Dressing Market, U.S., 2020 – 2030 |
| Figure 9‑6: Alginate Dressing Market, U.S., 2020 – 2030 |
| Figure 9‑7: Gelling Fiber Dressing Market, U.S., 2020 – 2030 |
| Figure 9‑8: Hydrogel Dressing Market, U.S., 2020 – 2030 |
| Figure 9‑9: Moist Dressing Market by Care Setting, U.S., 2020 – 2030 (US$M) |
| Figure 9‑10: Hospital Moist Dressing Market, U.S., 2020 – 2030 |
| Figure 9‑11: Alternate Care Moist Dressing Market, U.S., 2020 – 2030 |
| Figure 9‑12: Leading Competitors, Moist Dressing Market, U.S., 2023 |
| Figure 10‑1: Antimicrobial Dressing Market by Segment, U.S., 2020 – 2030 (US$M) |
| Figure 10‑2: Antimicrobial Dressing Market, U.S., 2020 – 2030 |
| Figure 10‑3: Total Silver Dressing Market, U.S., 2020 – 2030 |
| Figure 10‑4: Hydrogel Dressing Market, U.S., 2020 – 2030 |
| Figure 10‑5: Total Non-Silver Dressing Market, U.S., 2020 – 2030 |
| Figure 10‑6: Antimicrobial Dressing Market by Care Setting, U.S., 2020 – 2030 (US$M) |
| Figure 10‑7: Hospital Antimicrobial Dressing Market, U.S., 2020 – 2030 |
| Figure 10‑8: Alternate Care Antimicrobial Dressing Market, U.S., 2020 – 2030 |
| Figure 10‑9: Leading Competitors, Antimicrobial Dressing Market, U.S., 2023 |
| Figure 11‑1: Interactive Dressing Market by Segment, U.S., 2020 – 2030 (US$M) |
| Figure 11‑2: Interactive Dressing Market, U.S., 2020 – 2030 |
| Figure 11‑3: Collagen Dressing Market, U.S., 2020 – 2030 |
| Figure 11‑4: Skin Substitute Market by Segment, U.S., 2020 – 2030 (US$M) |
| Figure 11‑5: Total Skin Substitute Market, U.S., 2020 – 2030 |
| Figure 11‑6: Particulate Skin Substitute Market, U.S., 2020 – 2030 |
| Figure 11‑7: Sheet Skin Substitute Market, U.S., 2020 – 2030 |
| Figure 11‑8: Other Skin Substitute Market, U.S., 2020 – 2030 |
| Figure 11‑9: Hospital Skin Substitute Market, U.S., 2020 – 2030 |
| Figure 11‑10: Alternate Care Skin Substitute Market, U.S., 2020 – 2030 |
| Figure 11‑11: Leading Competitors, Interactive Dressing Market, U.S., 2023 |
| Figure 12‑1: Non-Adherent Contact Layer Market by Segment, U.S., 2020 – 2030 (US$M) |
| Figure 12‑2: Non-Adherent Contact Layer Market, U.S., 2020 – 2030 |
| Figure 12‑3: Hospital Non-Adherent Contact Layer Market, U.S., 2020 – 2030 |
| Figure 12‑4: Alternate Care Non-Adherent Contact Layer Market, U.S., 2020 – 2030 |
| Figure 12‑5: Leading Competitors, Non-Adherent Contact Layer Market, U.S., 2023 |
| Figure 13‑1: Surgical Hemostat Market by Segment, U.S., 2020 – 2030 (US$M) |
| Figure 13‑2: Surgical Hemostat Market, U.S., 2020 – 2030 |
| Figure 13‑3: Thrombin-Based Hemostat Market, U.S., 2020 – 2030 |
| Figure 13‑4: Oxidized Regenerated Cellulose Hemostat Market, U.S., 2020 – 2030 |
| Figure 13‑5: Gelatin-Based Hemostat Market, U.S., 2020 – 2030 |
| Figure 13‑6: Collagen-Based Hemostat Market, U.S., 2020 – 2030 |
| Figure 13‑7: Combination Hemostat Market, U.S., 2020 – 2030 |
| Figure 13‑8: Polysaccharide-Based Hemostat Market, U.S., 2020 – 2030 |
| Figure 13‑9: First Responder Hemostat Market, U.S., 2020 – 2030 |
| Figure 13‑10: Leading Competitors, Surgical Hemostat Market, U.S., 2023 |
| Figure 14‑1: Tissue Sealant Market by Segment, U.S., 2020 – 2030 (US$M) |
| Figure 14‑2: Tissue Sealant Market, U.S., 2020 – 2030 |
| Figure 14‑3: Fibrin-Based Tissue Sealant Market, U.S., 2020 – 2030 |
| Figure 14‑4: Protein-Based Tissue Sealant Market, U.S., 2020 – 2030 |
| Figure 14‑5: Synthetic Tissue Sealant Market, U.S., 2020 – 2030 |
| Figure 14‑6: Leading Competitors, Tissue Sealant Market, U.S., 2023 |
| Figure 15‑1: Anti-Adhesion Market by Segment, U.S., 2020 – 2030 (US$M) |
| Figure 15‑2: Anti-Adhesion Market, U.S., 2020 – 2030 |
| Figure 15‑3: Gynecological Procedure Market, U.S., 2020 – 2030 |
| Figure 15‑4: Abdominal Procedure Market, U.S., 2020 – 2030 |
| Figure 15‑5: Other Procedures Market, U.S., 2020 – 2030 |
| Figure 15‑6: Leading Competitors, Anti-Adhesion Market, U.S., 2023 |
| Figure 16‑1: Negative Pressure Wound Therapy Market by Segment, U.S., 2020 – 2030 (US$M) |
| Figure 16‑2: Single-Use NPWT Pump Market by Segment, U.S., 2020 – 2030 (US$M) |
| Figure 16‑3: Total Single-Use NPWT Pump Market, U.S., 2020 – 2030 |
| Figure 16‑4: Hospital Single-Use NPWT Pump Market, U.S., 2020 – 2030 |
| Figure 16‑5: Alternate Care Single-Use NPWT Pump Market, U.S., 2020 – 2030 |
| Figure 16‑6: Conventional NPWT Pump Rental Market by Segment, U.S., 2020 – 2030 (US$M) |
| Figure 16‑7: Total Conventional NPWT Pump Rental Market, U.S., 2020 – 2030 |
| Figure 16‑8: Hospital Conventional NPWT Pump Rental Market, U.S., 2020 – 2030 |
| Figure 16‑9: Alternate Care Conventional NPWT Pump Rental Market, U.S., 2020 – 2030 |
| Figure 16‑10: NPWT Dressing Market by Segment, U.S., 2020 – 2030 (US$M) |
| Figure 16‑11: Total NPWT Dressing Market, U.S., 2020 – 2030 |
| Figure 16‑12: Hospital NPWT Dressing Market, U.S., 2020 – 2030 |
| Figure 16‑13: Alternate Care NPWT Dressing Market, U.S., 2020 – 2030 |
| Figure 16‑14: NPWT Canister Market by Segment, U.S., 2020 – 2030 (US$M) |
| Figure 16‑15: Total NPWT Canister Market, U.S., 2020 – 2030 |
| Figure 16‑16: Hospital NPWT Canister Market, U.S., 2020 – 2030 |
| Figure 16‑17: Alternate Care NPWT Canister Market, U.S., 2020 – 2030 |
| Figure 16‑18: Leading Competitors, Negative Pressure Wound Therapy Market, U.S., 2023 |
| Figure 17‑1: Static Compression Therapy Market by Segment, U.S., 2020 – 2030 (US$M) |
| Figure 17‑2: Static Compression Therapy Market, U.S., 2020 – 2030 |
| Figure 17‑3: Graduated Compression Stocking Market by Segment, U.S., 2020 – 2030 (US$M) |
| Figure 17‑4: Total Graduated Compression Stocking Market, U.S., 2020 – 2030 |
| Figure 17‑5: OTC Graduated Compression Stocking Market, U.S., 2020 – 2030 |
| Figure 17‑6: Medical-Grade Graduated Compression Stocking Market, U.S., 2020 – 2030 |
| Figure 17‑7: Anti-Embolism Stocking Market, U.S., 2020 – 2030 |
| Figure 17‑8: Compression Bandage Market by Segment, U.S., 2020 – 2030 (US$M) |
| Figure 17‑9: Total Compression Bandage Market, U.S., 2020 – 2030 |
| Figure 17‑10: Compression Kit Market, U.S., 2020 – 2030 |
| Figure 17‑11: Adhesive Bandage Market, U.S., 2020 – 2030 |
| Figure 17‑12: Cohesive Bandage Market, U.S., 2020 – 2030 |
| Figure 17‑13: Unna Boot Market, U.S., 2020 – 2030 |
| Figure 17‑14: Leading Competitors, Static Compression Therapy Market, U.S., 2023 |
| Figure 18‑1: Dynamic Compression Therapy Market by Segment, U.S., 2020 – 2030 (US$M) |
| Figure 18‑2: Dynamic DVT Prevention Device Market, U.S., 2020 – 2030 |
| Figure 18‑3: Mobile DVT Prevention Device Market, U.S., 2020 – 2030 |
| Figure 18‑4: Pneumatic Compression Device Market by Segment, U.S., 2020 – 2030 (US$M) |
| Figure 18‑5: Sequential Compression Device Market by Segment, U.S., 2020 – 2030 |
| Figure 18‑6: Sequential Compression Pump Market, U.S., 2020 – 2030 |
| Figure 18‑7: Sequential Compression Sleeve Market, U.S., 2020 – 2030 |
| Figure 18‑8: Sequential Compression Sleeve Market Unit Analysis, U.S., 2020 – 2030 |
| Figure 18‑9: Calibrated Sequential Compression Device Market by Segment, U.S., 2020 – 2030 |
| Figure 18‑10: Calibrated Sequential Compression Pump Market, U.S., 2020 – 2030 |
| Figure 18‑11: Calibrated Sequential Compression Sleeve Market, U.S., 2020 – 2030 |
| Figure 18‑12: Leading Competitors, Dynamic Compression Therapy Market, U.S., 2023 |