
Product Description
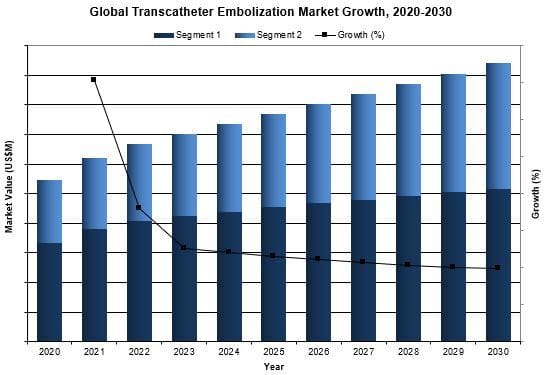
Overall, the global transcatheter embolization market was valued at $1.4 billion in 2023. This is expected to increase over the forecast period at a CAGR of 4.3% to reach almost $1.9 billion.
Throughout this medical market research, we analyzed over 15 transcatheter embolization companies across 7 continents and used our comprehensive methodology to understand the market sizes, unit sales, company market shares, and to create accurate forecasts. The full report suite on the global market for transcatheter embolization extends its projections up to the year 2030, thereby providing a comprehensive and anticipatory understanding of the market trends and trajectories for the given period.
DATA TYPES INCLUDED
- Unit Sales, Average Selling Prices, Market Value & Growth Trends
- Forecasts Until 2030, and Historical Data to 2020
- Market Drivers & Limiters for Each Segment
- Competitive Analysis with Market Shares for Each Segment
- Recent Mergers & Acquisitions
- COVID19 Impact
- Disease Overviews and Demographic Information
- Company Profiles, Product Portfolios and SWOT for Top Competitors
Global Transcatheter Embolization Market Insights
A rising trend in the transcatheter embolization market involves increased use of advanced embolic materials and techniques. Physicians are opting for next-gen embolic agents like microspheres and liquid embolics, offering improved precision, efficacy, and shorter procedural times compared to traditional methods. These materials enhance control, enable minimally invasive treatments for various conditions beyond oncology, and contribute to better patient outcomes.
Global Transcatheter Embolization Market Share Insights

- After acquiring BTG, Boston Scientific expanded its portfolio by retaining Contour® PVA Embolization Particles and adding TheraSpheres® and DC-Beads® to enter the drug-eluting and radioactive particle segments. By 2023, Boston Scientific, a key player in the coil embolic market, competes notably with Cook Medical. Their VortX® 18 and 35 Vascular Occlusion Coils, contribute to their leading position, along with the Interlock-35™ Fibered IDC™ Occlusion System.
- Medtronic provides the Concerto™ detachable coil system and the Onyx® Liquid Embolic System. The Onyx® system utilizes a polymer dissolved in dimethyl sulfoxide, solidifying upon injection to create an occlusion. This system is available in two formulations, Onyx® 18 and Onyx® 34.
- Sirtex Medical dominates the radioactive particle market, securing a significant share. Receiving reimbursement approval for SIRSpheres® in France and selective internal radiation therapy in the UK, Sirtex achieved a milestone of delivering 100,000 patient doses for SIRSpheres® in June 2019.
Market Segmentation Summary
- Particle Embolization Market
- Coil Embolization Market
Global Research Scope Summary
| Report Attribute | Details |
|---|---|
| Regions | North America (Canada, United States) Latin America (Argentina, Brazil, Chile, Colombia, Mexico, Peru, Venezuela) Western Europe (Austria, Benelux, France, Germany, Italy, Portugal, Scandinavia, Spain, Switzerland, U.K.) Central & Eastern Europe (Baltic States, Bulgaria, Croatia, Czech Republic, Greece, Hungary, Kazakhstan, Poland, Romania, Russia, Turkey, Ukraine) Middle East (Bahrain, Iran, Israel, Kuwait, Oman, Qatar, Saudi Arabia, United Arab Emirates) Asia Pacific (Australia, Cambodia, China, Hong Kong, India, Indonesia, Japan, Malaysia, Myanmar, New Zealand, Philippines, Singapore, South Korea, Taiwan, Thailand, Vietnam) Africa (Algeria, Egypt, Ghana, Kenya, Libya, Morocco, Nigeria, South Africa, Sudan, Uganda) |
| Base Year | 2023 |
| Forecast | 2024-2030 |
| Historical Data | 2020-2023 |
| Quantitative Coverage | Market Size, Market Shares, Market Forecasts, Market Growth Rates, Units Sold, and Average Selling Prices. |
| Qualitative Coverage | COVID19 Impact, Market Growth Trends, Market Limiters, Competitive Analysis & SWOT for Top Competitors, Mergers & Acquisitions, Company Profiles, Product Portfolios, FDA Recalls, Disruptive Technologies, Disease Overviews. |
| Data Sources | Primary Interviews with Industry Leaders, Government Physician Data, Regulatory Data, Hospital Private Data, Import & Export Data, iData Research Internal Database. |
CONTACT US FOR ADDITIONAL INFORMATION
For full segmentation and any questions regarding research coverage, please contact us for a complimentary demo of the full report.