| List of Figures |
| Figure 1‑1: Peripheral Vascular Device Market Share Ranking by Segment, Europe, 2022 (1 of 4) |
5 |
| Figure 1‑2: Peripheral Vascular Device Market Share Ranking by Segment, Europe, 2022 (2 of 4) |
5 |
| Figure 1‑3: Peripheral Vascular Device Market Share Ranking by Segment, Europe, 2022 (3 of 4) |
5 |
| Figure 1‑4: Peripheral Vascular Device Market Share Ranking by Segment, Europe, 2022 (4 of 4) |
6 |
| Figure 1‑5: Companies Researched in This Report |
7 |
| Figure 1‑6: Factors Impacting the Peripheral Market by Segment, Europe (1 of 4) |
8 |
| Figure 1‑7: Factors Impacting the peripheral Market by Segment, Europe (2 of 4) |
9 |
| Figure 1‑8: Factors Impacting the peripheral Market by Segment, Europe (3 of 4) |
10 |
| Figure 1‑9: Factors Impacting the peripheral Market by Segment, Europe (4 of 4) |
11 |
| Figure 1‑10: Recent Events in the Peripheral Vascular Device Market, Europe, 2019 – 2023 |
12 |
| Figure 1‑11: Peripheral Vascular Device Procedures Covered, Europe (1 of 3) |
13 |
| Figure 1‑12: Peripheral Vascular Device Procedures Covered, Europe (2 of 3) |
14 |
| Figure 1‑13: Peripheral Vascular Device Procedures Covered, Europe (3 of 3) |
15 |
| Figure 1‑14: Peripheral Vascular Device Markets Covered, Europe (1 of 3) |
16 |
| Figure 1‑15: Peripheral Vascular Device Markets Covered, Europe (2 of 3) |
17 |
| Figure 1‑16: Peripheral Vascular Device Markets Covered, Europe (3 of 3) |
18 |
| Figure 1‑17: Key Report Updates |
19 |
| Figure 1‑18: Version History |
20 |
| Figure 2‑1: Peripheral Vascular Device Market by Segment, Worst Case Scenario, Europe, 2019 – 2029 (€M) (1 of 2) |
38 |
| Figure 2‑2: Peripheral Vascular Device Market by Segment, Worst Case Scenario, Europe, 2019 – 2029 (€M) (2 of 2) |
39 |
| Figure 2‑3: Peripheral Vascular Device Market by Segment, Base Case Scenario, Europe, 2019 – 2029 (€M) (1 of 2) |
40 |
| Figure 2‑4: Peripheral Vascular Device Market by Segment, Base Case Scenario, Europe, 2019 – 2029 (€M) (2 of 2) |
41 |
| Figure 2‑5: Peripheral Vascular Device Market by Segment, Best Case Scenario, Europe, 2019 – 2029 (€M) (1 of 2) |
42 |
| Figure 2‑6: Peripheral Vascular Device Market by Segment, Best Case Scenario, Europe, 2019 – 2029 (€M) (2 of 2) |
43 |
| Figure 4‑1: Peripheral Vascular Stent by Company (1 of 2) |
58 |
| Figure 4‑2: Peripheral Vascular Stent by Company (2 of 2) |
59 |
| Figure 4‑3: PTA Balloon Catheter by Company (1 of 3) |
60 |
| Figure 4‑4: PTA Balloon Catheter by Company (2 of 3) |
61 |
| Figure 4‑5: PTA Balloon Catheter by Company (3 of 3) |
62 |
| Figure 4‑6: Drug-Coated Balloon by Company |
64 |
| Figure 4‑7: Atherectomy Device by Company (1 of 2) |
65 |
| Figure 4‑8: Atherectomy Device by Company (2 of 2) |
66 |
| Figure 4‑9: Lithotripsy Device by Company |
67 |
| Figure 4‑10: Chronic Total Occlusion Device by Company |
69 |
| Figure 4‑11: Surgical Graft by Company (1 of 2) |
70 |
| Figure 4‑12: Surgical Graft by Company (2 of 2) |
71 |
| Figure 4‑13: Stent Graft by Company |
72 |
| Figure 4‑14: Embolic Protection Device by Company |
73 |
| Figure 4‑15: Peripheral Thrombus Management by Company |
76 |
| Figure 4‑16: Inferior Vena Cava Filter & Retrieval Device by Company (1 of 2) |
77 |
| Figure 4‑17: Inferior Vena Cava Filter & Retrieval Device by Company (2 of 2) |
78 |
| Figure 4‑18: Carotid Shunt by Company |
79 |
| Figure 4‑19: Diagnostic and Interventional Catheters by Company (1 of 2) |
81 |
| Figure 4‑20: Diagnostic and Interventional Catheters by Company (2 of 2) |
82 |
| Figure 4‑21: Diagnostic and Interventional Guidewire by Company (1 of 3) |
83 |
| Figure 4‑22: Diagnostic and Interventional Guidewire by Company (2 of 3) |
84 |
| Figure 4‑23: Diagnostic and Interventional Guidewire by Company (3 of 3) |
85 |
| Figure 4‑24: Introducer Sheath by Company (1 of 2) |
87 |
| Figure 4‑25: Introducer Sheath by Company (2 of 2) |
88 |
| Figure 4‑26: Vascular Closure Device by Company |
90 |
| Figure 4‑27: Transcatheter Embolization Devices by Company (1 of 2) |
92 |
| Figure 4‑28: Transcatheter Embolization Devices by Company (2 of 2) |
93 |
| Figure 4‑29: Peripheral IVUS Catheter by Company |
94 |
| Figure 4‑30: Class 2 Device Recall VENOVO Venous Stent System |
95 |
| Figure 4‑31: Class 1 Device Recall VICI VENOUS STENT System |
95 |
| Figure 4‑32: Class 2 Device Recall ELUVIA |
95 |
| Figure 4‑33: Class 2 Device Recall PALMAZ GENESIS |
96 |
| Figure 4‑34: Class 2 Device Recall S.M.A.R.T. Flex |
96 |
| Figure 4‑35: Class 1 Device Recall PRECISE PRO RX CAROTID STENT Implant System |
96 |
| Figure 4‑36: Class 2 Device Recall Cordis S.M.A.R.T. CONTROL /S.M.A.R.T. Vascular Stent System |
96 |
| Figure 4‑37: Class 2 Device Recall S.M.A.R.T. Nitinol Stent System and the S.M.A.R.T. Control Nitinol Stent System |
97 |
| Figure 4‑38: Class 2 Device Recall Cordis Precise Nitinol Stent System |
97 |
| Figure 4‑39: Class 2 Device Recall Formula 418 Renal BalloonExpandable Stent |
97 |
| Figure 4‑40: Class 2 Device Recall Zilver 635 Biliary Stent |
97 |
| Figure 4‑41: Class 2 Device Recall Zilver 518 Biliary Stent |
98 |
| Figure 4‑42: Class 1 Device Recall Atrium |
98 |
| Figure 4‑43: Class 2 Device Recall Everflex Selfexpanding Peripheral Stent |
98 |
| Figure 4‑44: Class 2 Device Recall Medtronic Abre |
98 |
| Figure 4‑45: Class 2 Device Recall Medtronic Abre Venous Selfexpanding Sent System |
99 |
| Figure 4‑46: Class 2 Device Recall ENROUTE Transcarotid Stent System |
99 |
| Figure 4‑47: Class 2 Device Recall GORE VIABAHN VBX, BALLOON EXPANDABLE ENDOPROSTHESIS |
99 |
| Figure 4‑48: Class 2 Device Recall Conquest PTA Balloon Dilatation Catheter |
100 |
| Figure 4‑49: Class 2 Device Recall Conquest 40 PTA Dilatation Catheter |
100 |
| Figure 4‑50: Class 2 Device Recall Cordis SABER PTA Balloon Dilation Catheter |
100 |
| Figure 4‑51: Class 2 Device Recall Cordis POWERFLEX P3, PTA Dilation Catheter |
101 |
| Figure 4‑52: Class 2 Device Recall Cordis MAXI LD PTA Dilatation Catheter |
101 |
| Figure 4‑53: Class 2 Device Recall POWERFLEX PRO Percutaneous Transluminal Angioplasty (PTA) Catheter |
101 |
| Figure 4‑54: Class 1 Device Recall ADVANCE ENFORCER 35 FOCAL FORCE PTA BALLOON CATHETER |
101 |
| Figure 4‑55: Class 2 Device Recall Medtronic IN.PACT Admiral, Paclitaxelcoated PTA Balloon Catheter |
102 |
| Figure 4‑56: Class 2 Device Recall Chameleon PTA Balloon Dilation Catheter |
102 |
| Figure 4‑57: Class 2 Device Recall Boston Scientific ROTAPRO |
103 |
| Figure 4‑58: Class 2 Device Recall STEALTH 360 GEN2 PERIPHERAL ORBITAL ATHERECTOMY SYSTEM |
103 |
| Figure 4‑59: Class 2 Device Recall DIAMONDBACK 360 GEN2 PERIPHERAL ORBITAL ATHERECTOMY SYSTEM |
103 |
| Figure 4‑60: Class 1 Device Recall TurboHawk Plus |
103 |
| Figure 4‑61: Class 1 Device Recall HawkOne |
104 |
| Figure 4‑62: Class 2 Device Recall Shockwave Medical Peripheral Intravascular Lithotripsy (IVL) System |
105 |
| Figure 4‑63: Class 1 Device Recall IntraClude IntraAortic Occlusion Device |
106 |
| Figure 4‑64: Class 2 Device Recall Intergard Woven Vascular Graft |
107 |
| Figure 4‑65: Class 2 Device Recall Interavascular SAS/Getinge |
107 |
| Figure 4‑66: Class 2 Device Recall Hemashield Gold Knitted Bifurcated |
107 |
| Figure 4‑67: Class 2 Device Recall Atrium ADVANTA VXT Vascular Graft |
107 |
| Figure 4‑68: Class 2 Device Recall HEMASHIELD MICROVEL Double Velour Knitted Vascular Grafts |
108 |
| Figure 4‑69: Class 2 Device Recall HEMASHIELD PLATINUM WOVEN/MICROVEL DOUBLE VELOUR VASCULAR GRAFTS |
108 |
| Figure 4‑70: Class 2 Device Recall HEMASHIELD PLATINUM Woven Double Velour Vascular Graft |
108 |
| Figure 4‑71: Class 2 Device Recall VASCUTEK/TERUMO |
109 |
| Figure 4‑72: Class 2 Device Recall Gore Propaten Vascular Graft |
109 |
| Figure 4‑73: Class 1 Device Recall ENDOLOGIX AFX2 Bifurcated Endograft System |
110 |
| Figure 4‑74: Class 1 Device Recall ENDOLOGIX AFX/AFX2, Proximal (Aortic) Extension Endograft |
110 |
| Figure 4‑75: Class 1 Device Recall ENDOLOGIX AFX Endovascular AAA System |
110 |
| Figure 4‑76: Class 1 Device Recall ENDOLOGIX AFX/AFX2, Limb (Iliac) Extension Endograft |
110 |
| Figure 4‑77: Class 2 Device Recall Zenith Alpha Abdominal Endovascular Graft |
111 |
| Figure 4‑78: Class 2 Device Recall Zenith Alpha Abdominal Endovascular Graft |
111 |
| Figure 4‑79: Class 2 Device Recall Zenith Alpha SpiralZ Endovascular Leg |
111 |
| Figure 4‑80: Class 2 Device Recall Zenith Alpha Abdominal Endovascular Graft |
111 |
| Figure 4‑81: Class 2 Device Recall Endurant, Endurant II and Endurant IIs Stent Graft Systems |
112 |
| Figure 4‑82: Class 2 Device Recall Endurant Stent Graft System |
112 |
| Figure 4‑83: Class 2 Device Recall Endurant II Stent Graft System |
112 |
| Figure 4‑84: Class 2 Device Recall Endurant II/IIs Stent Graft System |
112 |
| Figure 4‑85: Class 2 Device Recall Endurant II/IIs Stent Graft System |
113 |
| Figure 4‑86: Class 1 Device Recall Valiant Navion Thoracic Stent Graft System |
113 |
| Figure 4‑87: Class 2 Device Recall EKOS |
114 |
| Figure 4‑88: Class 2 Device Recall EkoSonic Endovascular Device |
114 |
| Figure 4‑89: Class 2 Device Recall EKOS Control System |
114 |
| Figure 4‑90: Class 2 Device Recall AngioJet Ultra Consoles Thrombectomy System |
114 |
| Figure 4‑91: Class 1 Device Recall ArrowTrerotola PTD |
115 |
| Figure 4‑92: Class 1 Device Recall ArrowTrerotola Percutaneous Thrombolytic Device |
115 |
| Figure 4‑93: Class 1 Device Recall ArrowTrerotola OverTheWire PTD Kit Percutaneous Thrombolytic Device: 7FR |
115 |
| Figure 4‑94: Device Recall AngioJet Ultra 5000 A Console, Boston Scientific |
116 |
| Figure 4‑95: Class 3 Device Recall Cook |
117 |
| Figure 4‑96: Class 3 Device Recall Cook Celect Platinum Vena Cava Filter Set |
117 |
| Figure 4‑97: Class 2 Device Recall SoftVu Omni Flush Angiographic Catheter |
118 |
| Figure 4‑98: Class 2 Device Recall SEEKER(R) Crossing Support Catheter |
118 |
| Figure 4‑99: Class 1 Device Recall Imager II 5F Angiographic Catheter |
118 |
| Figure 4‑100: Class 1 Device Recall SUPER TORQUE MB 5F PIG |
118 |
| Figure 4‑101: Class 1 Device Recall CrossCath Support Catheter |
119 |
| Figure 4‑102: Class 2 Device Recall Torcon NB Advantage |
119 |
| Figure 4‑103: Class 2 Device Recall Amplatz extra Stiff Wire Guide |
120 |
| Figure 4‑104: Class 2 Device Recall Bentson Wire Guide |
120 |
| Figure 4‑105: Class 2 Device Recall Cope Mandril Wire Guide |
120 |
| Figure 4‑106: Class 2 Device Recall Cope Mandril Wire Guide (Nitinol) |
120 |
| Figure 4‑107: Class 2 Device Recall Coons Interventional Wire Guide |
121 |
| Figure 4‑108: Class 2 Device Recall Lunderquist Ring Torque Wire Guide |
121 |
| Figure 4‑109: Class 2 Device Recall Newton Wire Guide |
121 |
| Figure 4‑110: Class 2 Device Recall Roadrunner PC Hydrophilic Wire Guide |
121 |
| Figure 4‑111: Class 2 Device Recall Roadrunner PC Wire Guide (Nimble Floppy) |
122 |
| Figure 4‑112: Class 2 Device Recall Roadrunner PC Wire Guide (The Firm) |
122 |
| Figure 4‑113: Class 2 Device Recall Cook Roadrunner UniGlide Hydrophilic Wire Guide |
122 |
| Figure 4‑114: Class 2 Device Recall Cook Roadrunner PC Wire Guide |
123 |
| Figure 4‑115: Class 2 Device Recall Roadrunner Hydrophilic PC Wire Guide |
123 |
| Figure 4‑116: Class 2 Device Recall Zurpaz(TM) MEDIUM CURL, ASYMMETRIC CURVE, Steerable Sheath |
124 |
| Figure 4‑117: Class 2 Device Recall Ultimum HEMOSTASIS INTRODUCER |
124 |
| Figure 4‑118: Class 2 Device Recall FastCath Trio HEMOSTASIS INTRODUCER |
124 |
| Figure 4‑119: Class 2 Device Recall FastCath Hemostasis Introducer, HEMOSTASIS INTRODUCER |
124 |
| Figure 4‑120: Class 2 Device Recall Avanti Catheter Sheath Introducer |
125 |
| Figure 4‑121: Class 2 Device Recall |
125 |
| Figure 4‑122: Class 2 Device Recall Flexor CheckFlo Introducer |
125 |
| Figure 4‑123: Class 1 Device Recall Flexor CheckFlo Introducer |
126 |
| Figure 4‑124: Class 2 Device Recall Hilal Embolization Microcoil |
127 |
| Figure 4‑125: Class 2 Device Recall Nester Embolization Microcoil |
127 |
| Figure 4‑126: Class 2 Device Recall Tornado Embolization Microcoil |
127 |
| Figure 4‑127: Class 2 Device Recall Terumo AZUR Peripheral Coil System, Detachable 18 |
127 |
| Figure 4‑128: Class 2 Device Recall Terumo AZUR CX Peripheral Coil System, Detachable 35, CX Coil |
128 |
| Figure 4‑129: Class 2 Device Recall Terumo AZUR CX Peripheral Coil System, Detachable 18, CX Coil |
128 |
| Figure 4‑130: Class 2 Device Recall OptiCross 35 15 MHz Peripheral Imaging Catheter |
129 |
| Figure 4‑131: Peripheral Venous Stent System in the Treatment of Iliac Vein Stenosis or Occlusion |
131 |
| Figure 4‑132: Belgian Trial Investigating the LifeStream Stent in Complex TASC C and D Iliac Lesions (BELSTREAM) |
131 |
| Figure 4‑133: Paclitaxel-coated Peripheral Stents Used in the Treatment of Femoropopliteal Stenoses (XPEDITE) |
132 |
| Figure 4‑134: An All-Comers Observational Study of the MicroStent™ Peripheral Vascular Stent System in Subjects With Peripheral Arterial Disease (HEAL) |
132 |
| Figure 4‑135: SOLARIS Peripheral PMCF Trial |
132 |
| Figure 4‑136: A Superiority Trial of the SUPERA Peripheral Stent System in Patients With Femoro-popliteal Artery Disease |
133 |
| Figure 4‑137: Evaluation of Safety and Efficacy of the S.M.A.R.T. RADIANZ™ Vascular Stent System in the Treatment of Iliac and Femoropopliteal Lesions Via Transradial Access (RADIANCY) |
133 |
| Figure 4‑138: Stella Supera Siberia |
134 |
| Figure 4‑139: A Real World Evaluation of the ELUVIA Stent in Subjects With Lesions Located in the Femoropopliteal Arteries (REGAL) |
134 |
| Figure 4‑140: Zilver® PTX® V Clinical Study |
135 |
| Figure 4‑141: In-Stent Restenosis Post-Approval Study |
135 |
| Figure 4‑142: BARD® The VENOVO™ Venous Stent Study for Treatment of Iliofemoral Occlusive Disease (VERNACULAR) |
136 |
| Figure 4‑143: VIVO Clinical Study |
137 |
| Figure 4‑144: ULTRASCORE™ Focused Force PTA Balloon Angioplasty for CLI Patients With Below the Knee Vessel Disease |
138 |
| Figure 4‑145: Real World Registry Assessing the Clinical Use of the Bard UltraScore Forced Focus PTA Balloon |
138 |
| Figure 4‑146: Ranger™ and Ranger™ SL (OTW) DCB in China |
139 |
| Figure 4‑147: The VaSecure BTK Study |
139 |
| Figure 4‑148: Comparison of the Ranger™ Paclitaxel-Coated PTA Balloon Catheter and Uncoated PTA Balloons in Femoropopliteal Arteries (RANGER-SFA) |
140 |
| Figure 4‑149: A Trial to Evaluate the Safety and Efficacy of the Passeo-18 Lux Drug-coated Balloon of Biotronik in the Treatment of the Femoropopliteal Artery Compared to the Medtronic IN.PACT Admiral Drug-coated Balloon. (BIOPACT-RCT) |
141 |
| Figure 4‑150: Safety and Efficacy of the SurVeil™ Drug-Coated Balloon (TRANSCEND) |
141 |
| Figure 4‑151: RANGER™ Paclitaxel Coated Balloon vs Standard Balloon Angioplasty (RANGER II SFA) |
142 |
| Figure 4‑152: IN.PACT BTK Randomized Study to Assess Safety and Efficacy of IN.PACT 014 vs. PTA |
142 |
| Figure 4‑153: Compare I Pilot Study for the Treatment of Subjects With Symptomatic Femoropopliteal Artery Disease |
143 |
| Figure 4‑154: ILLUMENATE Below-The-Knee (BTK) Arteries: a Post Market Clinical Study (BTK PMS) |
143 |
| Figure 4‑155: IN.PACT Global Clinical Study |
144 |
| Figure 4‑156: ILLUMENATE Pivotal Post-Approval Study (PAS) |
144 |
| Figure 4‑157: BIOLUX P-III BENELUX All-Comers Registry |
144 |
| Figure 4‑158: Real-World Registry Assessing the Clinical Use of the Lutonix 035 Drug Coated Balloon Catheter (SAFE-DCB) |
145 |
| Figure 4‑159: Safety and Effectiveness Evaluation of Peripheral Orbital Atherectomy (KAIZEN) |
146 |
| Figure 4‑160: Jetstream in Treatment of Occlusive Atherosclerotic Lesions in the SFA and/or PPA |
146 |
| Figure 4‑161: Revascularization of Total or Sub-total Occluded Peripheral Arteries With ByCross® Device. Post Market Clinical Follow-up |
147 |
| Figure 4‑162: Post-Market Registry of AURYON™ Atherectomy Device in Subjects Affected With Infrainguinal Peripheral Artery Disease (PATHFINDER-I) |
147 |
| Figure 4‑163: JET-RANGER Trial - JETStream Atherectomy With Adjunctive Paclitaxel-Coated Balloon Angioplasty vs Plain Old Balloon Angioplasty Followed by Paclitaxel-Coated Balloon |
148 |
| Figure 4‑164: Pantheris Atherectomy Treatment of In-Stent Restenosis in Lower Extremity Arteries (INSIGHT) |
148 |
| Figure 4‑165: Safety and Effectiveness Study of Eximo's B-Laser™ Atherectomy Device for PAD Treatment |
149 |
| Figure 4‑166: Safety and Effectiveness of Jetstream Atherectomy System (J-SUPREME II) |
149 |
| Figure 4‑167: DiRectional AthErectomy + Drug CoAted BaLloon to Treat Long, CalcifIed FemoropopliTeal ArterY Lesions (REALITY) |
150 |
| Figure 4‑168: Mini S Feasibility Study With Shockwave Medical Mini S Peripheral IVL System |
151 |
| Figure 4‑169: SOLUTION Trial in China |
151 |
| Figure 4‑170: Disrupt PAD+ Study With the Shockwave Medical M5+ Peripheral IVL System (Disrupt PAD+) |
152 |
| Figure 4‑171: Shockwave Medical Peripheral Lithoplasty System Study for PAD (Disrupt PAD III) |
152 |
| Figure 4‑172: A Prospective and Retrospective, Multi-Centre, Post-Market, Non-Interventional Study of Terumo Aortic Knitted and Woven Grafts, and Cardiovascular Patches (PANTHER) |
153 |
| Figure 4‑173: Retrospective Post-Market Clinical Follow-Up Study of GORE-TEX® Vascular Grafts and GORE® PROPATEN® Vascular Graft in Peripheral Artery Disease, Aortic Aneurysms, and Dialysis Access |
153 |
| Figure 4‑174: Ankura™ TAA Stent Graft System Post-Market Clinical Follow-up Study |
154 |
| Figure 4‑175: Post-Approval Study of the TREO Abdominal Stent-Graft System (TREO PAS) |
154 |
| Figure 4‑176: The Merit WRAPSODY™ Endovascular Stent Graft for Treatment of Iliac Artery Occlusive Disease |
155 |
| Figure 4‑177: Zenith Alpha™ Abdominal Endovascular Graft |
155 |
| Figure 4‑178: Fenestrated AAA Endovascular Graft Post-Approval Study |
156 |
| Figure 4‑179: transShield Embolic Protection System Feasibility Study |
157 |
| Figure 4‑180: Study of the Long-Term Safety and Outcomes of Treating Pulmonary Embolism With the Indigo Aspiration System |
158 |
| Figure 4‑181: Preservation of Venous Valvular Function After PMT for Acute DVT (PREFER) |
158 |
| Figure 4‑182: A Study of Patients With Lower Extremity Acute Limb Ischemia to Remove Thrombus With the Indigo Aspiration System (STRIDE) |
159 |
| Figure 4‑183: FlowTriever All-Comer Registry for Patient Safety and Hemodynamics (FLASH) |
159 |
| Figure 4‑184: JETi Peripheral Thrombectomy Registry (JETi) |
160 |
| Figure 4‑185: Treatment of Low-Risk Submassive Pulmonary Embolism With FlowTriever |
160 |
| Figure 4‑186: Forceps vs. Snare IVC Filter Removal |
161 |
| Figure 4‑187: Predictors of Attempted Inferior Vena Cava Filters Retrieval |
161 |
| Figure 4‑188: Retrievability and Incidence of Complex Retrieval in Celect Versus Denali Filter |
162 |
| Figure 4‑189: Cook IVC Filter Study (CIVC) |
162 |
| Figure 4‑190: Predicting the Safety and Effectiveness of Inferior Vena Cava Filters (PRESERVE) |
163 |
| Figure 4‑191: Evaluation of Safety and Efficacy of the Mynx Control Venous Vascular Closure Device 6F-12F vs Manual Compression (ReliaSeal) |
164 |
| Figure 4‑192: AbsorbaSeal (ABS 5.6.7) Vascular Closure Device Trial |
164 |
| Figure 4‑193: Vascular Closure Device in Transcatheter Aortic Valve Replacement |
165 |
| Figure 4‑195: Study to Evaluate the Safety and Effectiveness of MynxGrip Vascular Closure Device (PANDA) |
166 |
| Figure 4‑196: (HALT) Embrace Hydrogel Embolic System (HES) Study of Embolization in Peripheral Arterial Bleeds |
167 |
| Figure 4‑197: Microvascular Plug (MVP) for the Treatment of Pulmonary ArterioVenous Malformations (PAVMs) |
167 |
| Figure 4‑198: Use of Interlocking Detachable Coils System in Embolization of Peripheral Arterial Embolization |
168 |
| Figure 4‑199: CATERPILLAR™ Arterial Embolization Device Study (CHRYSALIS) |
168 |
| Figure 4‑200: LC Bead LUMI for Prostatic Artery Embolization |
169 |
| Figure 5‑1: Currency Exchange Rate, 2022 |
172 |
| Figure 5‑2: Peripheral Vascular Device Market by Segment, Europe, 2019 – 2029 (€M) (1 of 3) |
175 |
| Figure 5‑3: Peripheral Vascular Device Market by Segment, Europe, 2019 – 2029 (€M) (2 of 3) |
176 |
| Figure 5‑4: Peripheral Vascular Device Market by Segment, Europe, 2019 – 2029 (€M) (3 of 3) |
177 |
| Figure 5‑5: Peripheral Vascular Device Market by Segment, Europe, 2019 – 2029 (US$M) (1 of 3) |
178 |
| Figure 5‑6: Peripheral Vascular Device Market by Segment, Europe, 2019 – 2029 (US$M) (2 of 3) |
179 |
| Figure 5‑7: Peripheral Vascular Device Market by Segment, Europe, 2019 – 2029 (US$M) (3 of 3) |
180 |
| Figure 5‑8: Leading Competitors, Peripheral Vascular Device Market, Europe, 2022 (1 of 4) |
191 |
| Figure 5‑9: Leading Competitors, Peripheral Vascular Device Market, Europe, 2022 (2 of 4) |
192 |
| Figure 5‑10: Leading Competitors, Peripheral Vascular Device Market, Europe, 2022 (3 of 4) |
193 |
| Figure 5‑11: Leading Competitors, Peripheral Vascular Device Market, Europe, 2022 (4 of 4) |
194 |
| Figure 5‑12: SWOT Analysis, Abbott (1 of 2) |
213 |
| Figure 5‑13: SWOT Analysis, Abbott (2 of 2) |
214 |
| Figure 5‑14: SWOT Analysis, Becton Dickinson (1 of 2) |
215 |
| Figure 5‑15: SWOT Analysis, Becton Dickinson (2 of 2) |
216 |
| Figure 5‑16: SWOT Analysis, Boston Scientific |
217 |
| Figure 5‑17: SWOT Analysis, Cardinal Health |
218 |
| Figure 5‑18: SWOT Analysis, Cardiovascular Systems, Inc. |
219 |
| Figure 5‑19: SWOT Analysis, Cook Medical |
220 |
| Figure 5‑20: SWOT Analysis, Medtronic |
221 |
| Figure 5‑21: SWOT Analysis, Penumbra |
222 |
| Figure 5‑22: SWOT Analysis, Philips |
223 |
| Figure 5‑23: SWOT Analysis, Shockwave Medical |
224 |
| Figure 5‑24: SWOT Analysis, Silk Road Medical |
225 |
| Figure 5‑25: SWOT Analysis, Terumo (1 of 2) |
226 |
| Figure 5‑26: SWOT Analysis, Terumo (2 of 2) |
227 |
| Figure 5‑27: SWOT Analysis, W.L. Gore |
228 |
| Figure 7‑1: Peripheral Vascular Device Procedures by Segment, Europe, 2019 – 2029 (1 of 3) |
242 |
| Figure 7‑2: Peripheral Vascular Device Procedures by Segment, Europe, 2019 – 2029 (2 of 3) |
243 |
| Figure 7‑3: Peripheral Vascular Device Procedures by Segment, Europe, 2019 – 2029 (3 of 3) |
244 |
| Figure 7‑4: Peripheral Vascular Stent Procedures by Country, Europe, 2019 – 2029 |
247 |
| Figure 7‑5: Arterial Stent Procedures by Device Type, Europe, 2019 – 2029 |
248 |
| Figure 7‑6: Arterial Stent Procedures by Country, Europe, 2019 – 2029 |
249 |
| Figure 7‑7: Bare-Metal Stent Procedures by Indication, Europe, 2019 – 2029 |
250 |
| Figure 7‑8: Bare-Metal Stent Procedures by Country, Europe, 2019 – 2029 |
251 |
| Figure 7‑9: Bare-Metal Carotid Stent Procedures by Country, Europe, 2019 – 2029 |
252 |
| Figure 7‑10: Bare-Metal Iliac Stent Procedures by Country, Europe, 2019 – 2029 |
253 |
| Figure 7‑11: Bare-Metal Renal Stent Procedures by Country, Europe, 2019 – 2029 |
254 |
| Figure 7‑12: Bare-Metal Fem-Pop Stent Procedures by Country, Europe, 2019 – 2029 |
255 |
| Figure 7‑13: Bare-Metal Infra-Pop Stent Procedures by Country, Europe, 2019 – 2029 |
256 |
| Figure 7‑14: Covered Stent Procedures by Indication, Europe, 2019 – 2029 |
257 |
| Figure 7‑15: Covered Stent Procedures by Country, Europe, 2019 – 2029 |
258 |
| Figure 7‑16: Iliac Covered Stent Procedures by Country, Europe, 2019 – 2029 |
259 |
| Figure 7‑17: Fem-Pop Covered Stent Procedures by Country, Europe, 2019 – 2029 |
260 |
| Figure 7‑18: AV Access Covered Stent Procedures by Country, Europe, 2019 – 2029 |
261 |
| Figure 7‑19: Drug-Eluting Stent Procedures by Indication, Europe, 2019 – 2029 |
262 |
| Figure 7‑20: Drug-Eluting Stent Procedures by Country, Europe, 2019 – 2029 |
263 |
| Figure 7‑21: SFA Drug-Eluting Stent Procedures by Country, Europe, 2019 – 2029 |
264 |
| Figure 7‑22: Infra-Pop Drug-Eluting Stent Procedures by Country, Europe, 2019 – 2029 |
265 |
| Figure 7‑23: Venous Stent Procedures by Country, Europe, 2019 – 2029 |
267 |
| Figure 7‑24: PTA Balloon Catheter Procedures by Country, Europe, 2019 – 2029 |
269 |
| Figure 7‑25: Drug-Coated Balloon Procedures by Country, Europe, 2019 – 2029 |
271 |
| Figure 7‑26: Atherectomy Device Procedures by Device Type, Europe, 2019 – 2029 |
272 |
| Figure 7‑27: Atherectomy Device Procedures by Country, Europe, 2019 – 2029 |
273 |
| Figure 7‑28: Laser Atherectomy Device Procedures by Country, Europe, 2019 – 2029 |
274 |
| Figure 7‑29: Mechanical Atherectomy Device Procedures by Country, Europe, 2019 – 2029 |
275 |
| Figure 7‑30: Intravascular Lithotripsy Procedures by Device Type, Europe, 2019 – 2029 |
277 |
| Figure 7‑31: Intravascular Lithotripsy Procedures by Country, Europe, 2019 – 2029 |
278 |
| Figure 7‑32: SFA and Iliac Lithotripsy Procedures by Country, Europe, 2019 – 2029 |
279 |
| Figure 7‑33: BTK Lithotripsy Procedures by Country, Europe, 2019 – 2029 |
280 |
| Figure 7‑34: CTO Device Procedures by Device Type, Europe, 2019 – 2029 |
281 |
| Figure 7‑35: CTO Device Procedures by Country, Europe, 2019 – 2029 |
282 |
| Figure 7‑36: Re-Entry CTO Procedures by Country, Europe, 2019 – 2029 |
283 |
| Figure 7‑37: Recanalization CTO Procedures by Country, Europe, 2019 – 2029 |
284 |
| Figure 7‑38: Total Surgical Graft Procedures by Material, Europe, 2019 – 2029 |
286 |
| Figure 7‑39: Total Surgical Graft Procedures by Country, Europe, 2019 – 2029 |
287 |
| Figure 7‑40: Polyester Surgical Graft Procedures by Country, Europe, 2019 – 2029 |
288 |
| Figure 7‑41: ePTFE Surgical Graft Procedures by Country, Europe, 2019 – 2029 |
289 |
| Figure 7‑42: Total Surgical Graft Procedures by Indication, Europe, 2019 – 2029 |
290 |
| Figure 7‑43: Lower-Limb Surgical Graft Procedures by Country, Europe, 2019 – 2029 |
291 |
| Figure 7‑44: Above-the-Knee Surgical Graft Procedures by Country, Europe, 2019 – 2029 |
292 |
| Figure 7‑45: Below-the-Knee Surgical Graft Procedures by Country, Europe, 2019 – 2029 |
293 |
| Figure 7‑46: AV Access Surgical Graft Procedures by Country, Europe, 2019 – 2029 |
294 |
| Figure 7‑47: Aorta Repair Surgical Graft Procedures by Country, Europe, 2019 – 2029 |
295 |
| Figure 7‑48: Abdominal Aortic Aneurysm Surgical Graft Procedures by Country, Europe, 2019 – 2029 |
296 |
| Figure 7‑49: Thoracic Aortic Aneurysm Surgical Graft Procedures by Country, Europe, 2019 – 2029 |
297 |
| Figure 7‑50: Extra-Anatomical Bypass Surgical Graft Procedures by Country, Europe, 2019 – 2029 |
298 |
| Figure 7‑51: Stent Graft Procedures by Device Type, Europe, 2019 – 2029 |
299 |
| Figure 7‑52: Stent Graft Procedures by Country, Europe, 2019 – 2029 |
300 |
| Figure 7‑53: AAA Stent Graft Procedures by Country, Europe, 2019 – 2029 |
301 |
| Figure 7‑54: Fenestrated Stent Graft Procedures by Country, Europe, 2019 – 2029 |
302 |
| Figure 7‑55: TAA Stent Graft Procedures by Country, Europe, 2019 – 2029 |
303 |
| Figure 7‑56: Embolic Protection Device Procedures by Device Type, Europe, 2019 – 2029 |
304 |
| Figure 7‑57: Embolic Protection Device Procedures by Country, Europe, 2019 – 2029 |
305 |
| Figure 7‑58: Carotid EPD Procedures by Country, Europe, 2019 – 2029 |
306 |
| Figure 7‑59: Renal EPD Procedures by Country, Europe, 2019 – 2029 |
307 |
| Figure 7‑60: Lower-Limb EPD Procedures by Country, Europe, 2019 – 2029 |
308 |
| Figure 7‑61: Peripheral Thrombus Management Procedures by Device Type, Europe, 2019 – 2029 |
309 |
| Figure 7‑62: Peripheral Thrombus Management Procedures by Country, Europe, 2019 – 2029 |
310 |
| Figure 7‑63: Traditional Thrombectomy Device Procedures by Country, Europe, 2019 – 2029 |
311 |
| Figure 7‑64: Pharmacomechanical Thrombectomy Device Procedures by Country, Europe, 2019 – 2029 |
312 |
| Figure 7‑65 IVCF Placement Procedures by Device Type, Europe, 2019 – 2029 |
314 |
| Figure 7‑66 IVCF Placement Procedures by Country, Europe, 2019 – 2029 |
315 |
| Figure 7‑67: Retrievable IVCF Procedures by Country, Europe, 2019 – 2029 |
316 |
| Figure 7‑68: Permanent IVCF Procedures by Country, Europe, 2019 – 2029 |
317 |
| Figure 7‑69: Carotid Shunt Procedures by Country, Europe, 2019 – 2029 |
319 |
| Figure 7‑70: Total Vascular Closure Device Procedures by Device Type, Europe, 2019 – 2029 |
321 |
| Figure 7‑71: Total Vascular Closure Device Procedures by Country, Europe, 2019 – 2029 |
322 |
| Figure 7‑72: Small-Bore Invasive VCD Procedures by Country, Europe, 2019 – 2029 |
323 |
| Figure 7‑73: Large-Bore Invasive VCD Procedures by Country, Europe, 2019 – 2029 |
324 |
| Figure 7‑74: Non-Invasive VCD Procedures by Country, Europe, 2019 – 2029 |
325 |
| Figure 7‑75: Total VCD Procedures by Approach, Europe, 2019 – 2029 |
326 |
| Figure 7‑76: Radial VCD Procedures by Country, Europe, 2019 – 2029 |
327 |
| Figure 7‑77: Femoral VCD Procedures by Country, Europe, 2019 – 2029 |
328 |
| Figure 7‑78: Transcatheter Embolization Procedures by Device Type, Europe, 2019 – 2029 |
330 |
| Figure 7‑79: Transcatheter Embolization Procedures by Country, Europe, 2019 – 2029 |
331 |
| Figure 7‑80: Particle Embolization Procedures by Device Type, Europe, 2019 – 2029 |
332 |
| Figure 7‑81: Particle Embolization Procedures by Country, Europe, 2019 – 2029 |
333 |
| Figure 7‑82: PVA Particle Procedures by Country, Europe, 2019 – 2029 |
334 |
| Figure 7‑83: Microsphere Procedures by Country, Europe, 2019 – 2029 |
335 |
| Figure 7‑84: Drug-Eluting Particle Procedures by Country, Europe, 2019 – 2029 |
336 |
| Figure 7‑85: Radioactive Particle Procedures by Country, Europe, 2019 – 2029 |
337 |
| Figure 7‑86: Coil Embolization Procedures by Device Type, Europe, 2019 – 2029 |
338 |
| Figure 7‑87: Coil Embolization Procedures by Country, Europe, 2019 – 2029 |
339 |
| Figure 7‑88: Pushable Coil Procedures by Country, Europe, 2019 – 2029 |
340 |
| Figure 7‑89: Detachable Coil Procedures by Country, Europe, 2019 – 2029 |
341 |
| Figure 7‑90: Liquid Embolics Procedures by Country, Europe, 2019 – 2029 |
342 |
| Figure 7‑91: Plug Embolization Procedures by Country, Europe, 2019 – 2029 |
343 |
| Figure 7‑92: Peripheral IVUS Procedures by Country, Europe, 2019 – 2029 |
345 |
| Figure 8‑1: Peripheral Vascular Stent Market by Segment, Europe, 2019 – 2029 (€M) |
353 |
| Figure 8‑2: Peripheral Vascular Stent Market by Segment, Europe, 2019 – 2029 (US$M) |
353 |
| Figure 8‑3: Arterial Stent Market by Device Type, Europe, 2019 – 2029 (€M) |
356 |
| Figure 8‑4: Arterial Stent Market by Device Type, Europe, 2019 – 2029 (US$M) |
356 |
| Figure 8‑5: Arterial Stent Market, Europe, 2019 – 2029 |
357 |
| Figure 8‑6: Units Sold by Country, Arterial Stent Market, Europe, 2019 – 2029 |
358 |
| Figure 8‑7: Average Selling Price by Country, Arterial Stent Market, Europe, 2019 – 2029 (€) |
359 |
| Figure 8‑8: Average Selling Price by Country, Arterial Stent Market, Europe, 2019 – 2029 (US$) |
360 |
| Figure 8‑9: Market Value by Country, Arterial Stent Market, Europe, 2019 – 2029 (€M) |
361 |
| Figure 8‑10: Market Value by Country, Arterial Stent Market, Europe, 2019 – 2029 (US$M) |
362 |
| Figure 8‑11: Bare-Metal Stent Market by Indication, Europe, 2019 – 2029 (€M) |
364 |
| Figure 8‑12: Bare-Metal Stent Market by Indication, Europe, 2019 – 2029 (US$M) |
365 |
| Figure 8‑13: Total Bare-Metal Stent Market, Europe, 2019 – 2029 |
365 |
| Figure 8‑14: Units Sold by Country, Total Bare-Metal Stent Market, Europe, 2019 – 2029 |
366 |
| Figure 8‑15: Average Selling Price by Country, Total Bare-Metal Stent Market, Europe, 2019 – 2029 (€) |
367 |
| Figure 8‑16: Average Selling Price by Country, Total Bare-Metal Stent Market, Europe, 2019 – 2029 (US$) |
368 |
| Figure 8‑17: Market Value by Country, Total Bare-Metal Stent Market, Europe, 2019 – 2029 (€M) |
369 |
| Figure 8‑18: Market Value by Country, Total Bare-Metal Stent Market, Europe, 2019 – 2029 (US$M) |
370 |
| Figure 8‑19: Bare-Metal Carotid Stent Market, Europe, 2019 – 2029 |
371 |
| Figure 8‑20: Units Sold by Country, Bare-Metal Carotid Stent Market, Europe, 2019 – 2029 |
372 |
| Figure 8‑21: Average Selling Price by Country, Bare-Metal Carotid Stent Market, Europe, 2019 – 2029 (€) |
373 |
| Figure 8‑22: Average Selling Price by Country, Bare-Metal Carotid Stent Market, Europe, 2019 – 2029 (US$) |
374 |
| Figure 8‑23: Market Value by Country, Bare-Metal Carotid Stent Market, Europe, 2019 – 2029 (€M) |
375 |
| Figure 8‑24: Market Value by Country, Bare-Metal Carotid Stent Market, Europe, 2019 – 2029 (US$M) |
376 |
| Figure 8‑25: Bare-Metal Iliac Stent Market, Europe, 2019 – 2029 |
377 |
| Figure 8‑26: Units Sold by Country, Bare-Metal Iliac Stent Market, Europe, 2019 – 2029 |
378 |
| Figure 8‑27: Average Selling Price by Country, Bare-Metal Iliac Stent Market, Europe, 2019 – 2029 (€) |
379 |
| Figure 8‑28: Average Selling Price by Country, Bare-Metal Iliac Stent Market, Europe, 2019 – 2029 (US$) |
380 |
| Figure 8‑29: Market Value by Country, Bare-Metal Iliac Stent Market, Europe, 2019 – 2029 (€M) |
381 |
| Figure 8‑30: Market Value by Country, Bare-Metal Iliac Stent Market, Europe, 2019 – 2029 (US$M) |
382 |
| Figure 8‑31: Bare-Metal Renal Stent Market, Europe, 2019 – 2029 |
383 |
| Figure 8‑32: Units Sold by Country, Bare-Metal Renal Stent Market, Europe, 2019 – 2029 |
384 |
| Figure 8‑33: Average Selling Price by Country, Bare-Metal Renal Stent Market, Europe, 2019 – 2029 (€) |
385 |
| Figure 8‑34: Average Selling Price by Country, Bare-Metal Renal Stent Market, Europe, 2019 – 2029 (US$) |
386 |
| Figure 8‑35: Market Value by Country, Bare-Metal Renal Stent Market, Europe, 2019 – 2029 (€M) |
387 |
| Figure 8‑36: Market Value by Country, Bare-Metal Renal Stent Market, Europe, 2019 – 2029 (US$M) |
388 |
| Figure 8‑37: Bare-Metal Fem-Pop Stent Market, Europe, 2019 – 2029 |
389 |
| Figure 8‑38: Units Sold by Country, Bare-Metal Fem-Pop Stent Market, Europe, 2019 – 2029 |
390 |
| Figure 8‑39: Average Selling Price by Country, Bare-Metal Fem-Pop Stent Market, Europe, 2019 – 2029 (€) |
391 |
| Figure 8‑40: Average Selling Price by Country, Bare-Metal Fem-Pop Stent Market, Europe, 2019 – 2029 (US$) |
392 |
| Figure 8‑41: Market Value by Country, Bare-Metal Fem-Pop Stent Market, Europe, 2019 – 2029 (€M) |
393 |
| Figure 8‑42: Market Value by Country, Bare-Metal Fem-Pop Stent Market, Europe, 2019 – 2029 (US$M) |
394 |
| Figure 8‑43: Bare-Metal Infra-Pop Stent Market, Europe, 2019 – 2029 |
395 |
| Figure 8‑44: Units Sold by Country, Bare-Metal Infra-Pop Stent Market, Europe, 2019 – 2029 |
396 |
| Figure 8‑45: Average Selling Price by Country, Bare-Metal Infra-Pop Stent Market, Europe, 2019 – 2029 (€) |
397 |
| Figure 8‑46: Average Selling Price by Country, Bare-Metal Infra-Pop Stent Market, Europe, 2019 – 2029 (US$) |
398 |
| Figure 8‑47: Market Value by Country, Bare-Metal Infra-Pop Stent Market, Europe, 2019 – 2029 (€M) |
399 |
| Figure 8‑48: Market Value by Country, Bare-Metal Infra-Pop Stent Market, Europe, 2019 – 2029 (US$M) |
400 |
| Figure 8‑49: Covered Stent Market, Europe, 2019 – 2029 |
401 |
| Figure 8‑50: Units Sold by Country, Covered Stent Market, Europe, 2019 – 2029 |
402 |
| Figure 8‑51: Average Selling Price by Country, Covered Stent Market, Europe, 2019 – 2029 (€) |
403 |
| Figure 8‑52: Average Selling Price by Country, Covered Stent Market, Europe, 2019 – 2029 (US$) |
404 |
| Figure 8‑53: Market Value by Country, Covered Stent Market, Europe, 2019 – 2029 (€M) |
405 |
| Figure 8‑54: Market Value by Country, Covered Stent Market, Europe, 2019 – 2029 (US$M) |
406 |
| Figure 8‑55: Drug-Eluting Stent Market, Europe, 2019 – 2029 |
408 |
| Figure 8‑56: Units Sold by Country, Drug-Eluting Stent Market, Europe, 2019 – 2029 |
409 |
| Figure 8‑57: Average Selling Price by Country, Drug-Eluting Stent Market, Europe, 2019 – 2029 (€) |
410 |
| Figure 8‑58: Average Selling Price by Country, Drug-Eluting Stent Market, Europe, 2019 – 2029 (US$) |
411 |
| Figure 8‑59: Market Value by Country, Drug-Eluting Stent Market, Europe, 2019 – 2029 (€M) |
412 |
| Figure 8‑60: Market Value by Country, Drug-Eluting Stent Market, Europe, 2019 – 2029 (US$M) |
413 |
| Figure 8‑61: Venous Stent Market, Europe, 2019 – 2029 |
415 |
| Figure 8‑62: Units Sold by Country, Venous Stent Market, Europe, 2019 – 2029 |
416 |
| Figure 8‑63: Average Selling Price by Country, Venous Stent Market, Europe, 2019 – 2029 (€) |
417 |
| Figure 8‑64: Average Selling Price by Country, Venous Stent Market, Europe, 2019 – 2029 (US$) |
418 |
| Figure 8‑65: Market Value by Country, Venous Stent Market, Europe, 2019 – 2029 (€M) |
419 |
| Figure 8‑66: Market Value by Country, Venous Stent Market, Europe, 2019 – 2029 (US$M) |
420 |
| Figure 8‑67: Units Sold by Delivery Platform, Bare-Metal Stent Market, Europe, 2019 – 2029 |
421 |
| Figure 8‑68: Units Sold by Country, Self-Expanding Bare-Metal Stent Market, Europe, 2019 – 2029 |
422 |
| Figure 8‑69: Units Sold by Country, Balloon-Expanding Bare-Metal Stent Market, Europe, 2019 – 2029 |
423 |
| Figure 8‑70: Units Sold by Stent Length, Bare-Metal Stent Market, Europe, 2019 – 2029 |
425 |
| Figure 8‑71: Units Sold by Stent Length, Bare-Metal Carotid Stent Market, Europe, 2019 – 2029 |
426 |
| Figure 8‑72: Units Sold by Stent Length, Bare-Metal Iliac Stent Market, Europe, 2019 – 2029 |
427 |
| Figure 8‑73: Units Sold by Stent Length, Bare-Metal Renal Stent Market, Europe, 2019 – 2029 |
428 |
| Figure 8‑74: Units Sold by Stent Length, Bare-Metal Fem-Popliteal Stent Market, Europe, 2019 – 2029 |
429 |
| Figure 8‑75: Units Sold by Delivery Platform, Covered Stent Market, Europe, 2019 – 2029 |
430 |
| Figure 8‑76: Units Sold by Country, Iliac Covered Stent Market, Europe, 2019 – 2029 |
431 |
| Figure 8‑77: Units Sold by Country, Fem-Pop Covered Stent Market, Europe, 2019 – 2029 |
432 |
| Figure 8‑78: Units Sold by Country, AV Access Covered Stent Market, Europe, 2019 – 2029 |
433 |
| Figure 8‑79: Units Sold by Delivery Platform, Drug-Eluting Stent Market, Europe, 2019 – 2029 |
434 |
| Figure 8‑80: Units Sold by Country, SFA Drug-Eluting Stent Market, Europe, 2019 – 2029 |
435 |
| Figure 8‑81: Units Sold by Country, Infra-Pop Drug-Eluting Stent Market, Europe, 2019 – 2029 |
436 |
| Figure 8‑82: Leading Competitors, Peripheral Vascular Stent Market, Europe, 2022 |
445 |
| Figure 9‑1: PTA Balloon Catheter Market by Segment, Europe, 2019 – 2029 (€M) |
450 |
| Figure 9‑2: PTA Balloon Catheter Market by Segment, Europe, 2019 – 2029 (US$M) |
451 |
| Figure 9‑3: Total PTA Balloon Catheter Market, Europe, 2019 – 2029 |
453 |
| Figure 9‑4: Units Sold by Country, PTA Balloon Catheter Market, Europe, 2019 – 2029 |
454 |
| Figure 9‑5: Average Selling Price by Country, PTA Balloon Catheter Market, Europe, 2019 – 2029 (€) |
455 |
| Figure 9‑6: Average Selling Price by Country, PTA Balloon Catheter Market, Europe, 2019 – 2029 (US$) |
456 |
| Figure 9‑7: Market Value by Country, PTA Balloon Catheter Market, Europe, 2019 – 2029 (€M) |
457 |
| Figure 9‑8: Market Value by Country, PTA Balloon Catheter Market, Europe, 2019 – 2029 (US$M) |
458 |
| Figure 9‑9: Standard PTA Balloon Catheter Market, Europe, 2019 – 2029 |
459 |
| Figure 9‑10: Units Sold by Country, Standard PTA Balloon Catheter Market, Europe, 2019 – 2029 |
460 |
| Figure 9‑11: Average Selling Price by Country, Standard PTA Balloon Catheter Market, Europe, 2019 – 2029 (€) |
461 |
| Figure 9‑12: Average Selling Price by Country, Standard PTA Balloon Catheter Market, Europe, 2019 – 2029 (US$) |
462 |
| Figure 9‑13: Market Value by Country, Standard PTA Balloon Catheter Market, Europe, 2019 – 2029 (€M) |
463 |
| Figure 9‑14: Market Value by Country, Standard PTA Balloon Catheter Market, Europe, 2019 – 2029 (US$M) |
464 |
| Figure 9‑15: High-Pressure PTA Balloon Catheter Market, Europe, 2019 – 2029 |
465 |
| Figure 9‑16: Units Sold by Country, High-Pressure PTA Balloon Catheter Market, Europe, 2019 – 2029 |
466 |
| Figure 9‑17: Average Selling Price by Country, High-Pressure PTA Balloon Catheter Market, Europe, 2019 – 2029 (€) |
467 |
| Figure 9‑18: Average Selling Price by Country, High-Pressure PTA Balloon Catheter Market, Europe, 2019 – 2029 (US$) |
468 |
| Figure 9‑19: Market Value by Country, High-Pressure PTA Balloon Catheter Market, Europe, 2019 – 2029 (€M) |
469 |
| Figure 9‑20: Market Value by Country, High-Pressure PTA Balloon Catheter Market, Europe, 2019 – 2029 (US$M) |
470 |
| Figure 9‑21: Large PTA Balloon Catheter Market, Europe, 2019 – 2029 |
471 |
| Figure 9‑22: Units Sold by Country, Large PTA Balloon Catheter Market, Europe, 2019 – 2029 |
472 |
| Figure 9‑23: Average Selling Price by Country, Large PTA Balloon Catheter Market, Europe, 2019 – 2029 (€) |
473 |
| Figure 9‑24: Average Selling Price by Country, Large PTA Balloon Catheter Market, Europe, 2019 – 2029 (US$) |
474 |
| Figure 9‑25: Market Value by Country, Large PTA Balloon Catheter Market, Europe, 2019 – 2029 (€M) |
475 |
| Figure 9‑26: Market Value by Country, Large PTA Balloon Catheter Market, Europe, 2019 – 2029 (US$M) |
476 |
| Figure 9‑27: Small PTA Balloon Catheter Market, Europe, 2019 – 2029 |
477 |
| Figure 9‑28: Units Sold by Country, Small PTA Balloon Catheter Market, Europe, 2019 – 2029 |
478 |
| Figure 9‑29: Average Selling Price by Country, Small PTA Balloon Catheter Market, Europe, 2019 – 2029 (€) |
479 |
| Figure 9‑30: Average Selling Price by Country, Small PTA Balloon Catheter Market, Europe, 2019 – 2029 (US$) |
480 |
| Figure 9‑31: Market Value by Country, Small PTA Balloon Catheter Market, Europe, 2019 – 2029 (€M) |
481 |
| Figure 9‑32: Market Value by Country, Small PTA Balloon Catheter Market, Europe, 2019 – 2029 (US$M) |
482 |
| Figure 9‑33: Specialty PTA Balloon Catheter Market, Europe, 2019 – 2029 |
483 |
| Figure 9‑34: Units Sold by Country, Specialty PTA Balloon Catheter Market, Europe, 2019 – 2029 |
484 |
| Figure 9‑35: Average Selling Price by Country, Specialty PTA Balloon Catheter Market, Europe, 2019 – 2029 (€) |
485 |
| Figure 9‑36: Average Selling Price by Country, Specialty PTA Balloon Catheter Market, Europe, 2019 – 2029 (US$) |
486 |
| Figure 9‑37: Market Value by Country, Specialty PTA Balloon Catheter Market, Europe, 2019 – 2029 (€M) |
487 |
| Figure 9‑38: Market Value by Country, Specialty PTA Balloon Catheter Market, Europe, 2019 – 2029 (US$M) |
488 |
| Figure 9‑39: Leading Competitors by Country, PTA Balloon Catheter Market, Europe, 2022 |
494 |
| Figure 10‑1: Drug-Coated Balloon Market, Europe, 2019 – 2029 |
499 |
| Figure 10‑2: Units Sold by Country, Drug-Coated Balloon Market, Europe, 2019 – 2029 |
501 |
| Figure 10‑3: Average Selling Price by Country, Drug-Coated Balloon Market, Europe, 2019 – 2029 (€) |
502 |
| Figure 10‑4: Average Selling Price by Country, Drug-Coated Balloon Market, Europe, 2019 – 2029 (US$) |
503 |
| Figure 10‑5: Market Value by Country, Drug-Coated Balloon Market, Europe, 2019 – 2029 (€M) |
504 |
| Figure 10‑6: Market Value by Country, Drug-Coated Balloon Market, Europe, 2019 – 2029 (US$M) |
505 |
| Figure 10‑7: Leading Competitors, Drug-Coated Balloon Market, Europe, 2022 |
510 |
| Figure 11‑1: Atherectomy Device Market by Segment, Europe, 2019 – 2029 (€M) |
515 |
| Figure 11‑2: Atherectomy Device Market by Segment, Europe, 2019 – 2029 (US$M) |
515 |
| Figure 11‑3: Total Atherectomy Device Market, Europe, 2019 – 2029 |
518 |
| Figure 11‑4: Units Sold by Country, Atherectomy Device Market, Europe, 2019 – 2029 |
519 |
| Figure 11‑5: Average Selling Price by Country, Atherectomy Device Market, Europe, 2019 – 2029 (€) |
520 |
| Figure 11‑6: Average Selling Price by Country, Atherectomy Device Market, Europe, 2019 – 2029 (US$) |
521 |
| Figure 11‑7: Market Value by Country, Atherectomy Device Market, Europe, 2019 – 2029 (€M) |
522 |
| Figure 11‑8: Market Value by Country, Atherectomy Device Market, Europe, 2019 – 2029 (US$M) |
523 |
| Figure 11‑9: Laser Atherectomy Device Market, Europe, 2019 – 2029 |
524 |
| Figure 11‑10: Units Sold by Country, Laser Atherectomy Device Market, Europe, 2019 – 2029 |
525 |
| Figure 11‑11: Average Selling Price by Country, Laser Atherectomy Device Market, Europe, 2019 – 2029 (€) |
526 |
| Figure 11‑12: Average Selling Price by Country, Laser Atherectomy Device Market, Europe, 2019 – 2029 (US$) |
527 |
| Figure 11‑13: Market Value by Country, Laser Atherectomy Device Market, Europe, 2019 – 2029 (€M) |
528 |
| Figure 11‑14: Market Value by Country, Laser Atherectomy Device Market, Europe, 2019 – 2029 (US$M) |
529 |
| Figure 11‑15: Mechanical Atherectomy Device Market, Europe, 2019 – 2029 |
530 |
| Figure 11‑16: Units Sold by Country, Mechanical Atherectomy Device Market, Europe, 2019 – 2029 |
531 |
| Figure 11‑17: Average Selling Price by Country, Mechanical Atherectomy Device Market, Europe, 2019 – 2029 (€) |
532 |
| Figure 11‑18: Average Selling Price by Country, Mechanical Atherectomy Device Market, Europe, 2019 – 2029 (US$) |
533 |
| Figure 11‑19: Market Value by Country, Mechanical Atherectomy Device Market, Europe, 2019 – 2029 (€M) |
534 |
| Figure 11‑20: Market Value by Country, Mechanical Atherectomy Device Market, Europe, 2019 – 2029 (US$M) |
535 |
| Figure 11‑21: Leading Competitors, Atherectomy Device Market, Europe, 2022 |
541 |
| Figure 12‑1: Intravascular Lithotripsy Market, Europe, 2019 – 2029 |
545 |
| Figure 12‑2: Units Sold by Country, Intravascular Lithotripsy Market, Europe, 2019 – 2029 |
547 |
| Figure 12‑3: Average Selling Price by Country, Intravascular Lithotripsy Market, Europe, 2019 – 2029 (€) |
548 |
| Figure 12‑4: Average Selling Price by Country, Intravascular Lithotripsy Market, Europe, 2019 – 2029 (US$) |
549 |
| Figure 12‑5: Market Value by Country, Intravascular Lithotripsy Market, Europe, 2019 – 2029 (€M) |
550 |
| Figure 12‑6: Market Value by Country, Intravascular Lithotripsy Market, Europe, 2019 – 2029 (US$M) |
551 |
| Figure 12‑7: Leading Competitors, Intravascular Lithotripsy Market, Europe, 2022 |
554 |
| Figure 13‑1: CTO Device Market by Segment, Europe, 2019 – 2029 (€M) |
556 |
| Figure 13‑2: CTO Device Market by Segment, Europe, 2019 – 2029 (US$M) |
557 |
| Figure 13‑3: Total CTO Device Market, Europe, 2019 – 2029 |
559 |
| Figure 13‑4: Units Sold by Country, CTO Device Market, Europe, 2019 – 2029 |
560 |
| Figure 13‑5: Average Selling Price by Country, CTO Device Market, Europe, 2019 – 2029 (€) |
561 |
| Figure 13‑6: Average Selling Price by Country, CTO Device Market, Europe, 2019 – 2029 (US$) |
562 |
| Figure 13‑7: Market Value by Country, CTO Device Market, Europe, 2019 – 2029 (€M) |
563 |
| Figure 13‑8: Market Value by Country, CTO Device Market, Europe, 2019 – 2029 (US$M) |
564 |
| Figure 13‑9: Re-Entry Device Market, Europe, 2019 – 2029 |
565 |
| Figure 13‑10: Units Sold by Country, Re-Entry Device Market, Europe, 2019 – 2029 |
566 |
| Figure 13‑11: Average Selling Price by Country, Re-Entry Device Market, Europe, 2019 – 2029 (€) |
567 |
| Figure 13‑12: Average Selling Price by Country, Re-Entry Device Market, Europe, 2019 – 2029 (US$) |
568 |
| Figure 13‑13: Market Value by Country, Re-Entry Device Market, Europe, 2019 – 2029 (€M) |
569 |
| Figure 13‑14: Market Value by Country, Re-Entry Device Market, Europe, 2019 – 2029 (US$M) |
570 |
| Figure 13‑15: Recanalization Device Market, Europe, 2019 – 2029 |
571 |
| Figure 13‑16: Units Sold by Country, Recanalization Device Market, Europe, 2019 – 2029 |
572 |
| Figure 13‑17: Average Selling Price by Country, Recanalization Device Market, Europe, 2019 – 2029 (€) |
573 |
| Figure 13‑18: Average Selling Price by Country, Recanalization Device Market, Europe, 2019 – 2029 (US$) |
574 |
| Figure 13‑19: Market Value by Country, Recanalization Device Market, Europe, 2019 – 2029 (€M) |
575 |
| Figure 13‑20: Market Value by Country, Recanalization Device Market, Europe, 2019 – 2029 (US$M) |
576 |
| Figure 13‑21: Leading Competitors, CTO Device Market, Europe, 2022 |
580 |
| Figure 14‑1: Surgical Graft Market by Segment, Europe, 2019 – 2029 (€M) |
583 |
| Figure 14‑2: Surgical Graft Market by Segment, Europe, 2019 – 2029 (US$M) |
584 |
| Figure 14‑3: Total Lower-Limb Surgical Graft Market by Segment, Europe, 2019 – 2029 (€M) |
587 |
| Figure 14‑4: Lower-Limb Surgical Graft Market by Segment, Europe, 2019 – 2029 (US$M) |
588 |
| Figure 14‑5: Total Lower-Limb Surgical Graft Market, Europe, 2019 – 2029 |
588 |
| Figure 14‑6: Units Sold by Country, Total Lower-Limb Surgical Graft Market, Europe, 2019 – 2029 |
589 |
| Figure 14‑7: Average Selling Price by Country, Total Lower-Limb Surgical Graft Market, Europe, 2019 – 2029 (€) |
590 |
| Figure 14‑8: Average Selling Price by Country, Total Lower-Limb Surgical Graft Market, Europe, 2019 – 2029 (US$) |
591 |
| Figure 14‑9: Market Value by Country, Total Lower-Limb Surgical Graft Market, Europe, 2019 – 2029 (€M) |
592 |
| Figure 14‑10: Market Value by Country, Total Lower-Limb Surgical Graft Market, Europe, 2019 – 2029 (US$M) |
593 |
| Figure 14‑11: Above-the-Knee Surgical Graft Market, Europe, 2019 – 2029 |
594 |
| Figure 14‑12: Units Sold by Country, Above-the-Knee Surgical Graft Market, Europe, 2019 – 2029 |
595 |
| Figure 14‑13: Average Selling Price by Country, Above-the-Knee Surgical Graft Market, Europe, 2019 – 2029 (€) |
596 |
| Figure 14‑14: Average Selling Price by Country, Above-the-Knee Surgical Graft Market, Europe, 2019 – 2029 (US$) |
597 |
| Figure 14‑15: Market Value by Country, Above-the-Knee Surgical Graft Market, Europe, 2019 – 2029 (€M) |
598 |
| Figure 14‑16: Market Value by Country, Above-the-Knee Surgical Graft Market, Europe, 2019 – 2029 (US$M) |
599 |
| Figure 14‑17: Below-the-Knee Surgical Graft Market, Europe, 2019 – 2029 |
600 |
| Figure 14‑18: Units Sold by Country, Below-the-Knee Surgical Graft Market, Europe, 2019 – 2029 |
601 |
| Figure 14‑19: Average Selling Price by Country, Below-the-Knee Surgical Graft Market, Europe, 2019 – 2029 (€) |
602 |
| Figure 14‑20: Average Selling Price by Country, Below-the-Knee Surgical Graft Market, Europe, 2019 – 2029 (US$) |
603 |
| Figure 14‑21: Market Value by Country, Below-the-Knee Surgical Graft Market, Europe, 2019 – 2029 (€M) |
604 |
| Figure 14‑22: Market Value by Country, Below-the-Knee Surgical Graft Market, Europe, 2019 – 2029 (US$M) |
605 |
| Figure 14‑23: AV Access Surgical Graft Market, Europe, 2019 – 2029 |
606 |
| Figure 14‑24: Units Sold by Country, AV Access Surgical Graft Market, Europe, 2019 – 2029 |
607 |
| Figure 14‑25: Average Selling Price by Country, AV Access Surgical Graft Market, Europe, 2019 – 2029 (€) |
608 |
| Figure 14‑26: Average Selling Price by Country, AV Access Surgical Graft Market, Europe, 2019 – 2029 (US$) |
609 |
| Figure 14‑27: Market Value by Country, AV Access Surgical Graft Market, Europe, 2019 – 2029 (€M) |
610 |
| Figure 14‑28: Market Value by Country, AV Access Surgical Graft Market, Europe, 2019 – 2029 (US$M) |
611 |
| Figure 14‑29: Total Aorta Repair Surgical Graft Market by Segment, Europe, 2019 – 2029 (€M) |
612 |
| Figure 14‑30: Aorta Repair Surgical Graft Market by Segment, Europe, 2019 – 2029 (US$M) |
613 |
| Figure 14‑31: Total Aorta Repair Surgical Graft Market, Europe, 2019 – 2029 |
614 |
| Figure 14‑32: Units Sold by Country, Total Aorta Repair Surgical Graft Market, Europe, 2019 – 2029 |
615 |
| Figure 14‑33: Average Selling Price by Country, Total Aorta Repair Surgical Graft Market, Europe, 2019 – 2029 (€) |
616 |
| Figure 14‑34: Average Selling Price by Country, Total Aorta Repair Surgical Graft Market, Europe, 2019 – 2029 (US$) |
617 |
| Figure 14‑35: Market Value by Country, Total Aorta Repair Surgical Graft Market, Europe, 2019 – 2029 (€M) |
618 |
| Figure 14‑36: Market Value by Country, Total Aorta Repair Surgical Graft Market, Europe, 2019 – 2029 (US$M) |
619 |
| Figure 14‑37: Abdominal Aortic Aneurysm Surgical Graft Market, Europe, 2019 – 2029 |
620 |
| Figure 14‑38: Units Sold by Country, Abdominal Aortic Aneurysm Surgical Graft Market, Europe, 2019 – 2029 |
621 |
| Figure 14‑39: Average Selling Price by Country, Abdominal Aortic Aneurysm Surgical Graft Market, Europe, 2019 – 2029 (€) |
622 |
| Figure 14‑40: Average Selling Price by Country, Abdominal Aortic Aneurysm Surgical Graft Market, Europe, 2019 – 2029 (US$) |
623 |
| Figure 14‑41: Market Value by Country, Abdominal Aortic Aneurysm Surgical Graft Market, Europe, 2019 – 2029 (€M) |
624 |
| Figure 14‑42: Market Value by Country, Abdominal Aortic Aneurysm Surgical Graft Market, Europe, 2019 – 2029 (US$M) |
625 |
| Figure 14‑43: Thoracic Aortic Aneurysm Surgical Graft Market, Europe, 2019 – 2029 |
626 |
| Figure 14‑44: Units Sold by Country, Thoracic Aortic Aneurysm Surgical Graft Market, Europe, 2019 – 2029 |
627 |
| Figure 14‑45: Average Selling Price by Country, Thoracic Aortic Aneurysm Surgical Graft Market, Europe, 2019 – 2029 (€) |
628 |
| Figure 14‑46: Average Selling Price by Country, Thoracic Aortic Aneurysm Surgical Graft Market, Europe, 2019 – 2029 (US$) |
629 |
| Figure 14‑47: Market Value by Country, Thoracic Aortic Aneurysm Surgical Graft Market, Europe, 2019 – 2029 (€M) |
630 |
| Figure 14‑48: Market Value by Country, Thoracic Aortic Aneurysm Surgical Graft Market, Europe, 2019 – 2029 (US$M) |
631 |
| Figure 14‑49: Extra-Anatomical Bypass Surgical Graft Market, Europe, 2019 – 2029 |
632 |
| Figure 14‑50: Units Sold by Country, Extra-Anatomical Bypass Surgical Graft Market, Europe, 2019 – 2029 |
633 |
| Figure 14‑51: Average Selling Price by Country, Extra-Anatomical Bypass Surgical Graft Market, Europe, 2019 – 2029 (€) |
634 |
| Figure 14‑52: Average Selling Price by Country, Extra-Anatomical Bypass Surgical Graft Market, Europe, 2019 – 2029 (US$) |
635 |
| Figure 14‑53: Market Value by Country, Extra-Anatomical Bypass Surgical Graft Market, Europe, 2019 – 2029 (€M) |
636 |
| Figure 14‑54: Market Value by Country, Extra-Anatomical Bypass Surgical Graft Market, Europe, 2019 – 2029 (US$M) |
637 |
| Figure 14‑55: Units Sold by Material, Surgical Graft Market, Europe, 2019 – 2029 |
638 |
| Figure 14‑56: Units Sold by Country, Polyester Surgical Graft Market, Europe, 2019 – 2029 |
639 |
| Figure 14‑57: Units Sold by Country, ePTFE Surgical Graft Market, Europe, 2019 – 2029 |
640 |
| Figure 14‑58: Leading Competitors, Surgical Graft Market, Europe, 2022 |
645 |
| Figure 15‑1: Stent Graft Market by Segment, Europe, 2019 – 2029 (€M) |
648 |
| Figure 15‑2: Stent Graft Market by Segment, Europe, 2019 – 2029 (US$M) |
649 |
| Figure 15‑3: Total Stent Graft Market, Europe, 2019 – 2029 |
652 |
| Figure 15‑4: Units Sold by Country, Stent Graft Market, Europe, 2019 – 2029 |
653 |
| Figure 15‑5: Average Selling Price by Country, Stent Graft Market, Europe, 2019 – 2029 (€) |
654 |
| Figure 15‑6: Average Selling Price by Country, Stent Graft Market, Europe, 2019 – 2029 (US$) |
655 |
| Figure 15‑7: Market Value by Country, Stent Graft Market, Europe, 2019 – 2029 (€M) |
656 |
| Figure 15‑8: Market Value by Country, Stent Graft Market, Europe, 2019 – 2029 (US$M) |
657 |
| Figure 15‑9: AAA Stent Graft Market, Europe, 2019 – 2029 |
658 |
| Figure 15‑10: Units Sold by Country, AAA Stent Graft Market, Europe, 2019 – 2029 |
659 |
| Figure 15‑11: Average Selling Price by Country, AAA Stent Graft Market, Europe, 2019 – 2029 (€) |
660 |
| Figure 15‑12: Average Selling Price by Country, AAA Stent Graft Market, Europe, 2019 – 2029 (US$) |
661 |
| Figure 15‑13: Market Value by Country, AAA Stent Graft Market, Europe, 2019 – 2029 (€M) |
662 |
| Figure 15‑14: Market Value by Country, AAA Stent Graft Market, Europe, 2019 – 2029 (US$M) |
663 |
| Figure 15‑15: TAA Stent Graft Market, Europe, 2019 – 2029 |
664 |
| Figure 15‑16: Units Sold by Country, TAA Stent Graft Market, Europe, 2019 – 2029 |
665 |
| Figure 15‑17: Average Selling Price by Country, TAA Stent Graft Market, Europe, 2019 – 2029 (€) |
666 |
| Figure 15‑18: Average Selling Price by Country, TAA Stent Graft Market, Europe, 2019 – 2029 (US$) |
667 |
| Figure 15‑19: Market Value by Country, TAA Stent Graft Market, Europe, 2019 – 2029 (€M) |
668 |
| Figure 15‑20: Market Value by Country, TAA Stent Graft Market, Europe, 2019 – 2029 (US$M) |
669 |
| Figure 15‑21: Fenestrated Stent Graft Market, Europe, 2019 – 2029 |
671 |
| Figure 15‑22: Units Sold by Country, Fenestrated Stent Graft Market, Europe, 2019 – 2029 |
672 |
| Figure 15‑23: Average Selling Price by Country, Fenestrated Stent Graft Market, Europe, 2019 – 2029 (€) |
673 |
| Figure 15‑24: Average Selling Price by Country, Fenestrated Stent Graft Market, Europe, 2019 – 2029 (US$) |
674 |
| Figure 15‑25: Market Value by Country, Fenestrated Stent Graft Market, Europe, 2019 – 2029 (€M) |
675 |
| Figure 15‑26: Market Value by Country, Fenestrated Stent Graft Market, Europe, 2019 – 2029 (US$M) |
676 |
| Figure 15‑27: Leading Competitors, Stent Graft Market, Europe, 2022 |
682 |
| Figure 16‑1: Embolic Protection Device Market by Segment, Europe, 2019 – 2029 (€M) |
686 |
| Figure 16‑2: Embolic Protection Device Market by Segment, Europe, 2019 – 2029 (US$M) |
687 |
| Figure 16‑3: Total Embolic Protection Device Market, Europe, 2019 – 2029 |
689 |
| Figure 16‑4: Units Sold by Country, Embolic Protection Device Market, Europe, 2019 – 2029 |
690 |
| Figure 16‑5: Average Selling Price by Country, Embolic Protection Device Market, Europe, 2019 – 2029 (€) |
691 |
| Figure 16‑6: Average Selling Price by Country, Embolic Protection Device Market, Europe, 2019 – 2029 (US$) |
692 |
| Figure 16‑7: Market Value by Country, Embolic Protection Device Market, Europe, 2019 – 2029 (€M) |
693 |
| Figure 16‑8: Market Value by Country, Embolic Protection Device Market, Europe, 2019 – 2029 (US$M) |
694 |
| Figure 16‑9: Carotid Embolic Protection Device Market, Europe, 2019 – 2029 |
695 |
| Figure 16‑10: Units Sold by Country, Carotid Embolic Protection Device Market, Europe, 2019 – 2029 |
696 |
| Figure 16‑11: Average Selling Price by Country, Carotid Embolic Protection Device Market, Europe, 2019 – 2029 (€) |
697 |
| Figure 16‑12: Average Selling Price by Country, Carotid Embolic Protection Device Market, Europe, 2019 – 2029 (US$) |
698 |
| Figure 16‑13: Market Value by Country, Carotid Embolic Protection Device Market, Europe, 2019 – 2029 (€M) |
699 |
| Figure 16‑14: Market Value by Country, Carotid Embolic Protection Device Market, Europe, 2019 – 2029 (US$M) |
700 |
| Figure 16‑15: Renal Embolic Protection Device Market, Europe, 2019 – 2029 |
701 |
| Figure 16‑16: Units Sold by Country, Renal Embolic Protection Device Market, Europe, 2019 – 2029 |
702 |
| Figure 16‑17: Average Selling Price by Country, Renal Embolic Protection Device Market, Europe, 2019 – 2029 (€) |
703 |
| Figure 16‑18: Average Selling Price by Country, Renal Embolic Protection Device Market, Europe, 2019 – 2029 (US$) |
704 |
| Figure 16‑19: Market Value by Country, Renal Embolic Protection Device Market, Europe, 2019 – 2029 (€M) |
705 |
| Figure 16‑20: Market Value by Country, Renal Embolic Protection Device Market, Europe, 2019 – 2029 (US$M) |
706 |
| Figure 16‑21: Lower-Limb Embolic Protection Device Market, Europe, 2019 – 2029 |
707 |
| Figure 16‑22: Units Sold by Country, Lower-Limb Embolic Protection Device Market, Europe, 2019 – 2029 |
708 |
| Figure 16‑23: Average Selling Price by Country, Lower-Limb Embolic Protection Device Market, Europe, 2019 – 2029 (€) |
709 |
| Figure 16‑24: Average Selling Price by Country, Lower-Limb Embolic Protection Device Market, Europe, 2019 – 2029 (US$) |
710 |
| Figure 16‑25: Market Value by Country, Lower-Limb Embolic Protection Device Market, Europe, 2019 – 2029 (€M) |
711 |
| Figure 16‑26: Market Value by Country, Lower-Limb Embolic Protection Device Market, Europe, 2019 – 2029 (US$M) |
712 |
| Figure 16‑27: Leading Competitors, Embolic Protection Device Market, Europe, 2022 |
716 |
| Figure 17‑1: Peripheral Thrombus Management Market by Segment, Europe, 2019 – 2029 (€M) |
721 |
| Figure 17‑2: Peripheral Thrombus Management Market by Segment, Europe, 2019 – 2029 (US$M) |
721 |
| Figure 17‑3: Total Peripheral Thrombus Management Market, Europe, 2019 – 2029 |
723 |
| Figure 17‑4: Units Sold by Country, Peripheral Thrombus Management Market, Europe, 2019 – 2029 |
724 |
| Figure 17‑5: Average Selling Price by Country, Peripheral Thrombus Management Market, Europe, 2019 – 2029 (€) |
725 |
| Figure 17‑6: Average Selling Price by Country, Peripheral Thrombus Management Market, Europe, 2019 – 2029 (US$) |
726 |
| Figure 17‑7: Market Value by Country, Peripheral Thrombus Management Market, Europe, 2019 – 2029 (€M) |
727 |
| Figure 17‑8: Market Value by Country, Peripheral Thrombus Management Market, Europe, 2019 – 2029 (US$M) |
728 |
| Figure 17‑9: Traditional Thrombectomy Device Market, Europe, 2019 – 2029 |
729 |
| Figure 17‑10: Units Sold by Country, Traditional Thrombectomy Device Market, Europe, 2019 – 2029 |
730 |
| Figure 17‑11: Average Selling Price by Country, Traditional Thrombectomy Device Market, Europe, 2019 – 2029 (€) |
731 |
| Figure 17‑12: Average Selling Price by Country, Traditional Thrombectomy Device Market, Europe, 2019 – 2029 (US$) |
732 |
| Figure 17‑13: Market Value by Country, Traditional Thrombectomy Device Market, Europe, 2019 – 2029 (€M) |
733 |
| Figure 17‑14: Market Value by Country, Traditional Thrombectomy Device Market, Europe, 2019 – 2029 (US$M) |
734 |
| Figure 17‑15: Pharmacomechanical Thrombectomy Device Market, Europe, 2019 – 2029 |
736 |
| Figure 17‑16: Units Sold by Country, Pharmacomechanical Thrombectomy Device Market, Europe, 2019 – 2029 |
737 |
| Figure 17‑17: Average Selling Price by Country, Pharmacomechanical Thrombectomy Device Market, Europe, 2019 – 2029 (€) |
738 |
| Figure 17‑18: Average Selling Price by Country, Pharmacomechanical Thrombectomy Device Market, Europe, 2019 – 2029 (US$) |
739 |
| Figure 17‑19: Market Value by Country, Pharmacomechanical Thrombectomy Device Market, Europe, 2019 – 2029 (€M) |
740 |
| Figure 17‑20: Market Value by Country, Pharmacomechanical Thrombectomy Device Market, Europe, 2019 – 2029 (US$M) |
741 |
| Figure 17‑21: Leading Competitors, Peripheral Thrombus Management Market, Europe, 2022 |
745 |
| Figure 18‑1: Inferior Vena Cava Filter Market by Segment, Europe, 2019 – 2029 (€M) |
749 |
| Figure 18‑2: Inferior Vena Cava Filter Market by Segment, Europe, 2019 – 2029 (US$M) |
750 |
| Figure 18‑3: Total Inferior Vena Cava Filter Market, Europe, 2019 – 2029 |
753 |
| Figure 18‑4: Units Sold by Country, Inferior Vena Cava Filter Market, Europe, 2019 – 2029 |
754 |
| Figure 18‑5: Average Selling Price by Country, Inferior Vena Cava Filter Market, Europe, 2019 – 2029 (€) |
755 |
| Figure 18‑6: Average Selling Price by Country, Inferior Vena Cava Filter Market, Europe, 2019 – 2029 (US$) |
756 |
| Figure 18‑7: Market Value by Country, Inferior Vena Cava Filter Market, Europe, 2019 – 2029 (€M) |
757 |
| Figure 18‑8: Market Value by Country, Inferior Vena Cava Filter Market, Europe, 2019 – 2029 (US$M) |
758 |
| Figure 18‑9: Retrievable IVCF Market, Europe, 2019 – 2029 |
759 |
| Figure 18‑10: Units Sold by Country, Retrievable IVCF Market, Europe, 2019 – 2029 |
760 |
| Figure 18‑11: Average Selling Price by Country, Retrievable IVCF Market, Europe, 2019 – 2029 (€) |
761 |
| Figure 18‑12: Average Selling Price by Country, Retrievable IVCF Market, Europe, 2019 – 2029 (US$) |
762 |
| Figure 18‑13: Market Value by Country, Retrievable IVCF Market, Europe, 2019 – 2029 (€M) |
763 |
| Figure 18‑14: Market Value by Country, Retrievable IVCF Market, Europe, 2019 – 2029 (US$M) |
764 |
| Figure 18‑15: Permanent IVCF Market, Europe, 2019 – 2029 |
765 |
| Figure 18‑16: Units Sold by Country, Permanent IVCF Market, Europe, 2019 – 2029 |
766 |
| Figure 18‑17: Average Selling Price by Country, Permanent IVCF Market, Europe, 2019 – 2029 (€) |
767 |
| Figure 18‑18: Average Selling Price by Country, Permanent IVCF Market, Europe, 2019 – 2029 (US$) |
768 |
| Figure 18‑19: Market Value by Country, Permanent IVCF Market, Europe, 2019 – 2029 (€M) |
769 |
| Figure 18‑20: Market Value by Country, Permanent IVCF Market, Europe, 2019 – 2029 (US$M) |
770 |
| Figure 18‑21: Leading Competitors, Inferior Vena Cava Filter Market, Europe, 2022 |
775 |
| Figure 19‑1: Carotid Shunt Market, Europe, 2019 – 2029 |
778 |
| Figure 19‑2: Units Sold by Country, Carotid Shunt Market, Europe, 2019 – 2029 |
780 |
| Figure 19‑3: Average Selling Price by Country, Carotid Shunt Market, Europe, 2019 – 2029 (€) |
781 |
| Figure 19‑4: Average Selling Price by Country, Carotid Shunt Market, Europe, 2019 – 2029 (US$) |
782 |
| Figure 19‑5: Market Value by Country, Carotid Shunt Market, Europe, 2019 – 2029 (€M) |
783 |
| Figure 19‑6: Market Value by Country, Carotid Shunt Market, Europe, 2019 – 2029 (US$M) |
784 |
| Figure 19‑7: Leading Competitors, Carotid Shunt Market, Europe, 2022 |
787 |
| Figure 20‑1: Diagnostic and Interventional Catheter Market by Segment, Europe, 2019 – 2029 (€M) |
790 |
| Figure 20‑2: Diagnostic and Interventional Catheter Market by Segment, Europe, 2019 – 2029 (US$M) |
791 |
| Figure 20‑3: Total Diagnostic and Interventional Catheter Market, Europe, 2019 – 2029 |
793 |
| Figure 20‑4: Units Sold by Country, Diagnostic and Interventional Catheter Market, Europe, 2019 – 2029 |
794 |
| Figure 20‑5: Average Selling Price by Country, Diagnostic and Interventional Catheter Market, Europe, 2019 – 2029 (€) |
795 |
| Figure 20‑6: Average Selling Price by Country, Diagnostic and Interventional Catheter Market, Europe, 2019 – 2029 (US$) |
796 |
| Figure 20‑7: Market Value by Country, Diagnostic and Interventional Catheter Market, Europe, 2019 – 2029 (€M) |
797 |
| Figure 20‑8: Market Value by Country, Diagnostic and Interventional Catheter Market, Europe, 2019 – 2029 (US$M) |
798 |
| Figure 20‑9: Total Diagnostic Catheter Market by Segment, Europe, 2019 – 2029 (€M) |
799 |
| Figure 20‑10: Diagnostic Catheter Market by Segment, Europe, 2019 – 2029 (US$M) |
800 |
| Figure 20‑11: Total Diagnostic Catheter Market, Europe, 2019 – 2029 |
800 |
| Figure 20‑12: Units Sold by Country, Total Diagnostic Catheter Market, Europe, 2019 – 2029 |
801 |
| Figure 20‑13: Average Selling Price by Country, Total Diagnostic Catheter Market, Europe, 2019 – 2029 (€) |
802 |
| Figure 20‑14: Average Selling Price by Country, Total Diagnostic Catheter Market, Europe, 2019 – 2029 (US$) |
803 |
| Figure 20‑15: Market Value by Country, Total Diagnostic Catheter Market, Europe, 2019 – 2029 (€M) |
804 |
| Figure 20‑16: Market Value by Country, Total Diagnostic Catheter Market, Europe, 2019 – 2029 (US$M) |
805 |
| Figure 20‑17: Standard Diagnostic Catheter Market, Europe, 2019 – 2029 |
806 |
| Figure 20‑18: Units Sold by Country, Standard Diagnostic Catheter Market, Europe, 2019 – 2029 |
807 |
| Figure 20‑19: Average Selling Price by Country, Standard Diagnostic Catheter Market, Europe, 2019 – 2029 (€) |
808 |
| Figure 20‑20: Average Selling Price by Country, Standard Diagnostic Catheter Market, Europe, 2019 – 2029 (US$) |
809 |
| Figure 20‑21: Market Value by Country, Standard Diagnostic Catheter Market, Europe, 2019 – 2029 (€M) |
810 |
| Figure 20‑22: Market Value by Country, Standard Diagnostic Catheter Market, Europe, 2019 – 2029 (US$M) |
811 |
| Figure 20‑23: Hydrophilic Diagnostic Catheter Market, Europe, 2019 – 2029 |
812 |
| Figure 20‑24: Units Sold by Country, Hydrophilic Diagnostic Catheter Market, Europe, 2019 – 2029 |
813 |
| Figure 20‑25: Average Selling Price by Country, Hydrophilic Diagnostic Catheter Market, Europe, 2019 – 2029 (€) |
814 |
| Figure 20‑26: Average Selling Price by Country, Hydrophilic Diagnostic Catheter Market, Europe, 2019 – 2029 (US$) |
815 |
| Figure 20‑27: Market Value by Country, Hydrophilic Diagnostic Catheter Market, Europe, 2019 – 2029 (€M) |
816 |
| Figure 20‑28: Market Value by Country, Hydrophilic Diagnostic Catheter Market, Europe, 2019 – 2029 (US$M) |
817 |
| Figure 20‑29: Support Catheter Market, Europe, 2019 – 2029 |
818 |
| Figure 20‑30: Units Sold by Country, Support Catheter Market, Europe, 2019 – 2029 |
819 |
| Figure 20‑31: Average Selling Price by Country, Support Catheter Market, Europe, 2019 – 2029 (€) |
820 |
| Figure 20‑32: Average Selling Price by Country, Support Catheter Market, Europe, 2019 – 2029 (US$) |
821 |
| Figure 20‑33: Market Value by Country, Support Catheter Market, Europe, 2019 – 2029 (€M) |
822 |
| Figure 20‑34: Market Value by Country, Support Catheter Market, Europe, 2019 – 2029 (US$M) |
823 |
| Figure 20‑35: Leading Competitors, Diagnostic and Interventional Catheter Market, Europe, 2022 |
828 |
| Figure 21‑1: Diagnostic and Interventional Guidewire Market by Segment, Europe, 2019 – 2029 (€M) |
831 |
| Figure 21‑2: Diagnostic and Interventional Guidewire Market by Segment, Europe, 2019 – 2029 (US$M) |
832 |
| Figure 21‑3: Total Diagnostic and Interventional Guidewire Market, Europe, 2019 – 2029 |
834 |
| Figure 21‑4: Units Sold by Country, Diagnostic and Interventional Guidewire Market, Europe, 2019 – 2029 |
835 |
| Figure 21‑5: Average Selling Price by Country, Diagnostic and Interventional Guidewire Market, Europe, 2019 – 2029 (€) |
836 |
| Figure 21‑6: Average Selling Price by Country, Diagnostic and Interventional Guidewire Market, Europe, 2019 – 2029 (US$) |
837 |
| Figure 21‑7: Market Value by Country, Diagnostic and Interventional Guidewire Market, Europe, 2019 – 2029 (€M) |
838 |
| Figure 21‑8: Market Value by Country, Diagnostic and Interventional Guidewire Market, Europe, 2019 – 2029 (US$M) |
839 |
| Figure 21‑9: Standard Guidewire Market, Europe, 2019 – 2029 |
840 |
| Figure 21‑10: Units Sold by Country, Standard Guidewire Market, Europe, 2019 – 2029 |
841 |
| Figure 21‑11: Average Selling Price by Country, Standard Guidewire Market, Europe, 2019 – 2029 (€) |
842 |
| Figure 21‑12: Average Selling Price by Country, Standard Guidewire Market, Europe, 2019 – 2029 (US$) |
843 |
| Figure 21‑13: Market Value by Country, Standard Guidewire Market, Europe, 2019 – 2029 (€M) |
844 |
| Figure 21‑14: Market Value by Country, Standard Guidewire Market, Europe, 2019 – 2029 (US$M) |
845 |
| Figure 21‑15: Hydrophilic Guidewire Market, Europe, 2019 – 2029 |
846 |
| Figure 21‑16: Units Sold by Country, Hydrophilic Guidewire Market, Europe, 2019 – 2029 |
847 |
| Figure 21‑17: Average Selling Price by Country, Hydrophilic Guidewire Market, Europe, 2019 – 2029 (€) |
848 |
| Figure 21‑18: Average Selling Price by Country, Hydrophilic Guidewire Market, Europe, 2019 – 2029 (US$) |
849 |
| Figure 21‑19: Market Value by Country, Hydrophilic Guidewire Market, Europe, 2019 – 2029 (€M) |
850 |
| Figure 21‑20: Market Value by Country, Hydrophilic Guidewire Market, Europe, 2019 – 2029 (US$M) |
851 |
| Figure 21‑21: Leading Competitors, Diagnostic and Interventional Guidewire Market, Europe, 2022 |
856 |
| Figure 22‑1: Introducer Sheath Market by Segment, Europe, 2019 – 2029 (€M) |
859 |
| Figure 22‑2: Introducer Sheath Market by Segment, Europe, 2019 – 2029 (US$M) |
860 |
| Figure 22‑3: Total Introducer Sheath Market, Europe, 2019 – 2029 |
862 |
| Figure 22‑4: Units Sold by Country, Introducer Sheath Market, Europe, 2019 – 2029 |
863 |
| Figure 22‑5: Average Selling Price by Country, Introducer Sheath Market, Europe, 2019 – 2029 (€) |
864 |
| Figure 22‑6: Average Selling Price by Country, Introducer Sheath Market, Europe, 2019 – 2029 (US$) |
865 |
| Figure 22‑7: Market Value by Country, Introducer Sheath Market, Europe, 2019 – 2029 (€M) |
866 |
| Figure 22‑8: Market Value by Country, Introducer Sheath Market, Europe, 2019 – 2029 (US$M) |
867 |
| Figure 22‑9: Standard Introducer Sheath Market, Europe, 2019 – 2029 |
868 |
| Figure 22‑10: Units Sold by Country, Standard Introducer Sheath Market, Europe, 2019 – 2029 |
869 |
| Figure 22‑11: Average Selling Price by Country, Standard Introducer Sheath Market, Europe, 2019 – 2029 (€) |
870 |
| Figure 22‑12: Average Selling Price by Country, Standard Introducer Sheath Market, Europe, 2019 – 2029 (US$) |
871 |
| Figure 22‑13: Market Value by Country, Standard Introducer Sheath Market, Europe, 2019 – 2029 (€M) |
872 |
| Figure 22‑14: Market Value by Country, Standard Introducer Sheath Market, Europe, 2019 – 2029 (US$M) |
873 |
| Figure 22‑15: Guiding Introducer Sheath Market, Europe, 2019 – 2029 |
874 |
| Figure 22‑16: Units Sold by Country, Guiding Introducer Sheath Market, Europe, 2019 – 2029 |
875 |
| Figure 22‑17: Average Selling Price by Country, Guiding Introducer Sheath Market, Europe, 2019 – 2029 (€) |
876 |
| Figure 22‑18: Average Selling Price by Country, Guiding Introducer Sheath Market, Europe, 2019 – 2029 (US$) |
877 |
| Figure 22‑19: Market Value by Country, Guiding Introducer Sheath Market, Europe, 2019 – 2029 (€M) |
878 |
| Figure 22‑20: Market Value by Country, Guiding Introducer Sheath Market, Europe, 2019 – 2029 (US$M) |
879 |
| Figure 22‑21: Leading Competitors, Introducer Sheath Market, Europe, 2022 |
883 |
| Figure 23‑1: Vascular Closure Device Market by Device Type, Europe, 2019 – 2029 (€M) |
887 |
| Figure 23‑2: Vascular Closure Device Market by Device Type, Europe, 2019 – 2029 (US$M) |
888 |
| Figure 23‑3: Vascular Closure Device Market by Approach, Europe, 2019 – 2029 (€M) |
889 |
| Figure 23‑4: Vascular Closure Device Market by Approach, Europe, 2019 – 2029 (US$M) |
890 |
| Figure 23‑5: Total Vascular Closure Device Market, Europe, 2019 – 2029 |
892 |
| Figure 23‑6: Units Sold by Country, Vascular Closure Device Market, Europe, 2019 – 2029 |
893 |
| Figure 23‑7: Average Selling Price by Country, Vascular Closure Device Market, Europe, 2019 – 2029 (€) |
894 |
| Figure 23‑8: Average Selling Price by Country, Vascular Closure Device Market, Europe, 2019 – 2029 (US$) |
895 |
| Figure 23‑9: Market Value by Country, Vascular Closure Device Market, Europe, 2019 – 2029 (€M) |
896 |
| Figure 23‑10: Market Value by Country, Vascular Closure Device Market, Europe, 2019 – 2029 (US$M) |
897 |
| Figure 23‑11: Invasive Vascular Closure Device Market by Segment, Europe, 2019 – 2029 (€M) |
898 |
| Figure 23‑12: Invasive Vascular Closure Device Market by Segment, Europe, 2019 – 2029 (US$M) |
899 |
| Figure 23‑13: Total Invasive Vascular Closure Device Market, Europe, 2019 – 2029 |
899 |
| Figure 23‑14: Units Sold by Country, Total Invasive Vascular Closure Device Market, Europe, 2019 – 2029 |
900 |
| Figure 23‑15: Average Selling Price by Country, Total Invasive Vascular Closure Device Market, Europe, 2019 – 2029 (€) |
901 |
| Figure 23‑16: Average Selling Price by Country, Total Invasive Vascular Closure Device Market, Europe, 2019 – 2029 (US$) |
902 |
| Figure 23‑17: Market Value by Country, Total Invasive Vascular Closure Device Market, Europe, 2019 – 2029 (€M) |
903 |
| Figure 23‑18: Market Value by Country, Total Invasive Vascular Closure Device Market, Europe, 2019 – 2029 (US$M) |
904 |
| Figure 23‑19: Small-Bore Vascular Closure Device Market, Europe, 2019 – 2029 |
905 |
| Figure 23‑20: Units Sold by Country, Small-Bore Vascular Closure Device Market, Europe, 2019 – 2029 |
906 |
| Figure 23‑21: Average Selling Price by Country, Small-Bore Vascular Closure Device Market, Europe, 2019 – 2029 (€) |
907 |
| Figure 23‑22: Average Selling Price by Country, Small-Bore Vascular Closure Device Market, Europe, 2019 – 2029 (US$) |
908 |
| Figure 23‑23: Market Value by Country, Small-Bore Vascular Closure Device Market, Europe, 2019 – 2029 (€M) |
909 |
| Figure 23‑24: Market Value by Country, Small-Bore Vascular Closure Device Market, Europe, 2019 – 2029 (US$M) |
910 |
| Figure 23‑25: Large-Bore Vascular Closure Device Market, Europe, 2019 – 2029 |
912 |
| Figure 23‑26: Units Sold by Country, Large-Bore Vascular Closure Device Market, Europe, 2019 – 2029 |
913 |
| Figure 23‑27: Average Selling Price by Country, Large-Bore Vascular Closure Device Market, Europe, 2019 – 2029 (€) |
914 |
| Figure 23‑28: Average Selling Price by Country, Large-Bore Vascular Closure Device Market, Europe, 2019 – 2029 (US$) |
915 |
| Figure 23‑29: Market Value by Country, Large-Bore Vascular Closure Device Market, Europe, 2019 – 2029 (€M) |
916 |
| Figure 23‑30: Market Value by Country, Large-Bore Vascular Closure Device Market, Europe, 2019 – 2029 (US$M) |
917 |
| Figure 23‑31: Non-Invasive Vascular Closure Device Market, Europe, 2019 – 2029 |
918 |
| Figure 23‑32: Units Sold by Country, Non-Invasive Vascular Closure Device Market, Europe, 2019 – 2029 |
919 |
| Figure 23‑33: Average Selling Price by Country, Non-Invasive Vascular Closure Device Market, Europe, 2019 – 2029 (€) |
920 |
| Figure 23‑34: Average Selling Price by Country, Non-Invasive Vascular Closure Device Market, Europe, 2019 – 2029 (US$) |
921 |
| Figure 23‑35: Market Value by Country, Non-Invasive Vascular Closure Device Market, Europe, 2019 – 2029 (€M) |
922 |
| Figure 23‑36: Market Value by Country, Non-Invasive Vascular Closure Device Market, Europe, 2019 – 2029 (US$M) |
923 |
| Figure 23‑37: Radial Vascular Closure Device Market, Europe, 2019 – 2029 |
924 |
| Figure 23‑38: Units Sold by Country, Radial Vascular Closure Device Market, Europe, 2019 – 2029 |
925 |
| Figure 23‑39: Average Selling Price by Country, Radial Vascular Closure Device Market, Europe, 2019 – 2029 (€) |
926 |
| Figure 23‑40: Average Selling Price by Country, Radial Vascular Closure Device Market, Europe, 2019 – 2029 (US$) |
927 |
| Figure 23‑41: Market Value by Country, Radial Vascular Closure Device Market, Europe, 2019 – 2029 (€M) |
928 |
| Figure 23‑42: Market Value by Country, Radial Vascular Closure Device Market, Europe, 2019 – 2029 (US$M) |
929 |
| Figure 23‑43: Femoral Vascular Closure Device Market, Europe, 2019 – 2029 |
930 |
| Figure 23‑44: Units Sold by Country, Femoral Vascular Closure Device Market, Europe, 2019 – 2029 |
931 |
| Figure 23‑45: Average Selling Price by Country, Femoral Vascular Closure Device Market, Europe, 2019 – 2029 (€) |
932 |
| Figure 23‑46: Average Selling Price by Country, Femoral Vascular Closure Device Market, Europe, 2019 – 2029 (US$) |
933 |
| Figure 23‑47: Market Value by Country, Femoral Vascular Closure Device Market, Europe, 2019 – 2029 (€M) |
934 |
| Figure 23‑48: Market Value by Country, Femoral Vascular Closure Device Market, Europe, 2019 – 2029 (US$M) |
935 |
| Figure 23‑49: Leading Competitors, Vascular Closure Device Market by Device Type, Europe, 2022 |
941 |
| Figure 23‑50: Leading Competitors, Vascular Closure Device Market by Approach, Europe, 2022 |
941 |
| Figure 24‑1: Transcatheter Embolization Market by Segment, Europe, 2019 – 2029 (€M) |
946 |
| Figure 24‑2: Transcatheter Embolization Market by Segment, Europe, 2019 – 2029 (US$M) |
947 |
| Figure 24‑3: Particle Embolization Market by Segment, Europe, 2019 – 2029 (€M) |
951 |
| Figure 24‑4: Particle Embolization Market by Segment, Europe, 2019 – 2029 (US$M) |
951 |
| Figure 24‑5: Particle Embolization Market, Europe, 2019 – 2029 |
952 |
| Figure 24‑6: Units Sold by Country, Particle Embolization Market, Europe, 2019 – 2029 |
953 |
| Figure 24‑7: Average Selling Price by Country, Particle Embolization Market, Europe, 2019 – 2029 (€) |
954 |
| Figure 24‑8: Average Selling Price by Country, Particle Embolization Market, Europe, 2019 – 2029 (US$) |
955 |
| Figure 24‑9: Market Value by Country, Particle Embolization Market, Europe, 2019 – 2029 (€M) |
956 |
| Figure 24‑10: Market Value by Country, Particle Embolization Market, Europe, 2019 – 2029 (US$M) |
957 |
| Figure 24‑11: PVA Particle Market, Europe, 2019 – 2029 |
958 |
| Figure 24‑12: Units Sold by Country, PVA Particle Market, Europe, 2019 – 2029 |
959 |
| Figure 24‑13: Average Selling Price by Country, PVA Particle Market, Europe, 2019 – 2029 (€) |
960 |
| Figure 24‑14: Average Selling Price by Country, PVA Particle Market, Europe, 2019 – 2029 (US$) |
961 |
| Figure 24‑15: Market Value by Country, PVA Particle Market, Europe, 2019 – 2029 (€M) |
962 |
| Figure 24‑16: Market Value by Country, PVA Particle Market, Europe, 2019 – 2029 (US$M) |
963 |
| Figure 24‑17: Microsphere Market, Europe, 2019 – 2029 |
964 |
| Figure 24‑18: Units Sold by Country, Microsphere Market, Europe, 2019 – 2029 |
965 |
| Figure 24‑19: Average Selling Price by Country, Microsphere Market, Europe, 2019 – 2029 (€) |
966 |
| Figure 24‑20: Average Selling Price by Country, Microsphere Market, Europe, 2019 – 2029 (US$) |
967 |
| Figure 24‑21: Market Value by Country, Microsphere Market, Europe, 2019 – 2029 (€M) |
968 |
| Figure 24‑22: Market Value by Country, Microsphere Market, Europe, 2019 – 2029 (US$M) |
969 |
| Figure 24‑23: Drug-Eluting Particle Market, Europe, 2019 – 2029 |
970 |
| Figure 24‑24: Units Sold by Country, Drug-Eluting Particle Market, Europe, 2019 – 2029 |
971 |
| Figure 24‑25: Average Selling Price by Country, Drug-Eluting Particle Market, Europe, 2019 – 2029 (€) |
972 |
| Figure 24‑26: Average Selling Price by Country, Drug-Eluting Particle Market, Europe, 2019 – 2029 (US$) |
973 |
| Figure 24‑27: Market Value by Country, Drug-Eluting Particle Market, Europe, 2019 – 2029 (€M) |
974 |
| Figure 24‑28: Market Value by Country, Drug-Eluting Particle Market, Europe, 2019 – 2029 (US$M) |
975 |
| Figure 24‑29: Radioactive Particle Market, Europe, 2019 – 2029 |
976 |
| Figure 24‑30: Units Sold by Country, Radioactive Particle Market, Europe, 2019 – 2029 |
977 |
| Figure 24‑31: Average Selling Price by Country, Radioactive Particle Market, Europe, 2019 – 2029 (€) |
978 |
| Figure 24‑32: Average Selling Price by Country, Radioactive Particle Market, Europe, 2019 – 2029 (US$) |
979 |
| Figure 24‑33: Market Value by Country, Radioactive Particle Market, Europe, 2019 – 2029 (€M) |
980 |
| Figure 24‑34: Market Value by Country, Radioactive Particle Market, Europe, 2019 – 2029 (US$M) |
981 |
| Figure 24‑35: Coil Embolization Market by Segment, Europe, 2019 – 2029 (€M) |
983 |
| Figure 24‑36: Coil Embolization Market by Segment, Europe, 2019 – 2029 (US$M) |
983 |
| Figure 24‑37: Total Coil Embolization Market, Europe, 2019 – 2029 |
984 |
| Figure 24‑38: Units Sold by Country, Total Coil Embolization Market, Europe, 2019 – 2029 |
985 |
| Figure 24‑39: Average Selling Price by Country, Total Coil Embolization Market, Europe, 2019 – 2029 (€) |
986 |
| Figure 24‑40: Average Selling Price by Country, Total Coil Embolization Market, Europe, 2019 – 2029 (US$) |
987 |
| Figure 24‑41: Market Value by Country, Total Coil Embolization Market, Europe, 2019 – 2029 (€M) |
988 |
| Figure 24‑42: Market Value by Country, Total Coil Embolization Market, Europe, 2019 – 2029 (US$M) |
989 |
| Figure 24‑43: Pushable Coil Market, Europe, 2019 – 2029 |
990 |
| Figure 24‑44: Units Sold by Country, Pushable Coil Market, Europe, 2019 – 2029 |
991 |
| Figure 24‑45: Average Selling Price by Country, Pushable Coil Market, Europe, 2019 – 2029 (€) |
992 |
| Figure 24‑46: Average Selling Price by Country, Pushable Coil Market, Europe, 2019 – 2029 (US$) |
993 |
| Figure 24‑47: Market Value by Country, Pushable Coil Market, Europe, 2019 – 2029 (€M) |
994 |
| Figure 24‑48: Market Value by Country, Pushable Coil Market, Europe, 2019 – 2029 (US$M) |
995 |
| Figure 24‑49: Detachable Coil Market, Europe, 2019 – 2029 |
996 |
| Figure 24‑50: Units Sold by Country, Detachable Coil Market, Europe, 2019 – 2029 |
997 |
| Figure 24‑51: Average Selling Price by Country, Detachable Coil Market, Europe, 2019 – 2029 (€) |
998 |
| Figure 24‑52: Average Selling Price by Country, Detachable Coil Market, Europe, 2019 – 2029 (US$) |
999 |
| Figure 24‑53: Market Value by Country, Detachable Coil Market, Europe, 2019 – 2029 (€M) |
1000 |
| Figure 24‑54: Market Value by Country, Detachable Coil Market, Europe, 2019 – 2029 (US$M) |
1001 |
| Figure 24‑55: Liquid Embolization Market, Europe, 2019 – 2029 |
1002 |
| Figure 24‑56: Units Sold by Country, Liquid Embolization Market, Europe, 2019 – 2029 |
1003 |
| Figure 24‑57: Average Selling Price by Country, Liquid Embolization Market, Europe, 2019 – 2029 (€) |
1004 |
| Figure 24‑58: Average Selling Price by Country, Liquid Embolization Market, Europe, 2019 – 2029 (US$) |
1005 |
| Figure 24‑59: Market Value by Country, Liquid Embolization Market, Europe, 2019 – 2029 (€M) |
1006 |
| Figure 24‑60: Market Value by Country, Liquid Embolization Market, Europe, 2019 – 2029 (US$M) |
1007 |
| Figure 24‑61: Plug Embolization Market, Europe, 2019 – 2029 |
1009 |
| Figure 24‑62: Units Sold by Country, Plug Embolization Market, Europe, 2019 – 2029 |
1010 |
| Figure 24‑63: Average Selling Price by Country, Plug Embolization Market, Europe, 2019 – 2029 (€) |
1011 |
| Figure 24‑64: Average Selling Price by Country, Plug Embolization Market, Europe, 2019 – 2029 (US$) |
1012 |
| Figure 24‑65: Market Value by Country, Plug Embolization Market, Europe, 2019 – 2029 (€M) |
1013 |
| Figure 24‑66: Market Value by Country, Plug Embolization Market, Europe, 2019 – 2029 (US$M) |
1014 |
| Figure 24‑67: Leading Competitors, Transcatheter Embolization Market, Europe, 2022 |
1021 |
| Figure 25‑1: Peripheral IVUS Market, Europe, 2019 – 2029 |
1026 |
| Figure 25‑2: Units Sold by Country, Peripheral IVUS Market, Europe, 2019 – 2029 |
1028 |
| Figure 25‑3: Average Selling Price by Country, Peripheral IVUS Market, Europe, 2019 – 2029 (€) |
1029 |
| Figure 25‑4: Average Selling Price by Country, Peripheral IVUS Market, Europe, 2019 – 2029 (US$) |
1030 |
| Figure 25‑5: Market Value by Country, Peripheral IVUS Market, Europe, 2019 – 2029 (€M) |
1031 |
| Figure 25‑6: Market Value by Country, Peripheral IVUS Market, Europe, 2019 – 2029 (US$M) |
1032 |
| Figure 25‑7: Leading Competitors, Peripheral IVUS Market, Europe, 2022 |
1036 |

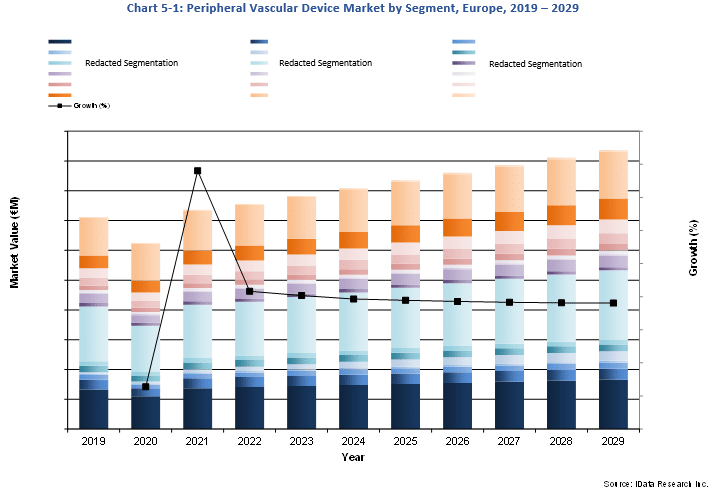 The IVL (Intravascular Lithotripsy) market in Europe in particular has experienced substantial growth in recent years. This innovative non-invasive technology utilizes sound waves to break down calcium buildup in arteries, providing a more efficient and less invasive alternative to traditional treatments for peripheral arterial disease. The increasing prevalence of peripheral artery disease and the growing demand for minimally invasive treatment options have contributed to the rising popularity of the IVL market in Europe.