| Figure 1‑1: Orthopedic Biomaterials Device Market Share Ranking by Segment, Global, 2024 |
| Figure 1‑2: Companies Researched in This Report (1 of 2) |
| Figure 1‑3: Companies Researched in This Report (2 of 2) |
| Figure 1‑4: Recent Events in the Orthopedic Biomaterials Device Market, Global, 2022 – 2024 (1 of 11) |
| Figure 1‑5: Recent Events in the Orthopedic Biomaterials Device Market, Global, 2022 – 2024 (3 of 11) |
| Figure 1‑6: Recent Events in the Orthopedic Biomaterials Device Market, Global, 2022 – 2024 (4 of 11) |
| Figure 1‑7: Recent Events in the Orthopedic Biomaterials Device Market, Global, 2022 – 2024 (5 of 11) |
| Figure 1‑8: Recent Events in the Orthopedic Biomaterials Device Market, Global, 2022 – 2024 (6 of 11) |
| Figure 1‑9: Recent Events in the Orthopedic Biomaterials Device Market, Global, 2022 – 2024 (7 of 11) |
| Figure 1‑10: Recent Events in the Orthopedic Biomaterials Device Market, Global, 2022 – 2024 (8 of 11) |
| Figure 1‑11: Recent Events in the Orthopedic Biomaterials Device Market, Global, 2022 – 2024 (9 of 11) |
| Figure 1‑12: Recent Events in the Orthopedic Biomaterials Device Market, Global, 2022 – 2024 (10 of 11) |
| Figure 1‑13: Recent Events in the Orthopedic Biomaterials Device Market, Global, 2022 – 2024 (11 of 11) |
| Figure 1‑14: Factors Impacting the Orthopedic Biomaterials Device Market by Segment, Global |
| Figure 1‑15: Orthopedic Biomaterial Procedure Segmentation |
| Figure 1‑16: Orthopedic Biomaterial Regions Covered, Global (1 of 2) |
| Figure 1‑17: Orthopedic Biomaterial Regions Covered, Global (2 of 2) |
| Figure 1‑18: Key Report Updates |
| Figure 1‑19: Version History |
| Figure 2‑1: Bone Graft Substitute Products by Company (1 of 4) |
| Figure 2‑2: Bone Graft Substitute Products by Company (2 of 4) |
| Figure 2‑3: Bone Graft Substitute Products by Company (3 of 4) |
| Figure 2‑4: Bone Graft Substitute Products by Company (4 of 4) |
| Figure 2‑5: Growth Factor Products by Company |
| Figure 2‑6: Cell Therapy Products by Company |
| Figure 2‑7: Hyaluronic Acid Viscosupplementation by Products by Company |
| Figure 2‑8: Cartilage Repair Products by Company |
| Figure 2‑9: Class 2 Device Recall GRAFTON DBM (Gel, Flex, Putty, Matrix, Crunch) |
| Figure 2‑10: Class 2 Device Recall GRAFTON PLUS DBM Paste |
| Figure 2‑11: Class 2 Device Recall Magnifuse Bone Graft |
| Figure 2‑12: Class 2 Device Recall Grafton DBF Inject |
| Figure 2‑13: Class 2 Device Recall OsteoSelect Demineralized Bone Matrix (DBM) Putty |
| Figure 2‑14: Class 2 Device Recall PROSTIM 10cc INJECTABLE |
| Figure 2‑15: Class 2 Device Recall Opteform Allograft Disc |
| Figure 2‑16: Class 2 Device Recall Bioactive Bone Graft Putty |
| Figure 2‑17: Class 3 Device Recall iFACTOR Peptide Enhanced Bone Graft Putty |
| Figure 2‑18: ACDF Using Structural Allograft vs. Tritanium C |
| Figure 2‑19: Clinical Study of Bone Graft Substitutes in Orthopaedic and Spinal Applications |
| Figure 2‑20: OSTEOAMP Lumbar Fusion Intra-Patient Controlled Study |
| Figure 2‑21: Rate of Bony Fusion Using NanoBone® Synthetic Bone Graft Versus Local Autologous Bone Graft. (BONE) |
| Figure 2‑22: Demineralized Bone Matrix Rotator Cuff Study |
| Figure 2‑23: Clinical Outcomes Associated with the Use of ViviGen® for the Treatment of Lumbar Degenerative Disc Disease |
| Figure 2‑24: The Effect of Bone-void Filler on Anterior Knee Pain Following ACL Reconstruction |
| Figure 2‑25: Long-term Safety and Effectiveness of AUGMENT® Injectable Bone Graft Compared to Autologous Bone Graft |
| Figure 2‑26: Transforaminal Lumbar Interbody Fusion (TLIF) |
| Figure 2‑27: A Post Market Surveillance on INFUSE Bone Graft |
| Figure 2‑28: Long-term Safety and Effectiveness of AUGMENT® Injectable Bone Graft Compared to Autologous Bone Graft |
| Figure 2‑29: Evaluation of the Effectiveness of AMPLEX® Compared to Autogenous Bone Grafts |
| Figure 2‑30: Effect of PRP, PPP, & BMAC on Functional Outcomes Following Hip Arthroscopy for Acetabular Labral Pathologies |
| Figure 2‑31: Bone Marrow Aspirate Concentrate (BMAC) vs Corticosteroid Injection |
| Figure 2‑32: BMAC & Allograft vs BMP-2 |
| Figure 2‑33: Bone Marrow Aspirate Concentrate (BMAC)Treatment for Knee Osteoarthritis (BMAC) |
| Figure 2‑34: Platelet Rich Plasma in Knee Osteoarthritis |
| Figure 2‑35: Platelet-Rich Plasma (PRP) for Treatment of Symptomatic Lumbar Facet Syndrome of the Spine |
| Figure 2‑36: A Prospective Study of Clinical Outcomes Following a Single Intradiscal Injection of Bone Marrow Aspirate Concentrate (BMAC) for Single Level Discogenic Low Back Pain |
| Figure 2‑37: ArtiAid® for Knee Osteoarthritis: A Post-market Study |
| Figure 2‑38: The Effectiveness of Different Doses of Hyaluronic Acid Injections in Knee Osteoarthritis |
| Figure 2‑39: Euflexxa for the Treatment of Osteoarthritis |
| Figure 2‑40: MONOVISC for Ankle Joint Pain Relief |
| Figure 2‑41: MONOVISC for Shoulder Joint Pain Relief |
| Figure 2‑42: MONOVISC for Hip Joint Pain Relief |
| Figure 2‑43: Comparison of Hyaluronic Acid and Platelet-Rich Plasma Injections |
| Figure 2‑44: Prospective Evaluation of ProChondrix CR for Repair of Articular Cartilage Defects on Femoral Condyle and Patella |
| Figure 2‑45: Osteochondral Allograft in the Surgical Treatment of Basal Joint Arthritis |
| Figure 2‑46: Phase 2 Clinical Trial of CartiLife® in the United States |
| Figure 2‑47: A Study to Evaluate the Efficacy of BioCartilage® Micronized Cartilage Matrix in Microfracture Treatment of Osteochondral Defects |
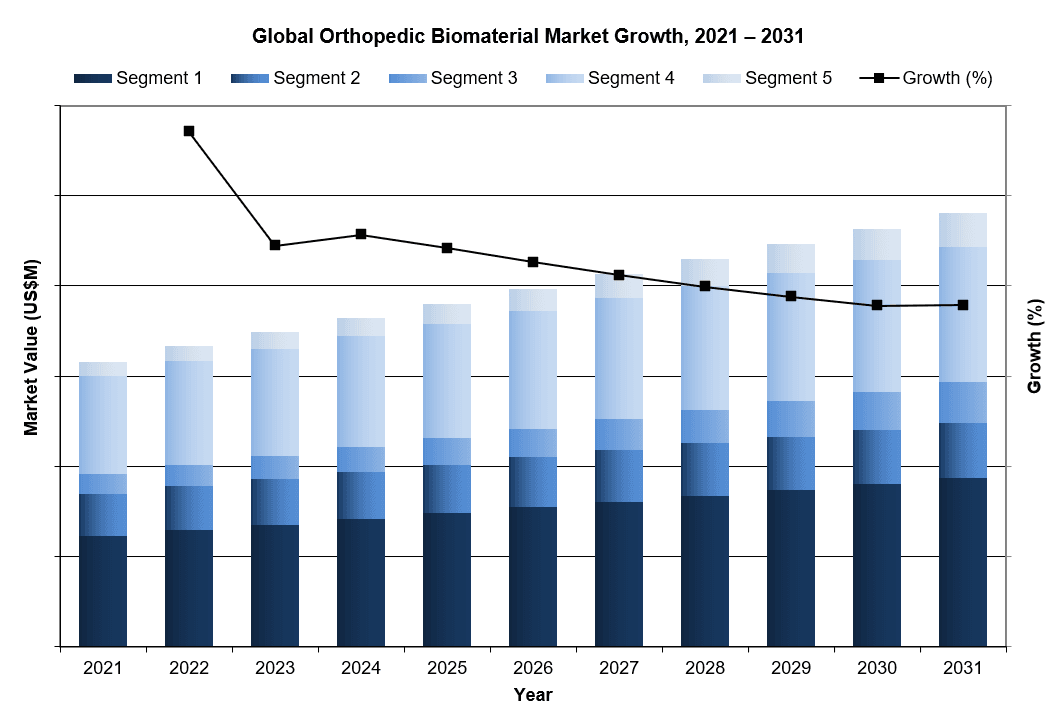
| Figure 3‑1: Orthopedic Biomaterials Device Market by Segment, Global, 2021 – 2031 (US$M) |
| Figure 3‑2: Orthopedic Biomaterials Device Market by Region, Global, 2021 – 2031 (US$M) |
| Figure 3‑3: Leading Competitors, Orthopedic Biomaterials Device Market by Segment, Global, 2024 |
| Figure 3‑4: Other Notable Competitors, Orthopedic Biomaterials Device Market by Segment, Global, 2024 |
| Figure 3‑5: SWOT Analysis, Arthrex |
| Figure 3‑6: SWOT Analysis, Biocomposites |
| Figure 3‑7: SWOT Analysis, Bioventus |
| Figure 3‑8: SWOT Analysis, DePuy Synthes |
| Figure 3‑9: SWOT Analysis, Ferring Pharmaceuticals |
| Figure 3‑10: SWOT Analysis, Fidia Farmaceutici |
| Figure 3‑11: SWOT Analysis, Harvest Technologies |
| Figure 3‑12: SWOT Analysis, Medtronic |
| Figure 3‑13: SWOT Analysis, MTF |
| Figure 3‑14: SWOT Analysis, Orthofix |
| Figure 3‑15: SWOT Analysis, Sanofi |
| Figure 3‑16: SWOT Analysis, Sanofi |
| Figure 3‑17: SWOT Analysis, Stryker |
| Figure 3‑18: SWOT Analysis, Vericel Corporation |
| Figure 3‑19: SWOT Analysis, Surgalign Holdings |
| Figure 3‑20: SWOT Analysis, Zimmer Biomet |
| Figure 4‑1: Orthopedic Bone Graft Substitute Regions Covered, Global (1 of 2) |
| Figure 4‑2: Orthopedic Bone Graft Substitute Regions Covered, Global (2 of 2) |
| Figure 4‑3: Orthopedic Bone Grafting Procedures by Segment, Global, 2021 – 2031 |
| Figure 4‑4: Orthopedic Bone Grafting Procedures by Region, Global, 2021 – 2031 |
| Figure 4‑5: Orthopedic Bone Grafting Procedures by Country, North America, 2021 – 2031 |
| Figure 4‑6: Orthopedic Bone Grafting Procedures by Country, Latin America, 2021 – 2031 (1 of 2) |
| Figure 4‑7: Orthopedic Bone Grafting Procedures by Country, Latin America, 2021 – 2031 (2 of 2) |
| Figure 4‑8: Orthopedic Bone Grafting Procedures by Country, Western Europe, 2021– 2031 |
| Figure 4‑9: Orthopedic Bone Grafting Procedures by Country, Central & Eastern Europe, 2021 – 2031 (1 of 2) |
| Figure 4‑10: Orthopedic Bone Grafting Procedures by Country, Central & Eastern Europe, 2021 – 2031 (2 of 2) |
| Figure 4‑11: Orthopedic Bone Grafting Procedures by Country, Middle East, 2021 – 2031 |
| Figure 4‑12: Orthopedic Bone Grafting Procedures by Country, Asia-Pacific, 2021– 2031 (1 of 3) |
| Figure 4‑13: Orthopedic Bone Grafting Procedures by Country, Asia-Pacific, 2021 – 2031 (2 of 3) |
| Figure 4‑14: Orthopedic Bone Grafting Procedures by Country, Asia-Pacific, 2021 – 2031 (3 of 3) |
| Figure 4‑15: Orthopedic Bone Grafting Procedures by Country, Africa, 2021 – 2031 |
| Figure 4‑16: Allograft Procedures by Region, Global, 2021– 2031 |
| Figure 4‑17: Allograft Procedures by Country, North America, 2021– 2031 |
| Figure 4‑18: Allograft Procedures by Country, Latin America, 2021– 2031 (1 of 2) |
| Figure 4‑19: Allograft Procedures by Country, Latin America, 2021– 2031 (2 of 2) |
| Figure 4‑20: Allograft Procedures by Country, Western Europe, 2021 – 2031 |
| Figure 4‑21: Allograft Procedures by Country, Central & Eastern Europe, 2021 – 2031 (1 of 2) |
| Figure 4‑22: Allograft Procedures by Country, Central & Eastern Europe, 2021 – 2031 (2 of 2) |
| Figure 4‑23: Allograft Procedures by Country, Middle East, 2021– 2031 |
| Figure 4‑24: Allograft Procedures by Country, Asia-Pacific, 2021 – 2031 (1 of 3) |
| Figure 4‑25: Allograft Procedures by Country, Asia-Pacific, 2021 – 2031 (2 of 3) |
| Figure 4‑26: Allograft Procedures by Country, Asia-Pacific, 2021 – 2031 (3 of 3) |
| Figure 4‑27: Allograft Procedures by Country, Africa, 2021– 2031 |
| Figure 4‑28: Demineralized Bone Matrix Procedures by Region, Global, 2021– 2031 |
| Figure 4‑29: Demineralized Bone Matrix Procedures by Country, North America, 2021– 2031 |
| Figure 4‑30: Demineralized Bone Matrix Procedures by Country, Latin America, 2021– 2031 (1 of 2) |
| Figure 4‑31: Demineralized Bone Matrix Procedures by Country, Latin America, 2021– 2031 (2 of 2) |
| Figure 4‑32: Demineralized Bone Matrix Procedures by Country, Western Europe, 2021 – 2031 |
| Figure 4‑33: Demineralized Bone Matrix Procedures by Country, Central & Eastern Europe, 2021 – 2031 (1 of 2) |
| Figure 4‑34: Demineralized Bone Matrix Procedures by Country, Central & Eastern Europe, 2021 – 2031 (2 of 2) |
| Figure 4‑35: Demineralized Bone Matrix Procedures by Country, Middle East, 2021 – 2031 |
| Figure 4‑36: Demineralized Bone Matrix Procedures by Country, Asia-Pacific, 2021– 2031 (1 of 3) |
| Figure 4‑37: Demineralized Bone Matrix Procedures by Country, Asia-Pacific, 2021– 2031 (2 of 3) |
| Figure 4‑38: Demineralized Bone Matrix Procedures by Country, Asia-Pacific, 2021 – 2031 (3 of 3) |
| Figure 4‑39: Demineralized Bone Matrix Procedures by Country, Africa, 2021 – 2031 |
| Figure 4‑40: Synthetic Procedures by Region, Global, 2021 – 2031 |
| Figure 4‑41: Synthetic Procedures by Country, North America, 2021 – 2031 |
| Figure 4‑42: Synthetic Procedures by Country, Latin America, 2021 – 2031 (1 of 2) |
| Figure 4‑43: Synthetic Procedures by Country, Latin America, 2021 – 2031 (2 of 2) |
| Figure 4‑44: Synthetic Procedures by Country, Western Europe, 2021– 2031 |
| Figure 4‑45: Synthetic Procedures by Country, Central & Eastern Europe, 2021 – 2031 (1 of 2) |
| Figure 4‑46: Synthetic Procedures by Country, Central & Eastern Europe, 2021 – 2031 (2 of 2) |
| Figure 4‑47: Synthetic Procedures by Country, Middle East, 2021 – 2031 |
| Figure 4‑48: Synthetic Procedures by Country, Asia-Pacific, 2021 – 2031 (1 of 3) |
| Figure 4‑49: Synthetic Procedures by Country, Asia-Pacific, 2021 – 2031 (2 of 3) |
| Figure 4‑50: Synthetic Procedures by Country, Asia-Pacific, 2021 – 2031 (3 of 3) |
| Figure 4‑51: Synthetic Procedures by Country, Africa, 2021 – 2031 |
| Figure 4‑52: Orthopedic Bone Graft Substitute Device Market by Segment, Global, 2021 – 2031 (US$M) |
| Figure 4‑53: Orthopedic Bone Graft Substitute Device Market by Region, Global, 2021 – 2031 (US$M) |
| Figure 4‑54: Orthopedic Bone Graft Substitute Market, Global, 2021 – 2031 |
| Figure 4‑55: Units Sold by Region, Orthopedic Bone Graft Substitute Market, Global, 2021 – 2031 |
| Figure 4‑56: Average Selling Price by Region, Orthopedic Bone Graft Substitute Market, Global, 2021– 2031 (US$) |
| Figure 4‑57: Market Value by Region, Orthopedic Bone Graft Substitute Market, Global, 2021 – 2031 (US$M) |
| Figure 4‑58: Allograft Bone Graft Substitute Market, Global, 2021 – 2031 |
| Figure 4‑59: Units Sold by Region, Allograft Bone Graft Substitute Market, Global, 2021 – 2031 |
| Figure 4‑60: Average Selling Price by Region, Allograft Bone Graft Substitute Market, Global, 2021 – 2031 (US$) |
| Figure 4‑61: Market Value by Region, Allograft Bone Graft Substitute Market, Global, 2021 – 2031 (US$M) |
| Figure 4‑62: Demineralized Bone Matrix Allograft Bone Graft Substitute Market, Global, 2021 – 2031 |
| Figure 4‑63: Units Sold by Region, Demineralized Bone Matrix Allograft Bone Graft Substitute Market, Global, 2021 – 2031 |
| Figure 4‑64: Average Selling Price by Region, Demineralized Bone Matrix Allograft Bone Graft Substitute Market, Global, 2021 – 2031 (US$) |
| Figure 4‑65: Market Value by Region, Demineralized Bone Matrix Allograft Bone Graft Substitute Market, Global, 2021 – 2031 (US$M) |
| Figure 4‑66: Synthetic Bone Graft Substitute Market, Global, 2021 – 2031 |
| Figure 4‑67: Units Sold by Region, Synthetic Bone Graft Substitute Market, Global, 2021 – 2031 |
| Figure 4‑68: Average Selling Price by Region, Synthetic Bone Graft Substitute Market, Global, 2021 – 2031 (US$) |
| Figure 4‑69: Market Value by Region, Synthetic Bone Graft Substitute Market, Global, 2021 – 2031 (US$M) |
| Figure 4‑70: Generation 1 Synthetic Bone Graft Substitute Market, Global, 2021 – 2031 |
| Figure 4‑71: Units Sold by Region, Generation 1 Synthetic Bone Graft Substitute Market, Global, 2021 – 2031 |
| Figure 4‑72: Average Selling Price by Region, Generation 1 Synthetic Bone Graft Substitute Market, Global, 2021 – 2031 (US$) |
| Figure 4‑73: Market Value by Region, Generation 1 Synthetic Bone Graft Substitute Market, Global, 2021 – 2031 (US$M) |
| Figure 4‑74: Generation 2 Synthetic Bone Graft Substitute Market, Global, 2021 – 2031 |
| Figure 4‑75: Units Sold by Region, Generation 2 Synthetic Bone Graft Substitute Market, Global, 2021 – 2031 |
| Figure 4‑76: Average Selling Price by Region, Generation 2 Synthetic Bone Graft Substitute Market, Global, 2021 – 2031 (US$) |
| Figure 4‑77: Market Value by Region, Generation 2 Synthetic Bone Graft Substitute Market, Global, 2021 – 2031 (US$M) |
| Figure 4‑78: Allograft Bone Graft Substitute Units Sold by Indication, Global, 2021 – 2031 |
| Figure 4‑79: Spine Allograft Bone Graft Substitute Units Sold, Global, 2021 – 2031 |
| Figure 4‑80: Trauma Allograft Bone Graft Substitute Units Sold, Global, 2021 – 2031 |
| Figure 4‑81: Large Joint Reconstruction Allograft Bone Graft Substitute Units Sold, Global, 2021– 2031 |
| Figure 4‑82: Demineralized Bone Matrix Allograft Bone Graft Substitute Units Sold by Indication, Global, 2021 – 2031 |
| Figure 4‑83: Spine Demineralized Bone Matrix Allograft Bone Graft Substitute Units Sold, Global, 2021 – 2031 |
| Figure 4‑84: Trauma Demineralized Bone Matrix Allograft Bone Graft Substitute Units Sold, Global, 2021 – 2031 |
| Figure 4‑85: Large Joint Reconstruction Demineralized Bone Matrix Allograft Bone Graft Substitute Units Sold, Global, 2021 – 2031 |
| Figure 4‑86: Synthetic Bone Graft Substitute Units Sold by Indication, Global, 2021 – 2031 |
| Figure 4‑87: Spine Synthetic Bone Graft Substitute Units Sold, Global, 2021 – 2031 |
| Figure 4‑88: Trauma Synthetic Bone Graft Substitute Units Sold, Global, 2021 – 2031 |
| Figure 4‑89: Large Joint Reconstruction Synthetic Bone Graft Substitute Units Sold, Global, 2021 – 2031 |
| Figure 4‑90: Leading Competitors, Orthopedic Bone Graft Substitute Market, Global, 2024 |
| Figure 5‑1: Orthopedic Growth Factor Regions Covered, Global (1 of 2) |
| Figure 5‑2: Orthopedic Growth Factor Regions Covered, Global (2 of 2) |
| Figure 5‑3: Orthopedic Growth Factor Procedures by Region, Global, 2024 – 2031 |
| Figure 5‑4: Orthopedic Growth Factor Procedures by Country, North America, 2021 – 2031 |
| Figure 5‑5: Orthopedic Growth Factor Procedures by Country, Latin America, 2021 – 2031 (1 of 2) |
| Figure 5‑6: Orthopedic Growth Factor Procedures by Country, Latin America, 2021 – 2031 (2 of 2) |
| Figure 5‑7: Orthopedic Growth Factor Procedures by Country, Western Europe, 2021 – 2031 |
| Figure 5‑8: Orthopedic Growth Factor Procedures by Country, Central & Eastern Europe, 2021 – 2031 (1 of 2) |
| Figure 5‑9: Orthopedic Growth Factor Procedures by Country, Central & Eastern Europe, 2021 – 2031 (2 of 2) |
| Figure 5‑10: Orthopedic Growth Factor Procedures by Country, Middle East, 2021 – 2031 |
| Figure 5‑11: Orthopedic Growth Factor Procedures by Country, Asia-Pacific, 2021 – 2031 (1 of 3) |
| Figure 5‑12: Orthopedic Growth Factor Procedures by Country, Asia-Pacific, 2021 – 2031 (2 of 3) |
| Figure 5‑13: Orthopedic Growth Factor Procedures by Country, Asia-Pacific, 2021 – 2031 (3 of 3) |
| Figure 5‑14: Orthopedic Growth Factor Procedures by Country, Africa, 2021 – 2031 |
| Figure 5‑15: Orthopedic Growth Factor Market, Global, 2021 – 2031 |
| Figure 5‑16: Units Sold by Region, Orthopedic Growth Factor Market, Global, 2021 – 2031 |
| Figure 5‑17: Average Selling Price by Region, Orthopedic Growth Factor Market, Global, 2021 – 2031 (US$) |
| Figure 5‑18: Market Value by Region, Orthopedic Growth Factor Market, Global, 2021 – 2031 (US$M) |
| Figure 5‑19: Cervical Disc Degeneration Growth Factor Units Sold by Region, Global, 2021 – 2031 |
| Figure 5‑20: Tibial Fracture Growth Factor Units Sold by Region, Global, 2021 – 2031 |
| Figure 5‑21: Spine Growth Factor Units Sold by Region, Global, 2021 – 2031 |
| Figure 5‑22: Ankle & Hindfoot Fusion Growth Factor Units Sold by Region, Global, 2021 – 2031 |
| Figure 5‑23: Leading Competitors, Orthopedic Growth Factor Market, Global, 2024 |
| Figure 6‑1: Orthopedic Cell Therapy Regions Covered, Global (1 of 2) |
| Figure 6‑2: Orthopedic Cell Therapy Regions Covered, Global (2 of 2) |
| Figure 6‑3: Orthopedic Cell Therapy Procedures by Segment, Global, 2021 – 2031 |
| Figure 6‑4: Orthopedic Cell Therapy Procedures by Region, Global, 2021 – 2031 |
| Figure 6‑5: Orthopedic Cell Therapy Procedures by Country, North America, 2021– 2031 |
| Figure 6‑6: Orthopedic Cell Therapy Procedures by Country, Latin America, 2021 – 2031 (1 of 2) |
| Figure 6‑7: Orthopedic Cell Therapy Procedures by Country, Latin America, 2021 – 2031 (2 of 2) |
| Figure 6‑8: Orthopedic Cell Therapy Procedures by Country, Western Europe, 2021 – 2031 |
| Figure 6‑9: Orthopedic Cell Therapy Procedures by Country, Central & Eastern Europe, 2021 – 2031 (1 of 2) |
| Figure 6‑10: Orthopedic Cell Therapy Procedures by Country, Central & Eastern Europe, 2021 – 2031 (2 of 2) |
| Figure 6‑11: Orthopedic Cell Therapy Procedures by Country, Middle East, 2021 – 2031 |
| Figure 6‑12: Orthopedic Cell Therapy Procedures by Country, Asia-Pacific, 2021 – 2031 (1 of 3) |
| Figure 6‑13: Orthopedic Cell Therapy Procedures by Country, Asia-Pacific, 2021 – 2031 (2 of 3) |
| Figure 6‑14: Orthopedic Cell Therapy Procedures by Country, Asia-Pacific, 2021 – 2031 (3 of 3) |
| Figure 6‑15: Orthopedic Cell Therapy Procedures by Country, Africa, 2021 – 2031 |
| Figure 6‑16: Orthopedic Platelet-Rich-Plasma Procedures by Region, Global, 2021 – 2031 |
| Figure 6‑17: Orthopedic Platelet-Rich-Plasma Procedures by Country, North America, 2021 – 2031 |
| Figure 6‑18: Orthopedic Platelet-Rich-Plasma Procedures by Country, Latin America, 2021 – 2031 (1 of 2) |
| Figure 6‑19: Orthopedic Platelet-Rich-Plasma Procedures by Country, Latin America, 2021 – 2031 (2 of 2) |
| Figure 6‑20: Orthopedic Platelet-Rich-Plasma Procedures by Country, Western Europe, 2021 – 2031 |
| Figure 6‑21: Orthopedic Platelet-Rich-Plasma Procedures by Country, Central & Eastern Europe, 2021 – 2031 (1 of 2) |
| Figure 6‑22: Orthopedic Platelet-Rich-Plasma Procedures by Country, Central & Eastern Europe, 2021 – 2031 (2 of 2) |
| Figure 6‑23: Orthopedic Platelet-Rich-Plasma Procedures by Country, Middle East, 2021 – 2031 |
| Figure 6‑24: Orthopedic Platelet-Rich-Plasma Procedures by Country, Asia-Pacific, 2021 – 2031 (1 of 3) |
| Figure 6‑25: Orthopedic Platelet-Rich-Plasma Procedures by Country, Asia-Pacific, 2021 – 2031 (2 of 3) |
| Figure 6‑26: Orthopedic Platelet-Rich-Plasma Procedures by Country, Asia-Pacific, 2021 – 2031 (3 of 3) |
| Figure 6‑27: Orthopedic Platelet-Rich-Plasma Procedures by Country, Africa, 2021 – 2031 |
| Figure 6‑28: Orthopedic Bone Marrow Aspirate Concentrate Procedures by Region, Global, 2021 – 2031 |
| Figure 6‑29: Orthopedic Bone Marrow Aspirate Concentrate Procedures by Country, North America, 2021 – 2031 |
| Figure 6‑30: Orthopedic Bone Marrow Aspirate Concentrate Procedures by Country, Latin America, 2021 – 2031 (1 of 2) |
| Figure 6‑31: Orthopedic Bone Marrow Aspirate Concentrate Procedures by Country, Latin America, 2021 – 2031 (2 of 2) |
| Figure 6‑32: Orthopedic Bone Marrow Aspirate Concentrate Procedures by Country, Western Europe, 2021 – 2031 |
| Figure 6‑33: Orthopedic Bone Marrow Aspirate Concentrate Procedures by Country, Central & Eastern Europe, 2021 – 2031 (1 of 2) |
| Figure 6‑34: Orthopedic Bone Marrow Aspirate Concentrate Procedures by Country, Central & Eastern Europe, 2021 – 2031 (2 of 2) |
| Figure 6‑35: Orthopedic Bone Marrow Aspirate Concentrate Procedures by Country, Middle East, 2021 – 2031 |
| Figure 6‑36: Orthopedic Bone Marrow Aspirate Concentrate Procedures by Country, Asia-Pacific, 2021 – 2031 (1 of 3) |
| Figure 6‑37: Orthopedic Bone Marrow Aspirate Concentrate Procedures by Country, Asia-Pacific, 2021 – 2031 (2 of 3) |
| Figure 6‑38: Orthopedic Bone Marrow Aspirate Concentrate Procedures by Country, Asia-Pacific, 2021 – 2031 (3 of 3) |
| Figure 6‑39: Orthopedic Bone Marrow Aspirate Concentrate Procedures by Country, Africa, 2021 – 2031 |
| Figure 6‑40: Orthopedic Cell Therapy Market by Segment, Global, 2021 – 2031 (US$M) |
| Figure 6‑41: Orthopedic Cell Therapy Market by Region, Global, 2021 – 2031 (US$M) |
| Figure 6‑42: Platelet-Rich Plasma Market, Global, 2021 – 2031 |
| Figure 6‑43: Units Sold by Region, Platelet-Rich Plasma Market, Global, 2021 – 2031 |
| Figure 6‑44: Average Selling Price by Region, Platelet-Rich Plasma Market, Global, 2021 – 2031 (US$) |
| Figure 6‑45: Market Value by Region, Platelet-Rich Plasma Market, Global, 2021 – 2031 (US$M) |
| Figure 6‑46: Bone Marrow Aspirate Concentrate Market, Global, 2021 – 2031 |
| Figure 6‑47: Units Sold by Region, Bone Marrow Aspirate Concentrate Market, Global, 2021 – 2031 |
| Figure 6‑48: Average Selling Price by Region, Bone Marrow Aspirate Concentrate Market, Global, 2021 – 2031 (US$) |
| Figure 6‑49: Market Value by Region, Bone Marrow Aspirate Concentrate Market, Global, 2021 – 2031 (US$M) |
| Figure 6‑50: Platelet-Rich Plasma Units Sold by Indication, Global, 2021 – 2031 |
| Figure 6‑51: Bone Marrow Aspirate Concentrate Units Sold by Indication, Global, 2021 – 2031 |
| Figure 6‑52: Leading Competitors, Orthopedic Cell Therapy Market, Global, 2024 |
| Figure 7‑1: Hyaluronic Acid Viscosupplementation Regions Covered, Global (1 of 2) |
| Figure 7‑2: Hyaluronic Acid Viscosupplementation Regions Covered, Global (2 of 2) |
| Figure 7‑3: Orthopedic Hyaluronic Acid Viscosupplementation Procedures by Region, Global, 2021 – 2031 |
| Figure 7‑4: Orthopedic Hyaluronic Acid Viscosupplementation Procedures by Country, North America, 2021 – 2031 |
| Figure 7‑5: Orthopedic Hyaluronic Acid Viscosupplementation Procedures by Country, Latin America, 2021 – 2031 (1 of 2) |
| Figure 7‑6: Orthopedic Hyaluronic Acid Viscosupplementation Procedures by Country, Latin America, 2021 – 2031 (2 of 2) |
| Figure 7‑7: Orthopedic Hyaluronic Acid Viscosupplementation Procedures by Country, Western Europe, 2021 – 2031 |
| Figure 7‑8: Orthopedic Hyaluronic Acid Viscosupplementation Procedures by Country, Central & Eastern Europe, 2021 – 2031 (1 of 2) |
| Figure 7‑9: Orthopedic Hyaluronic Acid Viscosupplementation Procedures by Country, Central & Eastern Europe, 2021 – 2031 (2 of 2) |
| Figure 7‑10: Orthopedic Hyaluronic Acid Viscosupplementation Procedures by Country, Middle East, 2021 – 2031 |
| Figure 7‑11: Orthopedic Hyaluronic Acid Viscosupplementation Procedures by Country, Asia-Pacific, 2021 – 2031 (1 of 3) |
| Figure 7‑12: Orthopedic Hyaluronic Acid Viscosupplementation Procedures by Country, Asia-Pacific, 2021 – 2031 (2 of 3) |
| Figure 7‑13: Orthopedic Hyaluronic Acid Viscosupplementation Procedures by Country, Asia-Pacific, 2021 – 2031 (3 of 3) |
| Figure 7‑14: Orthopedic Hyaluronic Acid Viscosupplementation Procedures by Country, Africa, 2021 – 2031 |
| Figure 7‑15: Hyaluronic Acid Viscosupplementation Device Market by Segment, Global, 2021 – 2031 (US$M) |
| Figure 7‑16: Hyaluronic Acid Viscosupplementation Device Market by Region, Global, 2021 – 2031 (US$M) |
| Figure 7‑17: Hyaluronic Acid Viscosupplementation Market, Global, 2021 – 2031 |
| Figure 7‑18: Units Sold by Region, Hyaluronic Acid Viscosupplementation Market, Global, 2021 – 2031 |
| Figure 7‑19: Average Selling Price by Region, Hyaluronic Acid Viscosupplementation Market, Global, 2021 – 2031 (US$) |
| Figure 7‑20: Market Value by Region, Hyaluronic Acid Viscosupplementation Market, Global, 2021 – 2031 (US$M) |
| Figure 7‑21: Single-Injection Hyaluronic Acid Viscosupplementation Market, Global, 2021 – 2031 |
| Figure 7‑22: Units Sold by Region, Single-Injection Hyaluronic Acid Viscosupplementation Market, Global, 2021 – 2031 |
| Figure 7‑23: Average Selling Price by Region, Single-Injection Hyaluronic Acid Viscosupplementation Market, Global, 2021 – 2031 (US$) |
| Figure 7‑24: Market Value by Region, Single-Injection Hyaluronic Acid Viscosupplementation Market, Global, 2021 – 2031 (US$M) |
| Figure 7‑25: Two-Injection Hyaluronic Acid Viscosupplementation Market, Global, 2021 – 2031 |
| Figure 7‑26: Units Sold by Region, Two-Injection Hyaluronic Acid Viscosupplementation Market, Global, 2021 – 2031 |
| Figure 7‑27: Average Selling Price by Region, Two-Injection Hyaluronic Acid Viscosupplementation Market, Global, 2021 – 2031 (US$) |
| Figure 7‑28: Market Value by Region, Two-Injection Hyaluronic Acid Viscosupplementation Market, Global, 2021 – 2031 (US$M) |
| Figure 7‑29: Three-Injection Hyaluronic Acid Viscosupplementation Market, Global, 2021 – 2031 |
| Figure 7‑30: Units Sold by Region, Three-Injection Hyaluronic Acid Viscosupplementation Market, Global, 2021 – 2031 |
| Figure 7‑31: Average Selling Price by Region, Three-Injection Hyaluronic Acid Viscosupplementation Market, Global, 2021 – 2031 (US$) |
| Figure 7‑32: Market Value by Region, Three-Injection Hyaluronic Acid Viscosupplementation Market, Global, 2021 – 2031 (US$M) |
| Figure 7‑33: Five-Injection Hyaluronic Acid Viscosupplementation Market, Global, 2021 – 2031 |
| Figure 7‑34: Units Sold by Region, Five-Injection Hyaluronic Acid Viscosupplementation Market, Global, 2021 – 2031 |
| Figure 7‑35: Average Selling Price by Region, Five-Injection Hyaluronic Acid Viscosupplementation Market, Global, 2021– 2031 (US$) |
| Figure 7‑36: Market Value by Region, Five-Injection Hyaluronic Acid Viscosupplementation Market, Global, 2021 – 2031 (US$M) |
| Figure 7‑37: Leading Competitors, Hyaluronic Acid Viscosupplementation Market, Global, 2024 |
| Figure 8‑1: Orthopedic Cartilage Repair Regions Covered, Global (1 of 2) |
| Figure 8‑2: Orthopedic Cartilage Repair Regions Covered, Global (2 of 2) |
| Figure 8‑3: Orthopedic Cartilage Repair Procedures by Segment, Global, 2021 – 2031 |
| Figure 8‑4: Orthopedic Cartilage Repair Procedures by Region, Global, 2021 – 2031 |
| Figure 8‑5: Osteochondral Allograft Procedures by Region, Global, 2021 – 2031 |
| Figure 8‑6: Meniscal Allograft Procedures by Region, Global, 2021 – 2031 |
| Figure 8‑7: Autologous Chondrocyte Implantation Procedures by Region, Global, 2021 – 2031 |
| Figure 8‑8: Osteochondral Autograft Procedures by Region, Global, 2021 – 2031 |
| Figure 8‑9: Orthopedic Cartilage Repair Device Market by Segment, Global, 2021 – 2031 (US$M) |
| Figure 8‑10: Orthopedic Cartilage Repair Device Market by Region, Global, 2021 – 2031 (US$M) |
| Figure 8‑11: Orthopedic Cartilage Repair Market, Global, 2021 – 2031 |
| Figure 8‑12: Units Sold by Region, Orthopedic Cartilage Repair Market, Global, 2021 – 2031 |
| Figure 8‑13: Average Selling Price by Region, Orthopedic Cartilage Repair Market, Global, 2021 – 2031 (US$) |
| Figure 8‑14: Market Value by Region, Orthopedic Cartilage Repair Market, Global, 2021 – 2031 (US$M) |
| Figure 8‑15: Osteochondral Allograft Market, Global, 2021 – 2031 |
| Figure 8‑16: Units Sold by Region, Osteochondral Allograft Market, Global, 2021 – 2031 |
| Figure 8‑17: Average Selling Price by Region, Osteochondral Allograft Market, Global, 2021 – 2031 (US$) |
| Figure 8‑18: Market Value by Region, Osteochondral Allograft Market, Global, 2021 – 2031 (US$M) |
| Figure 8‑19: Meniscal Allograft Market, Global, 2021 – 2031 |
| Figure 8‑20: Units Sold by Region, Meniscal Allograft Market, Global, 2021 – 2031 |
| Figure 8‑21: Average Selling Price by Region, Meniscal Allograft Market, Global, 2021 – 2031 (US$) |
| Figure 8‑22: Market Value by Region, Meniscal Allograft Market, Global, 2021 – 2031 (US$M) |
| Figure 8‑23: Autologous Chondrocyte Implantation Market, Global, 2021– 2031 |
| Figure 8‑24: Units Sold by Region, Autologous Chondrocyte Implantation Market, Global, 2021 – 2031 |
| Figure 8‑25: Average Selling Price by Region, Autologous Chondrocyte Implantation Market, Global, 2021 – 2031 (US$) |
| Figure 8‑26: Market Value by Region, Autologous Chondrocyte Implantation Market, Global, 2021 – 2031 (US$M) |
| Figure 8‑27: Osteochondral Autograft Market, Global, 2021 – 2031 |
| Figure 8‑28: Units Sold by Region, Osteochondral Autograft Market, Global, 2021 – 2031 |
| Figure 8‑29: Average Selling Price by Region, Osteochondral Autograft Market, Global, 2021 – 2031 (US$) |
| Figure 8‑30: Market Value by Region, Osteochondral Autograft Market, Global, 2021 – 2031 (US$M) |
| Figure 8‑31: Leading Competitors, Cartilage Repair Market, Global, 2024 |