Orthopedic Biomaterials Market Size, Share & Trends Analysis | United States | 2024-2030 | MedSuite | Includes: Bone Graft Substitutes, Orthopedic Growth Factors, Cellular Allografts, and 3 more

  • Year: 2024
  • Scope: 10 Years
  • Region: United States
  • Pages: 388
  • Published Date: 05/29/2024
  • Type: MedSuite

Product Description

Overall, the U.S. orthopedic biomaterials market was valued at over $5.0 billion in 2023. This is expected to increase over the forecast period at a CAGR of 5.3% to reach over $7.2 billion.

The full report suite on the U.S. market for orthopedic biomaterials includes bone graft substitutes, which are represented by allografts, demineralized bone matrices (DBMs), xenografts and synthetic bone graft markets. The report also includes orthopedic growth factors; cellular allografts; orthopedic cell therapy, represented by bone marrow aspirate concentrate and platelet-rich plasma; hyaluronic acid (HA) viscosupplementation in single-, two-, three- and five-injection cycles; and, finally, orthopedic cartilage repair. Cartilage repair is represented by the osteochondral allograft, meniscal allograft, autologous chondrocyte implantation, particulated juvenile allograft and microfracture adjunct segments.

MARKET REPORT DATA TYPES INCLUDED

  • Unit Sales, Procedure Numbers, Average Selling Prices, Market Value & Growth Trends
  • 10 Year Scope
  • Market Drivers & Limiters for Each Segment
  • Competitive Analysis with Market Shares for Each Segment
  • Recent Mergers & Acquisitions
  • Disease Overviews and Demographic Information
  • Company Profiles, Product Portfolios and SWOT for Top Competitors

U.S. ORTHOPEDIC BIOMATERIALS MARKET INSIGHTS

u.s. orthopedic biomaterials market

The orthopedic biomaterials market is significantly influenced by demographic trends, particularly the aging population and the rising incidence of osteoarthritis (OA) in the spine. Spinal fusion procedures are increasingly driven by the growing number of OA cases, which correlate with advancing age. With the first wave of baby boomers beginning to retire in 2008, the population at risk for degenerative diseases has expanded, heightening the demand for treatments such as bone grafts.

As the elderly population continues to grow and obesity rates remain high, the prevalence of degenerative diseases is expected to rise. This demographic shift underscores a stronger need for orthopedic biomaterials and restorative procedures. Consequently, these factors are projected to drive market growth throughout the forecast period.

U.S. ORTHOPEDIC BIOMATERIALS MARKET SHARE INSIGHTS

Overall, within the U.S. orthopedic biomaterials market there are three dominant competitors: Medtronic, DePuy Synthes, and Stryker.U.S. Orthopedic Biomaterials Market

Medtronic maintained its leading position in the orthopedic biomaterials market in 2023, dominating both the bone graft substitute segment and the growth factor market with its successful INFUSE™ product.

DePuy Synthes held the second-largest market share, a position it has maintained for several years. The company showed significant traction in the bone graft substitute and cellular allograft segments. It also distributed the leading hyaluronic acid product. DePuy Synthes offers a DBM product processed by the Musculoskeletal Transplant Foundation (MTF) and the DBX® product line, which complements its spinal hardware business. The DBX line includes an osteoinductive and osteoconductive bone graft substitute combined with DBM. Additionally, DePuy Synthes distributes Monovisc® and Orthovisc®, single- and three-injection hyaluronic acid products manufactured by Anika Therapeutics.

Stryker secured the third-largest market share, bolstered by its extensive product portfolio in the bone graft substitute, growth factor, and cellular allograft markets. This position was largely achieved through strategic acquisitions of several previous competitors

MARKET SEGMENTATION SUMMARY

  • U.S. Orthopedic Bone Graft Substitute Market – MedCore – Includes:
    • Material Type: Autograft, Allograft, Xenograft, Demineralized Bone Matrix, Synthetic.
  • U.S. Orthopedic Growth Factor Market– MedCore – Includes:
    • Indication Type: Cervical disc Degeneration, Tibial, Spinal, Ankle & Hindfoot.
    • Care Setting: Hospital, Non-Hospital.
  • U.S. Orthopedic Cellular Allograft Market– MedCore – Includes:
    • Anatomy Type: Cervical Spine, Lumbar Spine, Foot & Ankle Allograft, Trauma Allograft.
    • Patient Type: Pediatric/Neonatal, Adult.
    • Care Setting: Hospital, Non-Hospital.
  • U.S. Orthopedic Cell Therapy Market– MedCore – Includes:
    • Material Type: Platelet-Rich Plasma, Bone Marrow Aspirate Concentrate.
    • Patient Type: Pediatric/Neonatal, Adult.
  • U.S. Hyaluronic Acid Viscosupplementation Market – MedCore – Includes:
    • Injection Cycle Type: Single, Two, Three, Five-Injection.
    • Patient Type: Pediatric/Neonatal, Adult.
    • Care Setting: Hospital, Non-Hospital.
  • U.S. Orthopedic Cartilage Repair Market– MedCore – Includes:
    • Treatment Type: Microfracture, OATS, Osteochondral Allograft, Meniscal Allograft, Autologous Chondrocyte Implantation, Particulated Juvenile Allograft, Microfracture Adjunct.
    • Patient Type: Pediatric/Neonatal, Adult.
    • Care Setting: Hospital, Non-Hospital.

Research Scope Summary

Report Attribute Details
Regions United States
Base Year 2023
Forecast 2024-2030
Historical Data 2020-2022
Quantitative Coverage Market Size, Market Shares, Market Forecasts, Market Growth Rates, Units Sold, and Average Selling Prices.
Qualitative Coverage COVID-19 Impact, Market Growth Trends, Market Limiters, Competitive Analysis & SWOT for Top Competitors, Mergers & Acquisitions, Company Profiles, Product Portfolios, FDA Recalls, Disruptive Technologies, Disease Overviews.
Data Sources Primary Interviews with Industry Leaders, Government Physician Data, Regulatory Data, Hospital Private Data, Import & Export Data, iData Research Internal Database.


FREE Sample Report

TABLE of CONTENTS
List of Figures
List of Charts
executive summary
U.S. Orthopedic Biomaterials Market Overview
Competitive Analysis
Market Trends
Market Developments
Procedures Included
Procedure Codes Investigated
Markets Included
Key Report Updates
Version History
research methodology
Step 1: Project Initiation & Team Selection
Step 2: Prepare Data Systems and Perform Secondary Research
Step 3: Preparation for Interviews & Questionnaire Design
Step 4: Performing Primary Research
Step 5: Research Analysis: Establishing Baseline Estimates
Step 6: Market Forecast and Analysis
Step 7: Identify Strategic Opportunities
Step 8: Final Review and Market Release
Step 9: Customer Feedback and Market Monitoring
impact of covid-19 on THE U.S. Orthopedic Biomaterials Market
2.1 Introduction
2.2 Analysis By Market Segment
2.2.1 Worst Case Scenario
2.2.2 Base Case Scenario
2.2.3 Best Case Scenario
Overview
3.1 Introduction
Product Assessment
4.1 Introduction
4.2 Product Portfolios
4.2.1 Bone Graft Substitutes
4.2.2 Growth Factors
4.2.2.1.1 NELL-1 Bone Biologics
4.2.2.1.2 INFUSE® by Medtronic
4.2.2.1.3 OsteoAMP® by Bioventus Surgical
4.2.2.1.4 OP-1™ by Stryker/Olympus Biotech (Delisted)
4.2.2.1.5 The Osteogrow Study
4.2.2.1.6 AUGMENT® Bone Graft
4.2.2.1.7 Amplex® Osteobiologic Bone Graft Substitute
4.2.2.1.8 i-Factor™ Peptide Bone Matrix
4.2.3 Cellular Allografts
4.2.4 Cell Therapy
4.2.4.1 Platelet-Rich Plasma
4.2.4.2 Bone Marrow Aspirate Concentrate
4.2.5 Hyaluronic Acid Viscosupplementation (HAV)
4.2.6 Cartilage Repair
4.3 Regulatory Issues and Recalls
4.3.1 Bone Graft Substitute Market FDA Recalls
4.3.2 Growth Factor Market FDA Recalls
4.4 Clinical Trials
4.4.1 Bone Graft Substitute Market Clinical Trials
4.4.2 Growth Factor Market Clinical Trials
4.4.3 Cellular Allograft Market Clinical Trials
4.4.4 Cell Therapy Market Clinical Trials
4.4.5 Hyaluronic Acid Viscosupplementation Market
4.4.6 Cartilage Repair Market Clinical Trials
U.S. Orthopedic Biomaterials Market Overview
5.1 Introduction
5.1.1 Bone Graft Substitutes
5.1.2 Growth Factors
5.1.3 Cellular Allografts
5.1.4 Cell Therapies
5.1.5 Hyaluronic Acid (HA) Viscosupplementation
5.1.6 Cartilage Repair
5.2 Market Overview & Trend Analysis
5.3 Drivers and Limiters
5.3.1 Market Drivers
5.3.2 Market Limiters
5.4 Competitive Market Share Analysis
5.5 Mergers and Acquisitions
5.6 Company Profiles
5.6.1 Arthrex
5.6.2 Biocomposites
5.6.3 Bioventus
5.6.4 DePuy Synthes
5.6.5 Ferring Pharmaceuticals
5.6.6 Isto Biologics
5.6.7 Medtronic
5.6.8 MTF
5.6.9 NuVasive
5.6.10 Orthofix
5.6.11 Sanofi
5.6.12 Stryker
5.6.13 Terumo
5.6.14 Vericel
5.6.15 Zimmer Biomet
5.7 SWOT Analysis
5.7.1 Arthrex
5.7.2 Biocomposites
5.7.3 Bioventus
5.7.4 DePuy Synthes
5.7.5 Ferring Pharmaceuticals
5.7.6 Isto Biologics
5.7.7 Medtronic
5.7.8 MTF
5.7.9 NuVasive
5.7.10 Orthofix
5.7.11 Sanofi
5.7.12 Stryker
5.7.13 Terumo
5.7.14 Vericel
5.7.15 Zimmer Biomet
Procedure Numbers
6.1 Introduction
6.2 Procedures
6.2.1 Total Orthopedic Biomaterial Procedures by Segment
6.2.2 Orthopedic Bone Grafting Procedures
6.2.2.1 Orthopedic Bone Grafting Procedures by Material
6.2.2.2 Orthopedic Bone Grafting Procedures by Indication
6.2.2.2.1 Average Units Used per Procedure by Indication
6.2.2.2.2 Autograft Procedures by Indication
6.2.2.2.3 Allograft Procedures by Indication
6.2.2.2.4 Xenograft Procedures by Indication
6.2.2.2.5 DBM Procedures by Indication
6.2.2.2.6 Synthetic Procedures by Indication
6.2.2.3 Orthopedic Bone Grafting Procedures by Patient Type
6.2.2.3.1 Allograft Procedures by Patient Type
6.2.2.3.2 Xenograft Procedures by Patient Type
6.2.2.3.3 DBM Procedures by Patient Type
6.2.2.3.4 Synthetic Procedures by Patient Type
6.2.2.4 Orthopedic Bone Grafting Procedures by Care Setting
6.2.3 Orthopedic Growth Factor Procedures
6.2.3.1 Orthopedic Growth Factor Procedures by Indication
6.2.3.2 Orthopedic Growth Factor Procedures by Care Setting
6.2.4 Orthopedic Cellular Allograft Procedures
6.2.4.1 Cellular Allograft Procedures by Anatomy
6.2.4.2 Cellular Allograft Procedures by Patient Type
6.2.4.1 Cellular Allograft Procedures by Care Setting
6.2.5 Orthopedic Cell Therapy Procedures
6.2.5.1 Orthopedic Cell Therapy Procedures by Material Type
6.2.5.2 Platelet-Rich Plasma Procedures by Indication
6.2.5.3 Bone Marrow Aspirate Concentrate Procedures by Indication
6.2.5.4 Orthopedic Cell Therapy Procedures by Patient Type
6.2.5.1 Orthopedic Cell Therapy Procedures by Care Setting
6.2.6 Hyaluronic Acid Viscosupplementation Procedures
6.2.6.1 Hyaluronic Acid Viscosupplementation Procedures by Injection Cycle
6.2.6.2 Hyaluronic Acid Viscosupplementation Procedures by Patient Type
6.2.6.1 Hyaluronic Acid Viscosupplementation Procedures by Care Setting
6.2.7 Orthopedic Cartilage Repair Procedures
6.2.7.1 Orthopedic Cartilage Repair Procedures by Type
6.2.7.2 Orthopedic Cartilage Repair Procedures by Patient Type
6.2.7.3 Orthopedic Cartilage Repair Procedures by Care Setting
Orthopedic Bone Graft Substitute Market
7.1 Introduction
7.1.1 Units per Procedure by Indication
7.2 Market Overview
7.2.1 Orthopedic Bone Graft Substitute Market by Material
7.2.2 Orthopedic Bone Graft Substitute Market by Indication
7.3 Market Analysis and Forecast
7.3.1 Orthopedic Bone Graft Substitute Market
7.3.2 Allograft Bone Graft Substitute Market
7.3.3 Xenograft Bone Graft Substitute Market
7.3.4 Demineralized Bone Matrix Allograft Bone Graft Substitute Market
7.3.5 Synthetic Bone Graft Substitute Market
7.3.5.1 Synthetic Bone Graft Substitute Market by Generation Type
7.3.5.1.1 Generation 1 Synthetic Bone Graft Substitute Market
7.3.5.1.2 Generation 2 Synthetic Bone Graft Substitute Market
7.4 Unit Analysis
7.4.1 Allograft Bone Graft Substitute Unit Analysis
7.4.1.1 Allograft Bone Graft Substitute Units Sold by Indication
7.4.1.2 Allograft Bone Graft Substitute Units Sold by Patient Type
7.4.1.3 Allograft Bone Graft Substitute Units Sold by Setting
7.4.1.4 Allograft Bone Graft Substitute Units Sold by Product Type
7.4.2 Xenograft Bone Graft Substitute Unit Analysis
7.4.2.1 Xenograft Bone Graft Substitute Units Sold by Indication
7.4.2.2 Xenograft Bone Graft Substitute Units Sold by Patient Type
7.4.2.3 Xenograft Bone Graft Substitute Units Sold by Setting
7.4.2.4 Xenograft Bone Graft Substitute Units Sold by Product Type
7.4.3 Demineralized Bone Matrix Allograft Bone Graft Substitute Unit Analysis
7.4.3.1 Demineralized Bone Matrix Allograft Bone Graft Substitute Units Sold Breakout by Carrier Status
7.4.3.1.1 DBM with Carriers Market
7.4.3.1.2 DBM without Carriers Market
7.4.3.2 Demineralized Bone Matrix Allograft Bone Graft Substitute Units Sold by Indication
7.4.3.3 Demineralized Bone Matrix Allograft Bone Graft Substitute Units Sold by Patient Type
7.4.3.4 Demineralized Bone Matrix Allograft Bone Graft Substitute Units Sold by Setting
7.4.3.5 Demineralized Bone Matrix Allograft Bone Graft Substitute Units Sold by Product Type
7.4.4 Synthetic Bone Graft Substitute Unit Analysis
7.4.4.1 Synthetic Bone Graft Substitute Units Sold by Indication
7.4.4.2 Synthetic Bone Graft Substitute Units Sold by Patient Type
7.4.4.3 Synthetic Bone Graft Substitute Units Sold by Setting
7.4.4.4 Synthetic Bone Graft Substitute Units Sold by Product Type
7.5 Drivers and Limiters
7.5.1 Allograft Market
7.5.1.1 Market Drivers
7.5.1.2 Market Limiters
7.5.2 Xenograft Market
7.5.2.1 Market Drivers
7.5.2.2 Market Limiters
7.5.3 Demineralized Bone Matrix Bone Graft Substitute Market
7.5.3.1 Market Drivers
7.5.3.2 Market Limiters
7.5.4 Synthetic Bone Graft Substitute Market
7.5.4.1 Market Drivers
7.5.4.2 Market Limiters
7.6 Competitive Market Share Analysis
Orthopedic Growth Factor Market
8.1 Introduction
8.1.1 BMP-2 (Medtronic)
8.1.2 PDGF-BB (Wright Medical)
8.1.3 BMP-7 (Ember Therapeutics)
8.1.4 P-15 Synthetic Small Peptide (Cerapedics)
8.2 Market Overview
8.3 Market Analysis and Forecast
8.3.1 Orthopedic Growth Factor Market
8.3.2 Cervical Disc Degeneration Orthopedic Growth Factor Market
8.3.3 Tibial Fracture Orthopedic Growth Factor Market
8.3.4 Spine Orthopedic Growth Factor Market
8.3.5 Ankle and Hindfoot Fusion Orthopedic Growth Factor Market
8.4 Unit Analysis
8.4.1 Cervical Disc Degeneration Growth Factor Units Sold by Setting
8.4.2 Tibial Fracture Growth Factor Units Sold by Setting
8.4.3 Spine Growth Factor Units Sold by Setting
8.4.4 Ankle and Hindfoot Fusion Growth Factor Units Sold by Setting
8.5 Drivers and Limiters
8.5.1 Market Drivers
8.5.2 Market Limiters
8.6 Competitive Market Share Analysis
orthopedic Cellular Allograft Market
9.1 Introduction
9.1.1 Lineage
9.1.1.1 Human Embryonic Stem Cells (hESC)
9.1.1.2 Mesenchymal Stem Cells (MSC)
9.1.2 Other Therapeutic Applications
9.2 Market Overview
9.3 Market Analysis and Forecast
9.3.1 Orthopedic Cellular Allograft Market
9.3.2 Cervical Spine Orthopedic Cellular Allograft Market
9.3.3 Lumbar Spine Orthopedic Cellular Allograft Market
9.3.4 Foot and Ankle Cellular Allograft Market
9.3.5 Trauma Cellular Allograft Market
9.4 Drivers and Limiters
9.4.1 Market Drivers
9.4.2 Market Limiters
9.5 Competitive Market Share Analysis
Orthopedic Cell Therapy Market
10.1 Introduction
10.2 Market Overview
10.3 Market Analysis and Forecast
10.3.1 Platelet-Rich Plasma Market
10.3.2 Bone Marrow Aspirate Concentrate Market
10.4 Unit Analysis
10.4.1 Platelet-Rich Plasma Units Sold by Indication Anatomy
10.4.2 Bone Marrow Aspirate Concentrate Units Sold by Indication Anatomy
10.5 Drivers and Limiters
10.5.1 Market Drivers
10.5.2 Market Limiters
10.6 Competitive Market Share Analysis
Hyaluronic Acid Viscosupplementation Market
11.1 Introduction
11.1.1 Benefits of Viscosupplementation
11.1.2 Synovial Fluid
11.1.3 Product Types
11.1.3.1 Single-Injection Products
11.1.3.2 Two-Injection Cycle Products
11.1.3.3 Three-Injection Cycle Products
11.1.3.4 Three-/Five-Injection Cycle Products
11.1.4 Reimbursement
11.2 Market Overview
11.3 Market Analysis and Forecast
11.3.1 Hyaluronic Acid Viscosupplementation Market
11.3.2 Single-Injection Hyaluronic Acid Viscosupplementation Market
11.3.3 Two-Injection Hyaluronic Acid Viscosupplementation Market
11.3.4 Three-Injection Hyaluronic Acid Viscosupplementation Market
11.3.5 Five-Injection Hyaluronic Acid Viscosupplementation Market
11.4 Drivers and Limiters
11.4.1 Market Drivers
11.4.2 Market Limiters
11.5 Competitive Market Share Analysis
Orthopedic Cartilage Repair Market
12.1 Introduction
12.1.1 Anatomy
12.1.2 Methods for Cartilage Repair
12.1.2.1 Microfracture
12.1.2.2 Microfracture Adjunct
12.1.2.3 Osteoarticular Autograft Transfer System
12.1.2.4 Particulated Juvenile Allograft
12.1.2.5 Osteochondral Allograft Transfer
12.1.2.6 Autologous Chondrocyte Implantation
12.1.2.7 Meniscal Allograft Transplantation
12.2 Market Overview
12.3 Market Analysis and Forecast
12.3.1 Osteochondral Allograft Market
12.3.2 Meniscal Allograft Market
12.3.3 Autologous Chondrocyte Implantation Market
12.3.4 Particulated Juvenile Allograft Market
12.3.5 Microfracture Adjunct Market
12.4 Unit Analysis
12.4.1 Osteochondral Allograft Cartilage Repair Units Sold by Patient Type
12.4.2 Meniscal Allograft Cartilage Repair Units Sold by Patient Type
12.4.3 Autologous Chondrocyte Implantation Cartilage Repair Units Sold by Patient Type
12.4.4 Particulated Juvenile Cartilage Repair Units Sold by Patient Type
12.4.5 Microfracture Adjunct Cartilage Repair Units Sold by Patient Type
12.5 Drivers and Limiters
12.5.1 Market Drivers
12.5.2 Market Limiters
12.6 Competitive Market Share Analysis
Abbreviations
·         Allergan ·         LifeLink Tissue Bank
·         AlloSource ·         LifeNet Health
·         Alphatec Spine ·         Medtronic
·         Arthrex ·         MTF
·         Aziyo ·         Novabone
·         Baxter ·         Nuo Therapeutics
·         Berkely Advanced Biomaterials ·         NuVasive
·         Biocomposites ·         Orthofix
·         Biogennix ·         OrthogenRx
·         Biologica ·         Osiris Therapeutics
·         Bioventus ·         Osteogenics
·         Celling Biosciences ·         Osteomed
·         Cerapedics ·         Ostetic
·         Cingal ·         RTI Surgical
·         Collagen Matrix/Regenity ·         Sanofi
·         CONMED ·         Smith & Nephew
·         Curasan ·         Solvita
·         DCI Donor Services ·         Spinal Elements
·         DePuy Synthes ·         Stryker
·         Etex ·         Surgalign Holdings
·         Exactech ·         Terumo
·         Ferring Pharmaceuticals ·         Teva Pharmaceutical
·         Fidia ·         ThermoGenesis
·         Globus Medical ·         Vericel
·         Hanmi Pharmaceutical ·         Vivex
·         Healiva ·         Xtant Medical Holdings
·         Isto Biologics ·         Zimmer Biomet
Chart 1‑1: Orthopedic Biomaterials Market by Segment, U.S., 2023 – 2030
Chart 1‑2: Orthopedic Biomaterials Market Overview, U.S., 2023 & 2030
Chart 2‑1: Multi-Scenario Orthopedic Biomaterials Market Forecast, U.S., 2020 – 2030 (US$M)
Chart 5‑1: Orthopedic Biomaterials Market by Segment, U.S., 2020 – 2030
Chart 5‑2: Leading Competitors, Orthopedic Biomaterials Market, U.S., 2023
Chart 6‑1: Orthopedic Biomaterials Procedures by Segment, U.S., 2020 – 2030
Chart 7‑1: Orthopedic Bone Graft Substitute Market by Segment, U.S., 2020 – 2030
Chart 7‑2: Orthopedic Bone Graft Substitute Market by Indication, U.S., 2020 – 2030
Chart 7‑3: Leading Competitors, Orthopedic Bone Graft Substitute Market, U.S., 2023
Chart 8‑1: Orthopedic Growth Factor Market by Segment, U.S., 2020 – 2030
Chart 8‑2: Leading Competitors, Orthopedic Growth Factor Market, U.S., 2023
Chart 9‑1: Orthopedic Cellular Allograft Market by Segment, U.S., 2020 – 2030
Chart 9‑2: Leading Competitors, Orthopedic Cellular Allograft Market, U.S., 2023
Chart 10‑1: Orthopedic Cell Therapy Market by Segment, U.S., 2020 – 2030
Chart 10‑2: Leading Competitors, Orthopedic Cell Therapy Market, U.S., 2023
Chart 11‑1: Hyaluronic Acid (HA) Viscosupplementation Market by Segment, U.S., 2020 – 2030
Chart 11‑2: Leading Competitors, Hyaluronic Acid Viscosupplementation Market, U.S., 2023
Chart 12‑1: Orthopedic Cartilage Repair Market by Segment, U.S., 2020 – 2030
Chart 12‑2: Leading Competitors, Orthopedic Cartilage Repair Market, U.S., 2023
Figure 1‑1: Orthopedic Biomaterials Market Share Ranking by Segment, U.S., 2023 (1 of 2)
Figure 1‑2: Orthopedic Biomaterials Market Share Ranking by Segment, U.S., 2023 (2 of 2)
Figure 1‑3: Companies Researched in This Report
Figure 1‑4: Factors Impacting the Orthopedic Biomaterials Market by Segment, U.S. (1 of 2)
Figure 1‑5: Factors Impacting the Orthopedic Biomaterials Market by Segment, U.S. (2 of 2)
Figure 1‑6: Recent Events in the Orthopedic Biomaterials Market, U.S., 2021 – 2024 (1 of 6)
Figure 1‑7: Recent Events in the Orthopedic Biomaterials Market, U.S., 2021 – 2024 (2 of 6)
Figure 1‑8: Recent Events in the Orthopedic Biomaterials Market, U.S., 2021 – 2024 (3 of 6)
Figure 1‑9: Recent Events in the Orthopedic Biomaterials Market, U.S., 2021 – 2024 (4 of 6)
Figure 1‑10: Recent Events in the Orthopedic Biomaterials Market, U.S., 2021 – 2024 (5 of 6)
Figure 1‑11: Recent Events in the Orthopedic Biomaterials Market, U.S., 2021 – 2024 (6 of 6)
Figure 1‑12: Orthopedic Biomaterials Procedures Covered (1 of 4)
Figure 1‑13: Orthopedic Biomaterials Procedures Covered (2 of 4)
Figure 1‑14: Orthopedic Biomaterials Procedures Covered (3 of 4)
Figure 1‑15: Orthopedic Biomaterials Procedures Covered (4 of 4)
Figure 1‑16: Procedure Codes Investigated
Figure 1‑17: Orthopedic Biomaterials Markets Covered (1 of 6)
Figure 1‑18: Orthopedic Biomaterials Markets Covered (2 of 6)
Figure 1‑19: Orthopedic Biomaterials Markets Covered (3 of 6)
Figure 1‑20: Orthopedic Biomaterials Markets Covered (4 of 6)
Figure 1‑21: Orthopedic Biomaterials Markets Covered (5 of 6)
Figure 1‑22: Orthopedic Biomaterials Markets Covered (6 of 6)
Figure 1‑23: Key Report Updates
Figure 1‑24: Version History
Figure 2‑1: Orthopedic Biomaterials Market by Segment, Worst Case Scenario, U.S., 2020 – 2030 (US$M)
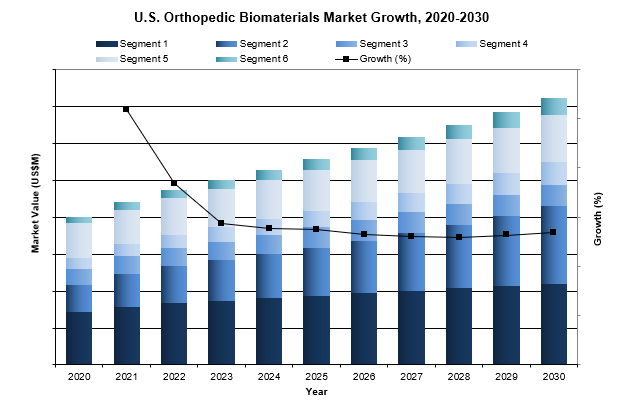
Figure 2‑2: Orthopedic Biomaterials Market by Segment, Base Case Scenario, U.S., 2020 – 2030 (US$M)
Figure 2‑3: Orthopedic Biomaterials Market by Segment, Best Case Scenario, U.S., 2020 – 2030 (US$M)
Figure 4‑1: Bone Graft Substitutes Products by Company (1 of 4)
Figure 4‑2: Bone Graft Substitutes Products by Company (2 of 4)
Figure 4‑3: Bone Graft Substitutes Products by Company (3 of 4)
Figure 4‑4: Bone Graft Substitutes Products by Company (4 of 4)
Figure 4‑5: Growth Factor Products by Company
Figure 4‑6: Cellular Allograft Products by Company
Figure 4‑7: Cell Therapy Products by Company
Figure 4‑8: Hyaluronic Acid Viscosupplementation by Products by Company
Figure 4‑9: Cartilage Repair Products by Company
Figure 4‑10: Class 2 Device Recall GRAFTON DBM (Gel, Flex, Putty, Matrix, Crunch)
Figure 4‑11: Class 2 Device Recall GRAFTON PLUS DBM Paste
Figure 4‑12: Class 2 Device Recall Magnifuse Bone Graft
Figure 4‑13: Class 2 Device Recall Grafton DBF Inject
Figure 4‑14: Class 2 Device Recall OsteoSelect Demineralized Bone Matrix (DBM) Putty
Figure 4‑15: Class 2 Device Recall PROSTIM 10cc INJECTABLE
Figure 4‑16: Class 2 Device Recall Opteform Allograft Disc
Figure 4‑17: Class 2 Device Recall Bioactive Bone Graft Putty
Figure 4‑18: Class 3 Device Recall iFACTOR Peptide Enhanced Bone Graft Putty
Figure 4‑19: ACDF Using Structural Allograft vs. Tritanium C
Figure 4‑20: Clinical Study of Bone Graft Substitutes in Orthopaedic and Spinal Applications
Figure 4‑21: OSTEOAMP Lumbar Fusion Intra-Patient Controlled Study
Figure 4‑22: Rate of Bony Fusion Using NanoBone® Synthetic Bone Graft Versus Local Autologous Bone Graft. (BONE)
Figure 4‑23: Demineralized Bone Matrix Rotator Cuff Study
Figure 4‑24: Clinical Outcomes Associated with the Use of ViviGen® for the Treatment of Lumbar Degenerative Disc Disease
Figure 4‑25: The Effect of Bone-void Filler on Anterior Knee Pain Following ACL Reconstruction
Figure 4‑26: Long-term Safety and Effectiveness of AUGMENT® Injectable Bone Graft Compared to Autologous Bone Graft
Figure 4‑27: Transforaminal Lumbar Interbody Fusion (TLIF)
Figure 4‑28: A Post Market Surveillance on INFUSE Bone Graft
Figure 4‑29: Long-term Safety and Effectiveness of AUGMENT® Injectable Bone Graft Compared to Autologous Bone Graft
Figure 4‑30: Evaluation of the Effectiveness of AMPLEX® Compared to Autogenous Bone Grafts
Figure 4‑31: Safety, Efficacy, & Use of ViviGen Cellular Bone Matrix Allograft in Orthopaedic Fracture Care
Figure 4‑32: MagnetOs Putty Compared to Trinity Evolution in Patients Undergoing up to Four-level Instrumented Posterolateral Fusion
Figure 4‑33: Clinical Outcomes Associated with the Use of ViviGen® for the Treatment of Lumbar Degenerative Disc Disease (ViviGen)
Figure 4‑34: Trinity Elite in Lumbar Fusion
Figure 4‑35: An ACDF Multi-Center Study Using ViviGen Cellular Bone Matrix
Figure 4‑36: ViviGen Cellular Bone Matrix for Hindfoot or Ankle Arthrodesis (ViviGen)
Figure 4‑37: Effect of PRP, PPP, & BMAC on Functional Outcomes Following Hip Arthroscopy for Acetabular Labral Pathologies
Figure 4‑38: Bone Marrow Aspirate Concentrate (BMAC) vs Corticosteroid Injection
Figure 4‑39: BMAC & Allograft vs BMP-2
Figure 4‑40: Bone Marrow Aspirate Concentrate (BMAC)Treatment for Knee Osteoarthritis (BMAC)
Figure 4‑41: Platelet Rich Plasma in Knee Osteoarthritis
Figure 4‑42: Platelet-Rich Plasma (PRP) for Treatment of Symptomatic Lumbar Facet Syndrome of the Spine
Figure 4‑43: A Prospective Study of Clinical Outcomes Following a Single Intradiscal Injection of Bone Marrow Aspirate Concentrate (BMAC) for Single Level Discogenic Low Back Pain
Figure 4‑44: ArtiAid® for Knee Osteoarthritis: A Post-market Study
Figure 4‑45: The Effectiveness of Different Doses of Hyaluronic Acid Injections in Knee Osteoarthritis
Figure 4‑46: Euflexxa for the Treatment of Osteoarthritis
Figure 4‑47: MONOVISC for Ankle Joint Pain Relief
Figure 4‑48: MONOVISC for Shoulder Joint Pain Relief
Figure 4‑49: MONOVISC for Hip Joint Pain Relief
Figure 4‑50: Comparison of Hyaluronic Acid and Platelet-Rich Plasma Injections
Figure 4‑51: Prospective Evaluation of ProChondrix CR for Repair of Articular Cartilage Defects on Femoral Condyle and Patella
Figure 4‑52: Osteochondral Allograft in the Surgical Treatment of Basal Joint Arthritis
Figure 4‑53: Phase 2 Clinical Trial of CartiLife® in the United States
Figure 4‑54: A Study to Evaluate the Efficacy of BioCartilage® Micronized Cartilage Matrix in Microfracture Treatment of Osteochondral Defects
Figure 5‑1: Orthopedic Biomaterials Market by Segment, U.S., 2020 – 2030 (US$M)
Figure 5‑2: Leading Competitors, Orthopedic Biomaterials Market, U.S., 2023 (1 of 2)
Figure 5‑3: Leading Competitors, Orthopedic Biomaterials Market, U.S., 2023 (2 of 2)
Figure 5‑4: SWOT Analysis, Arthrex
Figure 5‑5: SWOT Analysis, Biocomposites
Figure 5‑6: SWOT Analysis, Bioventus
Figure 5‑7: SWOT Analysis, DePuy Synthes
Figure 5‑8: SWOT Analysis, Ferring Pharmaceuticals
Figure 5‑9: SWOT Analysis, Isto Biologics
Figure 5‑10: SWOT Analysis, Medtronic
Figure 5‑11: SWOT Analysis, MTF
Figure 5‑12: SWOT Analysis, NuVasive
Figure 5‑13: SWOT Analysis, Orthofix
Figure 5‑14: SWOT Analysis, Sanofi
Figure 5‑15: SWOT Analysis, Stryker
Figure 5‑16: SWOT Analysis, Terumo
Figure 5‑17: SWOT Analysis, Vericel
Figure 5‑18: SWOT Analysis, Zimmer Biomet
Figure 6‑1: Procedure Codes Investigated, U.S., 2023
Figure 6‑2: Orthopedic Biomaterials Procedures by Segment, U.S., 2020 – 2030
Figure 6‑3: Orthopedic Bone Grafting Procedures by Material, U.S., 2020 – 2030
Figure 6‑4: Orthopedic Bone Grafting Procedures by Indication, U.S., 2020 – 2030 (1 of 2)
Figure 6‑5: Orthopedic Bone Grafting Procedures by Indication, U.S., 2020 – 2030 (2 of 2)
Figure 6‑6: Average Units Used per Procedure by Indication, U.S., 2020 – 2030
Figure 6‑7: Autograft Procedures by Indication, U.S., 2020 – 2030 (1 of 2)
Figure 6‑8: Autograft Procedures by Indication, U.S., 2020 – 2030 (2 of 2)
Figure 6‑9: Allograft Procedures by Indication, U.S., 2020 – 2030 (1 of 2)
Figure 6‑10: Allograft Procedures by Indication, U.S., 2020 – 2030 (2 of 2)
Figure 6‑11: Xenograft Procedures by Indication, U.S., 2020 – 2030 (1 of 2)
Figure 6‑12: Xenograft Procedures by Indication, U.S., 2020 – 2030 (2 of 2)
Figure 6‑13: DBM Procedures by Indication, U.S., 2020 – 2030 (1 of 2)
Figure 6‑14: DBM Procedures by Indication, U.S., 2020 – 2030 (2 of 2)
Figure 6‑15: Synthetic Procedures by Indication, U.S., 2020 – 2030 (1 of 2)
Figure 6‑16: Synthetic Procedures by Indication, U.S., 2020 – 2030 (2 of 2)
Figure 6‑17: Allograft Procedures by Patient Type, U.S., 2020-2030
Figure 6‑18: Xenograft Procedures by Patient Type, U.S., 2020-2030
Figure 6‑19: DBM Procedures by Patient Type, U.S., 2020-2030
Figure 6‑20: Synthetic Procedures by Patient Type, U.S., 2020-2030
Figure 6‑21: Orthopedic Bone Grafting Procedures by Care Setting, U.S., 2020-2030
Figure 6‑22: Orthopedic Growth Factor Procedures by Indication, U.S., 2020 – 2030
Figure 6‑23: Orthopedic Growth Factor Procedures by Care Setting, U.S., 2020 – 2030
Figure 6‑24: Cellular Allograft Procedures by Anatomy, U.S., 2020 – 2030
Figure 6‑25: Cellular Allograft Procedures by Patient Type, U.S., 2020 – 2030
Figure 6‑26: Cellular Allograft Procedures by Care Setting, U.S., 2020 – 2030
Figure 6‑27: Orthopedic Cell Therapy Procedures by Material Type, U.S., 2020 – 2030
Figure 6‑28: Platelet-Rich Plasma Procedures by Indication, U.S., 2020 – 2030 (1 of 2)
Figure 6‑29: Platelet-Rich Plasma Procedures by Indication, U.S., 2020 – 2030 (2 of 2)
Figure 6‑30: Bone Marrow Aspirate Concentrate Procedures by Indication, U.S., 2020 – 2030 (1 of 2)
Figure 6‑31: Bone Marrow Aspirate Concentrate Procedures by Indication, U.S., 2020 – 2030 (2 of 2)
Figure 6‑32: Orthopedic Cell Therapy Procedures by Patient Type, U.S., 2020 – 2030
Figure 6‑33: Orthopedic Cell Therapy Procedures by Care Setting, U.S., 2020 – 2030
Figure 6‑34: Hyaluronic Acid Viscosupplementation Procedures by Injection Cycle, U.S., 2020 – 2030 (1 of 2)
Figure 6‑35: Hyaluronic Acid Viscosupplementation Procedures by Injection Cycle, U.S., 2020 – 2030 (2 of 2)
Figure 6‑36: Hyaluronic Acid Viscosupplementation Procedures by Patient Type, U.S., 2020 – 2030
Figure 6‑37: Hyaluronic Acid Viscosupplementation Procedures by Care Setting, U.S., 2020 – 2030
Figure 6‑38: Orthopedic Cartilage Repair Procedures by Type, U.S., 2020 – 2030 (1 of 2)
Figure 6‑39: Orthopedic Cartilage Repair Procedures by Type, U.S., 2020 – 2030 (2 of 2)
Figure 6‑40: Orthopedic Cartilage Repair Procedures by Patient Type, U.S., 2020 – 2030
Figure 6‑41: Orthopedic Cartilage Repair Procedures by Care Setting, U.S., 2020 – 2030
Figure 7‑1: Orthopedic Bone Graft Substitute Units per Procedure by Indication, U.S., 2020 – 2030
Figure 7‑2: Orthopedic Bone Graft Substitute Market by Segment, U.S., 2020 – 2030 (US$M)
Figure 7‑3: Orthopedic Bone Graft Substitute Market by Segment, U.S., 2020 – 2030 (US$M)
Figure 7‑4: Orthopedic Bone Graft Substitute Market, U.S., 2020 – 2030
Figure 7‑5: Allograft Bone Graft Substitute Market, U.S., 2020 – 2030
Figure 7‑6: Xenograft Bone Graft Substitute Market, U.S., 2020 – 2030
Figure 7‑7: Demineralized Bone Matrix Allograft Bone Graft Substitute Market, U.S., 2020 – 2030
Figure 7‑8: Synthetic Bone Graft Substitute Market, U.S., 2020 – 2030
Figure 7‑9: Synthetic Bone Graft Substitute Market by Generation Type, U.S., 2020 – 2030 (US$M)
Figure 7‑10: Generation 1 Synthetic Bone Graft Substitute Market, U.S., 2020 – 2030
Figure 7‑11: Generation 2 Synthetic Bone Graft Substitute Market, U.S., 2020 – 2030
Figure 7‑12: Allograft Bone Graft Substitute Units Sold by Indication, U.S., 2020 – 2030
Figure 7‑13: Spine Allograft Bone Graft Substitute Units Sold, U.S., 2020 – 2030
Figure 7‑14: Spine Allograft Bone Graft Substitute Units Sold by Product Type, U.S., 2020 – 2030
Figure 7‑15: Trauma Allograft Bone Graft Substitute Units Sold, U.S., 2020 – 2030
Figure 7‑16: Large Joint Reconstruction Allograft Bone Graft Substitute Units Sold, U.S., 2020 – 2030
Figure 7‑17: Allograft Bone Graft Substitute Units Sold by Patient Type, U.S., 2020 – 2030
Figure 7‑18: Allograft Bone Graft Substitute Units Sold by Setting Type, U.S., 2020 – 2030
Figure 7‑19: Allograft Bone Graft Substitute Units Sold by Product Type, U.S., 2020 – 2030 (1 of 2)
Figure 7‑20: Allograft Bone Graft Substitute Units Sold by Product Type, U.S., 2020 – 2030 (2 of 2)
Figure 7‑21: Xenograft Bone Graft Substitute Units Sold by Indication, U.S., 2020 – 2030
Figure 7‑22: Spine Xenograft Bone Graft Substitute Units Sold, U.S., 2020 – 2030
Figure 7‑23: Spine Xenograft Bone Graft Substitute Units Sold by Product Type, U.S., 2020 – 2030
Figure 7‑24: Trauma Xenograft Bone Graft Substitute Units Sold, U.S., 2020 – 2030
Figure 7‑25: Large Joint Reconstruction Xenograft Bone Graft Substitute Units Sold, U.S., 2020 – 2030
Figure 7‑26: Xenograft Bone Graft Substitute Units Sold by Patient Type, U.S., 2020 – 2030
Figure 7‑27: Xenograft Bone Graft Substitute Units Sold by Setting Type, U.S., 2020 – 2030
Figure 7‑28: Xenograft Bone Graft Substitute Units Sold by Product Type, U.S., 2020 – 2030
Figure 7‑29: DBM with Carriers Market, U.S., 2020-2030
Figure 7‑30: DBM without Carriers Market, U.S., 2020-2030
Figure 7‑31: Demineralized Bone Matrix Allograft Bone Graft Substitute Units Sold by Indication, U.S., 2020 – 2030
Figure 7‑32: Spine Demineralized Bone Matrix Allograft Bone Graft Substitute Units Sold, U.S., 2020 – 2030
Figure 7‑33: Spine Demineralized Bone Matrix Bone Graft Substitute Units Sold by Product Type, U.S., 2020 – 2030
Figure 7‑34: Trauma Demineralized Bone Matrix Allograft Bone Graft Substitute Units Sold, U.S., 2020 – 2030
Figure 7‑35: Large Joint Reconstruction Demineralized Bone Matrix Allograft Bone Graft Substitute Units Sold, U.S., 2020 – 2030
Figure 7‑36: Demineralized Bone Matrix Allograft Bone Graft Substitute Units Sold by Patient Type, U.S., 2020 – 2030
Figure 7‑37: Demineralized Bone Matrix Allograft Bone Graft Substitute Units Sold by Setting Type, U.S., 2020 – 2030
Figure 7‑38: Demineralized Bone Matrix Bone Graft Substitute Units Sold by Product Type, U.S., 2020 – 2030 (1 of 2)
Figure 7‑39: Demineralized Bone Matrix Bone Graft Substitute Units Sold by Product Type, U.S., 2020 – 2030 (2 of 2)
Figure 7‑40: Synthetic Bone Graft Substitute Units Sold by Indication, U.S., 2020 – 2030
Figure 7‑41: Spine Synthetic Bone Graft Substitute Units Sold, U.S., 2020 – 2030
Figure 7‑42: Spine Synthetic Bone Graft Substitute Units Sold by Product Type, U.S., 2020 – 2030
Figure 7‑43: Trauma Synthetic Bone Graft Substitute Units Sold, U.S., 2020 – 2030
Figure 7‑44: Large Joint Reconstruction Synthetic Bone Graft Substitute Units Sold, U.S., 2020 – 2030
Figure 7‑45: Synthetic Bone Graft Substitute Units Sold by Patient Type, U.S., 2020 – 2030
Figure 7‑46: Synthetic Bone Graft Substitute Units Sold by Setting Type, U.S., 2020 – 2030
Figure 7‑47: Synthetic Bone Graft Substitute Units Sold by Patient Type, U.S., 2020 – 2030
Figure 7‑48: Synthetic Bone Graft Substitute Units Sold by Product Type, U.S., 2020 – 2030 (1 of 2)
Figure 7‑49: Synthetic Bone Graft Substitute Units Sold by Product Type, U.S., 2020 – 2030 (2 of 2)
Figure 7‑50: Leading Competitors, Orthopedic Bone Graft Substitute Market, U.S., 2023
Figure 8‑1: Orthopedic Growth Factor Market by Segment, U.S., 2020 – 2030 (US$M)
Figure 8‑2: Orthopedic Growth Factor Market, U.S., 2020 – 2030
Figure 8‑3: Cervical Disc Degeneration Orthopedic Growth Factor Market, U.S., 2020 – 2030
Figure 8‑4: Tibial Fracture Orthopedic Growth Factor Market, U.S., 2020 – 2030
Figure 8‑5: Spine Orthopedic Growth Factor Market, U.S., 2020 – 2030
Figure 8‑6: Ankle & Hindfoot Fusion Orthopedic Growth Factor Market, U.S., 2020 – 2030
Figure 8‑7: Cervical Disc Degeneration Growth Factor Units Sold by Setting Type, U.S., 2020 – 2030
Figure 8‑8: Tibial Fracture Growth Factor Units Sold by Setting Type, U.S., 2020 – 2030
Figure 8‑9: Spine Growth Factor Units Sold by Setting Type, U.S., 2020 – 2030
Figure 8‑10: Ankle and Hindfoot Fusion Growth Factor Units Sold by Setting Type, U.S., 2020 – 2030
Figure 8‑11: Leading Competitors, Orthopedic Growth Factor Market, U.S., 2023
Figure 9‑1: Orthopedic Cellular Allograft Market by Segment, U.S., 2020 – 2030 (US$M)
Figure 9‑2: Orthopedic Cellular Allograft Market, U.S., 2020 – 2030
Figure 9‑3: Cervical Spine Orthopedic Cellular Allograft Market, U.S., 2020 – 2030
Figure 9‑4: Lumbar Spine Orthopedic Cellular Allograft Market, U.S., 2020 – 2030
Figure 9‑5: Foot and Ankle Cellular Allograft Market, U.S., 2020 – 2030
Figure 9‑6: Trauma Cellular Allograft Market, U.S., 2020 – 2030
Figure 9‑7: Leading Competitors, Orthopedic Cellular Allograft Market, U.S., 2023
Figure 10‑1: Orthopedic Cell Therapy Market by Segment, U.S., 2020 – 2030 (US$M)
Figure 10‑2: Platelet-Rich Plasma Market, U.S., 2020 – 2030
Figure 10‑3: Bone Marrow Aspirate Concentrate Market, U.S., 2020 – 2030
Figure 10‑4: Platelet-Rich Plasma Units Sold by Indication Anatomy, U.S., 2020 – 2030
Figure 10‑5: Bone Marrow Aspirate Concentrate Units Sold by Indication Anatomy, U.S., 2020 – 2030
Figure 10‑6: Leading Competitors, Orthopedic Cell Therapy Market, U.S., 2023
Figure 11‑1: Hyaluronic Acid Viscosupplementation Market by Segment, U.S., 2020 – 2030 (US$M)
Figure 11‑2: Hyaluronic Acid Viscosupplementation Market, U.S., 2020 – 2030
Figure 11‑3: Single-Injection Hyaluronic Acid Viscosupplementation Market, U.S., 2020 – 2030
Figure 11‑4: Two-Injection Hyaluronic Acid Viscosupplementation Market, U.S., 2020 – 2030
Figure 11‑5: Three-Injection Hyaluronic Acid Viscosupplementation Market, U.S., 2020 – 2030
Figure 11‑6: Five-Injection Hyaluronic Acid Viscosupplementation Market, U.S., 2020 – 2030
Figure 11‑7: Leading Competitors, Hyaluronic Acid Viscosupplementation Market, U.S., 2023
Figure 12‑1: Orthopedic Cartilage Repair Market by Segment, U.S., 2020 – 2030 (US$M)
Figure 12‑2: Osteochondral Allograft Market, U.S., 2020 – 2030
Figure 12‑3: Meniscal Allograft Market, U.S., 2020 – 2030
Figure 12‑4: Autologous Chondrocyte Implantation Market, U.S., 2020 – 2030
Figure 12‑5: Particulated Juvenile Allograft Market, U.S., 2020 – 2030
Figure 12‑6: Microfracture Adjunct Market, U.S., 2020 – 2030
Figure 12‑7: Osteochondral Allograft Cartilage Repair Units Sold by Patient Type, U.S., 2020 – 2030
Figure 12‑8: Meniscal Allograft Cartilage Repair Units Sold by Patient Type, U.S., 2020 – 2030
Figure 12‑9: Autologous Chondrocyte Implantation Cartilage Repair Units Sold by Patient Type, U.S., 2020 – 2030
Figure 12‑10: Particulated Juvenile Cartilage Repair Units Sold by Patient Type, U.S., 2020 – 2030
Figure 12‑11: Microfracture Adjunct Cartilage Repair Units Sold by Patient Type, U.S., 2020 – 2030
Figure 12‑12: Leading Competitors, Orthopedic Cartilage Repair Market, U.S., 2023

iData’s 9-Step Research Methodology

Our reports follow an in-depth 9-step methodology which focuses on the following research systems:

  • Original primary research that consists of the most up-to-date market data
  • Strong foundation of quantitative and qualitative research
  • Focused on the needs and strategic challenges of the industry participants

Step 1: Project Initiation & Team Selection During this preliminary investigation, all staff members involved in the industry discusses the topic in detail.

Step 2: Prepare Data Systems and Perform Secondary Research The first task of the research team is to prepare for the data collection process: Filing systems and relational databases are developed as needed.

Step 3: Preparation for Interviews & Questionnaire Design The core of all iData research reports is primary market research. Interviews with industry insiders represent the single most reliable way to obtain accurate, current data about market conditions, trends, threats and opportunities.

Step 4: Performing Primary Research At this stage, interviews are performed using contacts and information acquired in the secondary research phase.

Step 5: Research Analysis: Establishing Baseline Estimates Following the completion of the primary research phase, the collected information must be synthesized into an accurate view of the market status. The most important question is the current state of the market.

Step 6: Market Forecast and Analysis iData Research uses a proprietary method to combine statistical data and opinions of industry experts to forecast future market values.

Step 7: Identify Strategic Opportunities iData analysts identify in broad terms why some companies are gaining or losing share within a given market segment.

Step 8: Final Review and Market Release An integral part of the iData research methodology is a built-in philosophy of quality control and continuing improvement is integral to the iData philosophy.

Step 9: Customer Feedback and Market Monitoring iData philosophy of continuous improvement requires that reports and consulting projects be monitored after release for customer feedback and market accuracy.

Click Here to Read More About Our Methodology

Explore Options

Report Summary

FREE

Select License Type

The full report suite on the U.S. market for orthopedic biomaterials includes bone graft substitutes, which are represented by allografts, demineralized bone matrices (DBMs), xenografts and synthetic bone graft markets. The report also includes orthopedic growth factors; cellular allografts; orthopedic cell therapy, represented by bone marrow aspirate concentrate and platelet-rich plasma; hyaluronic acid (HA) viscosupplementation in single-, two-, three- and five-injection cycles; and, finally, orthopedic cartilage repair. Cartilage repair is represented by the osteochondral allograft, meniscal allograft, autologous chondrocyte implantation, particulated juvenile allograft and microfracture adjunct segments.

  • 2024
  • 10 Years
  • United States
  • MedSuite
  • 388
  • 05/29/2024
0
    0
    Your Cart
    Your cart is emptyReturn to Report Library