| Figure 1‑1: Global Orthopedic Large Joint Device Market Share Ranking by Segment, Global, 2023 |
| Figure 1‑2: Companies Researched in This Report |
| Figure 1‑3: Factors Impacting the Orthopedic Large Joint Device Market by Segment, Global |
| Figure 1‑4: Recent Events in the Orthopedic Large Joint Device Market, Global, 2020 – 2024 (1 of 2) |
| Figure 1‑5: Recent Events in the Orthopedic Large Joint Device Market, Global, 2020 – 2024 (2 of 2) |
| Figure 1‑6: Orthopedic Large Joint Device Procedures Covered |
| Figure 1‑7: Orthopedic Large Joint Device Markets Covered |
| Figure 1‑8: Orthopedic Large Joint Device Regions Covered, Global (1 of 2) |
| Figure 1‑9: Orthopedic Large Joint Device Regions Covered, Global (2 of 2) |
| Figure 1‑10: Version History |
| Figure 2‑1: Orthopedic Large Joint Device Market by Segment, Worst Case Scenario, Global, 2020 – 2030 (US$M) |
| Figure 2‑2: Orthopedic Large Joint Device Market by Segment, Base Case Scenario, Global, 2020 – 2030 (US$M) |
| Figure 2‑3: Orthopedic Large Joint Device Market by Segment, Best Case Scenario, Global, 2020 – 2030 (US$M) |
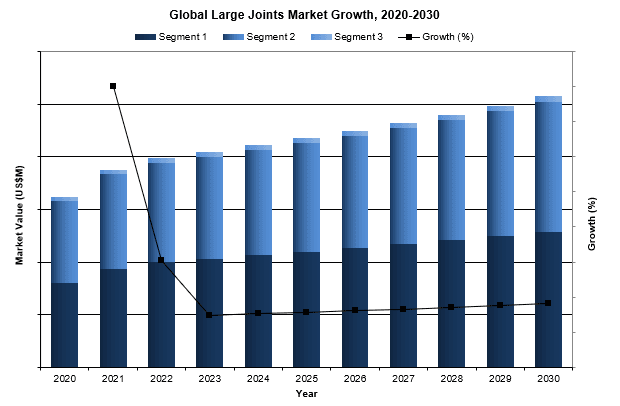
| Figure 3‑1: Orthopedic Large Joint Device Market by Segment, Global, 2020 – 2030 (US$M) |
| Figure 3‑2: Orthopedic Large Joint Device Market by Region, Global, 2020 – 2030 (US$M) |
| Figure 3‑3: Leading Competitors, Orthopedic Large Joint Device Market by Segment, Global, 2023 |
| Figure 4‑1: Knee Reconstruction Procedures Covered |
| Figure 4‑2: Knee Reconstruction Markets Covered |
| Figure 4‑3: Knee Reconstruction Regions Covered, Global (1 of 2) |
| Figure 4‑4: Knee Reconstruction Regions Covered, Global (2 of 2) |
| Figure 4‑5: Knee Reconstruction Procedures by Segment, Global, 2020 – 2030 |
| Figure 4‑6: Knee Reconstruction Procedures by Region, Global, 2020 – 2030 |
| Figure 4‑7: Knee Reconstruction Procedures by Country, North America, 2020 – 2030 |
| Figure 4‑8: Knee Reconstruction Procedures by Country, Latin America, 2020 – 2030 (1 of 2) |
| Figure 4‑9: Knee Reconstruction Procedures by Country, Latin America, 2020 – 2030 (2 of 2) |
| Figure 4‑10: Knee Reconstruction Procedures by Country, Western Europe, 2020 – 2030 |
| Figure 4‑11: Knee Reconstruction Procedures by Country, Central & Eastern Europe, 2020 – 2030 (1 of 2) |
| Figure 4‑12: Knee Reconstruction Procedures by Country, Central & Eastern Europe, 2020 – 2030 (2 of 2) |
| Figure 4‑13: Knee Reconstruction Procedures by Country, Middle East, 2020 – 2030 |
| Figure 4‑14: Knee Reconstruction Procedures by Country, Asia-Pacific, 2020 – 2030 (1 of 3) |
| Figure 4‑15: Knee Reconstruction Procedures by Country, Asia-Pacific, 2020 – 2030 (2 of 3) |
| Figure 4‑16: Knee Reconstruction Procedures by Country, Asia-Pacific, 2020 – 2030 (3 of 3) |
| Figure 4‑17: Knee Reconstruction Procedures by Country, Africa, 2020 – 2030 |
| Figure 4‑18: Total Knee Replacement Procedures by Region, Global, 2020 – 2030 |
| Figure 4‑19: Total Knee Replacement Procedures by Country, North America, 2020 – 2030 |
| Figure 4‑20: Total Knee Replacement Procedures by Country, Latin America, 2020 – 2030 (1 of 2) |
| Figure 4‑21: Total Knee Replacement Procedures by Country, Latin America, 2020 – 2030 (2 of 2) |
| Figure 4‑22: Total Knee Replacement Procedures by Country, Western Europe, 2020 – 2030 |
| Figure 4‑23: Total Knee Replacement Procedures by Country, Central & Eastern Europe, 2020 – 2030 (1 of 2) |
| Figure 4‑24: Total Knee Replacement Procedures by Country, Central & Eastern Europe, 2020 – 2030 (2 of 2) |
| Figure 4‑25: Total Knee Replacement Procedures by Country, Middle East, 2020 – 2030 |
| Figure 4‑26: Total Knee Replacement Procedures by Country, Asia-Pacific, 2020 – 2030 (1 of 3) |
| Figure 4‑27: Total Knee Replacement Procedures by Country, Asia-Pacific, 2020 – 2030 (2 of 3) |
| Figure 4‑28: Total Knee Replacement Procedures by Country, Asia-Pacific, 2020 – 2030 (3 of 3) |
| Figure 4‑29: Total Knee Replacement Procedures by Country, Africa, 2020 – 2030 |
| Figure 4‑30: Cemented Total Knee Replacement Procedures by Region, Global, 2020 – 2030 |
| Figure 4‑31: Cemented Total Knee Replacement Procedures by Country, North America, 2020 – 2030 |
| Figure 4‑32: Cemented Total Knee Replacement Procedures by Country, Latin America, 2020 – 2030 (1 of 2) |
| Figure 4‑33: Cemented Total Knee Replacement Procedures by Country, Latin America, 2020 – 2030 (2 of 2) |
| Figure 4‑34: Cemented Total Knee Replacement Procedures by Country, Western Europe, 2020 – 2030 |
| Figure 4‑35: Cemented Total Knee Replacement Procedures by Country, Central & Eastern Europe, 2020 – 2030 (1 of 2) |
| Figure 4‑36: Cemented Total Knee Replacement Procedures by Country, Central & Eastern Europe, 2020 – 2030 (2 of 2) |
| Figure 4‑37: Cemented Total Knee Replacement Procedures by Country, Middle East, 2020 – 2030 |
| Figure 4‑38: Cemented Total Knee Replacement Procedures by Country, Asia-Pacific, 2020 – 2030 (1 of 3) |
| Figure 4‑39: Cemented Total Knee Replacement Procedures by Country, Asia-Pacific, 2020 – 2030 (2 of 3) |
| Figure 4‑40: Cemented Total Knee Replacement Procedures by Country, Asia-Pacific, 2020 – 2030 (3 of 3) |
| Figure 4‑41: Cemented Total Knee Replacement Procedures by Country, Africa, 2020 – 2030 |
| Figure 4‑42: Cementless Total Knee Replacement Procedures by Region, Global, 2020 – 2030 |
| Figure 4‑43: Cementless Total Knee Replacement Procedures by Country, North America, 2020 – 2030 |
| Figure 4‑44: Cementless Total Knee Replacement Procedures by Country, Latin America, 2020 – 2030 (1 of 2) |
| Figure 4‑45: Cementless Total Knee Replacement Procedures by Country, Latin America, 2020 – 2030 (2 of 2) |
| Figure 4‑46: Cementless Total Knee Replacement Procedures by Country, Western Europe, 2020 – 2030 |
| Figure 4‑47: Cementless Total Knee Replacement Procedures by Country, Central & Eastern Europe, 2020 – 2030 (1 of 2) |
| Figure 4‑48: Cementless Total Knee Replacement Procedures by Country, Central & Eastern Europe, 2020 – 2030 (2 of 2) |
| Figure 4‑49: Cementless Total Knee Replacement Procedures by Country, Middle East, 2020 – 2030 |
| Figure 4‑50: Cementless Total Knee Replacement Procedures by Country, Asia-Pacific, 2020 – 2030 (1 of 3) |
| Figure 4‑51: Cementless Total Knee Replacement Procedures by Country, Asia-Pacific, 2020 – 2030 (2 of 3) |
| Figure 4‑52: Cementless Total Knee Replacement Procedures by Country, Asia-Pacific, 2020 – 2030 (3 of 3) |
| Figure 4‑53: Cementless Total Knee Replacement Procedures by Country, Africa, 2020 – 2030 |
| Figure 4‑54: Hybrid Cemented Total Knee Replacement Procedures by Region, Global, 2020 – 2030 |
| Figure 4‑55: Hybrid Cemented Total Knee Replacement Procedures by Country, North America, 2020 – 2030 |
| Figure 4‑56: Hybrid Cemented Total Knee Replacement Procedures by Country, Latin America, 2020 – 2030 (1 of 2) |
| Figure 4‑57: Hybrid Cemented Total Knee Replacement Procedures by Country, Latin America, 2020 – 2030 (2 of 2) |
| Figure 4‑58: Hybrid Cemented Total Knee Replacement Procedures by Country, Western Europe, 2020 – 2030 |
| Figure 4‑59: Hybrid Cemented Total Knee Replacement Procedures by Country, Central & Eastern Europe, 2020 – 2030 (1 of 2) |
| Figure 4‑60: Hybrid Cemented Total Knee Replacement Procedures by Country, Central & Eastern Europe, 2020 – 2030 (2 of 2) |
| Figure 4‑61: Hybrid Cemented Total Knee Replacement Procedures by Country, Middle East, 2020 – 2030 |
| Figure 4‑62: Hybrid Cemented Total Knee Replacement Procedures by Country, Asia-Pacific, 2020 – 2030 (1 of 3) |
| Figure 4‑63: Hybrid Cemented Total Knee Replacement Procedures by Country, Asia-Pacific, 2020 – 2030 (2 of 3) |
| Figure 4‑64: Hybrid Cemented Total Knee Replacement Procedures by Country, Asia-Pacific, 2020 – 2030 (3 of 3) |
| Figure 4‑65: Hybrid Cemented Total Knee Replacement Procedures by Country, Africa, 2020 – 2030 |
| Figure 4‑66: Total Knee Replacement Procedures by Construction Type, Global, 2020 – 2030 |
| Figure 4‑67: Cruciate-Retaining Total Knee Replacement Procedures by Region, Global, 2020 – 2030 |
| Figure 4‑68: Cruciate-Retaining Total Knee Replacement Procedures by Country, North America, 2020 – 2030 |
| Figure 4‑69: Cruciate-Retaining Total Knee Replacement Procedures by Country, Latin America, 2020 – 2030 (1 of 2) |
| Figure 4‑70: Cruciate-Retaining Total Knee Replacement Procedures by Country, Latin America, 2020 – 2030 (2 of 2) |
| Figure 4‑71: Cruciate-Retaining Total Knee Replacement Procedures by Country, Western Europe, 2020 – 2030 |
| Figure 4‑72: Cruciate-Retaining Total Knee Replacement Procedures by Country, Central & Eastern Europe, 2020 – 2030 (1 of 2) |
| Figure 4‑73: Cruciate-Retaining Total Knee Replacement Procedures by Country, Central & Eastern Europe, 2020 – 2030 (2 of 2) |
| Figure 4‑74: Cruciate-Retaining Total Knee Replacement Procedures by Country, Middle East, 2020 – 2030 |
| Figure 4‑75: Cruciate-Retaining Total Knee Replacement Procedures by Country, Asia-Pacific, 2020 – 2030 (1 of 3) |
| Figure 4‑76: Cruciate-Retaining Total Knee Replacement Procedures by Country, Asia-Pacific, 2020 – 2030 (2 of 3) |
| Figure 4‑77: Cruciate-Retaining Total Knee Replacement Procedures by Country, Asia-Pacific, 2020 – 2030 (3 of 3) |
| Figure 4‑78: Cruciate-Retaining Total Knee Replacement Procedures by Country, Africa, 2020 – 2030 |
| Figure 4‑79: Cruciate-Sacrificing Total Knee Replacement Procedures by Region, Global, 2020 – 2030 |
| Figure 4‑80: Cruciate-Sacrificing Total Knee Replacement Procedures by Country, North America, 2020 – 2030 |
| Figure 4‑81: Cruciate-Sacrificing Total Knee Replacement Procedures by Country, Latin America, 2020 – 2030 (1 of 2) |
| Figure 4‑82: Cruciate-Sacrificing Total Knee Replacement Procedures by Country, Latin America, 2020 – 2030 (2 of 2) |
| Figure 4‑83: Cruciate-Sacrificing Total Knee Replacement Procedures by Country, Western Europe, 2020 – 2030 |
| Figure 4‑84: Cruciate-Sacrificing Total Knee Replacement Procedures by Country, Central & Eastern Europe, 2020 – 2030 (1 of 2) |
| Figure 4‑85: Cruciate-Sacrificing Total Knee Replacement Procedures by Country, Central & Eastern Europe, 2020 – 2030 (2 of 2) |
| Figure 4‑86: Cruciate-Sacrificing Total Knee Replacement Procedures by Country, Middle East, 2020 – 2030 |
| Figure 4‑87: Cruciate-Sacrificing Total Knee Replacement Procedures by Country, Asia-Pacific, 2020 – 2030 (1 of 3) |
| Figure 4‑88: Cruciate-Sacrificing Total Knee Replacement Procedures by Country, Asia-Pacific, 2020 – 2030 (2 of 3) |
| Figure 4‑89: Cruciate-Sacrificing Total Knee Replacement Procedures by Country, Asia-Pacific, 2020 – 2030 (3 of 3) |
| Figure 4‑90: Cruciate-Sacrificing Total Knee Replacement Procedures by Country, Africa, 2020 – 2030 |
| Figure 4‑91: Total Knee Replacement Procedures by Bearing Type, Global, 2020 – 2030 |
| Figure 4‑92: Fixed Bearing Total Knee Replacement Procedures by Region, Global, 2020 – 2030 |
| Figure 4‑93: Fixed Bearing Total Knee Replacement Procedures by Country, North America, 2020 – 2030 |
| Figure 4‑94: Fixed Bearing Total Knee Replacement Procedures by Country, Latin America, 2020 – 2030 (1 of 2) |
| Figure 4‑95: Fixed Bearing Total Knee Replacement Procedures by Country, Latin America, 2020 – 2030 (2 of 2) |
| Figure 4‑96: Fixed Bearing Total Knee Replacement Procedures by Country, Western Europe, 2020 – 2030 |
| Figure 4‑97: Fixed Bearing Total Knee Replacement Procedures by Country, Central & Eastern Europe, 2020 – 2030 (1 of 2) |
| Figure 4‑98: Fixed Bearing Total Knee Replacement Procedures by Country, Central & Eastern Europe, 2020 – 2030 (2 of 2) |
| Figure 4‑99: Fixed Bearing Total Knee Replacement Procedures by Country, Middle East, 2020 – 2030 |
| Figure 4‑100: Fixed Bearing Total Knee Replacement Procedures by Country, Asia-Pacific, 2020 – 2030 (1 of 3) |
| Figure 4‑101: Fixed Bearing Total Knee Replacement Procedures by Country, Asia-Pacific, 2020 – 2030 (2 of 3) |
| Figure 4‑102: Fixed Bearing Total Knee Replacement Procedures by Country, Asia-Pacific, 2020 – 2030 (3 of 3) |
| Figure 4‑103: Fixed Bearing Total Knee Replacement Procedures by Country, Africa, 2020 – 2030 |
| Figure 4‑104: Mobile Bearing Total Knee Replacement Procedures by Region, Global, 2020 – 2030 |
| Figure 4‑105: Mobile Bearing Total Knee Replacement Procedures by Country, North America, 2020 – 2030 |
| Figure 4‑106: Mobile Bearing Total Knee Replacement Procedures by Country, Latin America, 2020 – 2030 (1 of 2) |
| Figure 4‑107: Mobile Bearing Total Knee Replacement Procedures by Country, Latin America, 2020 – 2030 (2 of 2) |
| Figure 4‑108: Mobile Bearing Total Knee Replacement Procedures by Country, Western Europe, 2020 – 2030 |
| Figure 4‑109: Mobile Bearing Total Knee Replacement Procedures by Country, Central & Eastern Europe, 2020 – 2030 (1 of 2) |
| Figure 4‑110: Mobile Bearing Total Knee Replacement Procedures by Country, Central & Eastern Europe, 2020 – 2030 (2 of 2) |
| Figure 4‑111: Mobile Bearing Total Knee Replacement Procedures by Country, Middle East, 2020 – 2030 |
| Figure 4‑112: Mobile Bearing Total Knee Replacement Procedures by Country, Asia-Pacific, 2020 – 2030 (1 of 3) |
| Figure 4‑113: Mobile Bearing Total Knee Replacement Procedures by Country, Asia-Pacific, 2020 – 2030 (2 of 3) |
| Figure 4‑114: Mobile Bearing Total Knee Replacement Procedures by Country, Asia-Pacific, 2020 – 2030 (3 of 3) |
| Figure 4‑115: Mobile Bearing Total Knee Replacement Procedures by Country, Africa, 2020 – 2030 |
| Figure 4‑116: Partial Knee Replacement Procedures by Device Type, Global, 2020 – 2030 |
| Figure 4‑117: Partial Knee Replacement Procedures by Region, Global, 2020 – 2030 |
| Figure 4‑118: Partial Knee Replacement Procedures by Country, North America, 2020 – 2030 |
| Figure 4‑119: Partial Knee Replacement Procedures by Country, Latin America, 2020 – 2030 (1 of 2) |
| Figure 4‑120: Partial Knee Replacement Procedures by Country, Latin America, 2020 – 2030 (2 of 2) |
| Figure 4‑121: Partial Knee Replacement Procedures by Country, Western Europe, 2020 – 2030 |
| Figure 4‑122: Partial Knee Replacement Procedures by Country, Central & Eastern Europe, 2020 – 2030 (1 of 2) |
| Figure 4‑123: Partial Knee Replacement Procedures by Country, Central & Eastern Europe, 2020 – 2030 (2 of 2) |
| Figure 4‑124: Partial Knee Replacement Procedures by Country, Middle East, 2020 – 2030 |
| Figure 4‑125: Partial Knee Replacement Procedures by Country, Asia-Pacific, 2020 – 2030 (1 of 3) |
| Figure 4‑126: Partial Knee Replacement Procedures by Country, Asia-Pacific, 2020 – 2030 (2 of 3) |
| Figure 4‑127: Partial Knee Replacement Procedures by Country, Asia-Pacific, 2020 – 2030 (3 of 3) |
| Figure 4‑128: Partial Knee Replacement Procedures by Country, Africa, 2020 – 2030 |
| Figure 4‑129: Unicondylar Partial Knee Replacement Procedures by Region, Global, 2020 – 2030 |
| Figure 4‑130: Unicondylar Partial Knee Replacement Procedures by Country, North America, 2020 – 2030 |
| Figure 4‑131: Unicondylar Partial Knee Replacement Procedures by Country, Latin America, 2020 – 2030 (1 of 2) |
| Figure 4‑132: Unicondylar Partial Knee Replacement Procedures by Country, Latin America, 2020 – 2030 (2 of 2) |
| Figure 4‑133: Unicondylar Partial Knee Replacement Procedures by Country, Western Europe, 2020 – 2030 |
| Figure 4‑134: Unicondylar Partial Knee Replacement Procedures by Country, Central & Eastern Europe, 2020 – 2030 (1 of 2) |
| Figure 4‑135: Unicondylar Partial Knee Replacement Procedures by Country, Central & Eastern Europe, 2020 – 2030 (2 of 2) |
| Figure 4‑136: Unicondylar Partial Knee Replacement Procedures by Country, Middle East, 2020 – 2030 |
| Figure 4‑137: Unicondylar Partial Knee Replacement Procedures by Country, Asia-Pacific, 2020 – 2030 (1 of 3) |
| Figure 4‑138: Unicondylar Partial Knee Replacement Procedures by Country, Asia-Pacific, 2020 – 2030 (2 of 3) |
| Figure 4‑139: Unicondylar Partial Knee Replacement Procedures by Country, Asia-Pacific, 2020 – 2030 (3 of 3) |
| Figure 4‑140: Unicondylar Partial Knee Replacement Procedures by Country, Africa, 2020 – 2030 |
| Figure 4‑141: Patellofemoral Partial Knee Replacement Procedures by Region, Global, 2020 – 2030 |
| Figure 4‑142: Patellofemoral Partial Knee Replacement Procedures by Country, North America, 2020 – 2030 |
| Figure 4‑143: Patellofemoral Partial Knee Replacement Procedures by Country, Latin America, 2020 – 2030 (1 of 2) |
| Figure 4‑144: Patellofemoral Partial Knee Replacement Procedures by Country, Latin America, 2020 – 2030 (2 of 2) |
| Figure 4‑145: Patellofemoral Partial Knee Replacement Procedures by Country, Western Europe, 2020 – 2030 |
| Figure 4‑146: Patellofemoral Partial Knee Replacement Procedures by Country, Central & Eastern Europe, 2020 – 2030 (1 of 2) |
| Figure 4‑147: Patellofemoral Partial Knee Replacement Procedures by Country, Central & Eastern Europe, 2020 – 2030 (2 of 2) |
| Figure 4‑148: Patellofemoral Partial Knee Replacement Procedures by Country, Middle East, 2020 – 2030 |
| Figure 4‑149: Patellofemoral Partial Knee Replacement Procedures by Country, Asia-Pacific, 2020 – 2030 (1 of 3) |
| Figure 4‑150: Patellofemoral Partial Knee Replacement Procedures by Country, Asia-Pacific, 2020 – 2030 (2 of 3) |
| Figure 4‑151: Patellofemoral Partial Knee Replacement Procedures by Country, Asia-Pacific, 2020 – 2030 (3 of 3) |
| Figure 4‑152: Patellofemoral Partial Knee Replacement Procedures by Country, Africa, 2020 – 2030 |
| Figure 4‑153: Knee Replacement Revision Procedures by Region, Global, 2020 – 2030 |
| Figure 4‑154: Knee Replacement Revision Procedures by Country, North America, 2020 – 2030 |
| Figure 4‑155: Knee Replacement Revision Procedures by Country, Latin America, 2020 – 2030 (1 of 2) |
| Figure 4‑156: Knee Replacement Revision Procedures by Country, Latin America, 2020 – 2030 (2 of 2) |
| Figure 4‑157: Knee Replacement Revision Procedures by Country, Western Europe, 2020 – 2030 |
| Figure 4‑158: Knee Replacement Revision Procedures by Country, Central & Eastern Europe, 2020 – 2030 (1 of 2) |
| Figure 4‑159: Knee Replacement Revision Procedures by Country, Central & Eastern Europe, 2020 – 2030 (2 of 2) |
| Figure 4‑160: Knee Replacement Revision Procedures by Country, Middle East, 2020 – 2030 |
| Figure 4‑161: Knee Replacement Revision Procedures by Country, Asia-Pacific, 2020 – 2030 (1 of 3) |
| Figure 4‑162: Knee Replacement Revision Procedures by Country, Asia-Pacific, 2020 – 2030 (2 of 3) |
| Figure 4‑163: Knee Replacement Revision Procedures by Country, Asia-Pacific, 2020 – 2030 (3 of 3) |
| Figure 4‑164: Knee Replacement Revision Procedures by Country, Africa, 2020 – 2030 |
| Figure 4‑165: Knee Reconstruction Market by Segment, Global, 2020 – 2030 (US$M) |
| Figure 4‑166: Knee Reconstruction Market by Region, Global, 2020 – 2030 (US$M) |
| Figure 4‑167: Knee Reconstruction Market, Global, 2020 – 2030 |
| Figure 4‑168: Units Sold by Region, Knee Reconstruction Market, Global, 2020 – 2030 |
| Figure 4‑169: Average Selling Price by Region, Knee Reconstruction Market, Global, 2020 – 2030 (US$) |
| Figure 4‑170: Market Value by Region, Knee Reconstruction Market, Global, 2020 – 2030 (US$M) |
| Figure 4‑171: Total Knee Replacement Market, Global, 2020 – 2030 |
| Figure 4‑172: Units Sold by Region, Total Knee Replacement Market, Global, 2020 – 2030 |
| Figure 4‑173: Average Selling Price by Region, Total Knee Replacement Market, Global, 2020 – 2030 (US$) |
| Figure 4‑174: Market Value by Region, Total Knee Replacement Market, Global, 2020 – 2030 (US$M) |
| Figure 4‑175: Total Knee Replacement Market by Segment, Global, 2020 – 2030 |
| Figure 4‑176: Cemented Total Knee Replacement Market, Global, 2020 – 2030 |
| Figure 4‑177: Units Sold by Region, Cemented Total Knee Replacement Market, Global, 2020 – 2030 |
| Figure 4‑178: Average Selling Price by Region, Cemented Total Knee Replacement Market, Global, 2020 – 2030 (US$) |
| Figure 4‑179: Market Value by Region, Cemented Total Knee Replacement Market, Global, 2020 – 2030 (US$M) |
| Figure 4‑180: Cementless Total Knee Replacement Market, Global, 2020 – 2030 |
| Figure 4‑181: Units Sold by Region, Cementless Total Knee Replacement Market, Global, 2020 – 2030 |
| Figure 4‑182: Average Selling Price by Region, Cementless Total Knee Replacement Market, Global, 2020 – 2030 (US$) |
| Figure 4‑183: Market Value by Region, Cementless Total Knee Replacement Market, Global, 2020 – 2030 (US$M) |
| Figure 4‑184: Hybrid Cemented Total Knee Replacement Market, Global, 2020 – 2030 |
| Figure 4‑185: Units Sold by Region, Hybrid Cemented Total Knee Replacement Market, Global, 2020 – 2030 |
| Figure 4‑186: Average Selling Price by Region, Hybrid Cemented Total Knee Replacement Market, Global, 2020 – 2030 (US$) |
| Figure 4‑187: Market Value by Region, Hybrid Cemented Total Knee Replacement Market, Global, 2020 – 2030 (US$M) |
| Figure 4‑188: Total Knee Replacement Market by Segment, Global, 2020 – 2030 |
| Figure 4‑189: Cruciate-Retaining Total Knee Replacement Market, Global, 2020 – 2030 |
| Figure 4‑190: Units Sold by Region, Cruciate-Retaining Total Knee Replacement Market, Global, 2020 – 2030 |
| Figure 4‑191: Average Selling Price by Region, Cruciate-Retaining Total Knee Replacement Market, Global, 2020 – 2030 (US$) |
| Figure 4‑192: Market Value by Region, Cruciate-Retaining Total Knee Replacement Market, Global, 2020 – 2030 (US$M) |
| Figure 4‑193: Cruciate-Sacrificing Total Knee Replacement Market, Global, 2020 – 2030 |
| Figure 4‑194: Units Sold by Region, Cruciate-Sacrificing Total Knee Replacement Market, Global, 2020 – 2030 |
| Figure 4‑195: Average Selling Price by Region, Cruciate-Sacrificing Total Knee Replacement Market, Global, 2020 – 2030 (US$) |
| Figure 4‑196: Market Value by Region, Cruciate-Sacrificing Total Knee Replacement Market, Global, 2020 – 2030 (US$M) |
| Figure 4‑197: Total Knee Replacement Market by Segment, Global, 2020 – 2030 |
| Figure 4‑198: Fixed Bearing Total Knee Replacement Market, Global, 2020 – 2030 |
| Figure 4‑199: Units Sold by Region, Fixed Bearing Total Knee Replacement Market, Global, 2020 – 2030 |
| Figure 4‑200: Average Selling Price by Region, Fixed Bearing Total Knee Replacement Market, Global, 2020 – 2030 (US$) |
| Figure 4‑201: Market Value by Region, Fixed Bearing Total Knee Replacement Market, Global, 2020 – 2030 (US$M) |
| Figure 4‑202: Mobile Bearing Total Knee Replacement Market, Global, 2020 – 2030 |
| Figure 4‑203: Units Sold by Region, Mobile Bearing Total Knee Replacement Market, Global, 2020 – 2030 |
| Figure 4‑204: Average Selling Price by Region, Mobile Bearing Total Knee Replacement Market, Global, 2020 – 2030 (US$) |
| Figure 4‑205: Market Value by Region, Mobile Bearing Total Knee Replacement Market, Global, 2020 – 2030 (US$M) |
| Figure 4‑206: Partial Knee Replacement Market by Device Type, Global, 2020 – 2030 (US$M) |
| Figure 4‑207: Total Partial Knee Replacement Market, Global, 2020 – 2030 |
| Figure 4‑208: Units Sold by Region, Partial Knee Replacement Market, Global, 2020 – 2030 |
| Figure 4‑209: Average Selling Price by Region, Partial Knee Replacement Market, Global, 2020 – 2030 (US$) |
| Figure 4‑210: Market Value by Region, Partial Knee Replacement Market, Global, 2020 – 2030 (US$M) |
| Figure 4‑211: Unicondylar Partial Knee Replacement Market, Global, 2020 – 2030 |
| Figure 4‑212: Units Sold by Region, Unicondylar Partial Knee Replacement Market, Global, 2020 – 2030 |
| Figure 4‑213: Average Selling Price by Region, Unicondylar Partial Knee Replacement Market, Global, 2020 – 2030 (US$) |
| Figure 4‑214: Market Value by Region, Unicondylar Partial Knee Replacement Market, Global, 2020 – 2030 (US$M) |
| Figure 4‑215: Patellofemoral Partial Knee Replacement Market, Global, 2020 – 2030 |
| Figure 4‑216: Units Sold by Region, Patellofemoral Partial Knee Replacement Market, Global, 2020 – 2030 |
| Figure 4‑217: Average Selling Price by Region, Patellofemoral Partial Knee Replacement Market, Global, 2020 – 2030 (US$) |
| Figure 4‑218: Market Value by Region, Patellofemoral Partial Knee Replacement Market, Global, 2020 – 2030 (US$M) |
| Figure 4‑219: Knee Replacement Revision Market, Global, 2020 – 2030 |
| Figure 4‑220: Units Sold by Region, Knee Replacement Revision Market, Global, 2020 – 2030 |
| Figure 4‑221: Average Selling Price by Region, Knee Replacement Revision Market, Global, 2020 – 2030 (US$) |
| Figure 4‑222: Market Value by Region, Knee Replacement Revision Market, Global, 2020 – 2030 (US$M) |
| Figure 4‑223: Leading Competitors, Knee Reconstruction Market, Global, 2023 |
| Figure 5‑1: Hip Reconstruction Procedures Covered |
| Figure 5‑2: Hip Reconstruction Markets Covered |
| Figure 5‑3: Hip Reconstruction Regions Covered, Global (1 of 2) |
| Figure 5‑4: Hip Reconstruction Regions Covered, Global (2 of 2) |
| Figure 5‑5: Hip Reconstruction Procedures by Segment, Global, 2020 – 2030 |
| Figure 5‑6: Hip Reconstruction Procedures by Region, Global, 2020 – 2030 |
| Figure 5‑7: Hip Reconstruction Procedures by Country, North America, 2020 – 2030 |
| Figure 5‑8: Hip Reconstruction Procedures by Country, Latin America, 2020 – 2030 (1 of 2) |
| Figure 5‑9: Hip Reconstruction Procedures by Country, Latin America, 2020 – 2030 (2 of 2) |
| Figure 5‑10: Hip Reconstruction Procedures by Country, Western Europe, 2020 – 2030 |
| Figure 5‑11: Hip Reconstruction Procedures by Country, Central & Eastern Europe, 2020 – 2030 (1 of 2) |
| Figure 5‑12: Hip Reconstruction Procedures by Country, Central & Eastern Europe, 2020 – 2030 (2 of 2) |
| Figure 5‑13: Hip Reconstruction Procedures by Country, Middle East, 2020 – 2030 |
| Figure 5‑14: Hip Reconstruction Procedures by Country, Asia-Pacific, 2020 – 2030 (1 of 3) |
| Figure 5‑15: Hip Reconstruction Procedures by Country, Asia-Pacific, 2020 – 2030 (2 of 3) |
| Figure 5‑16: Hip Reconstruction Procedures by Country, Asia-Pacific, 2020 – 2030 (3 of 3) |
| Figure 5‑17: Hip Reconstruction Procedures by Country, Africa, 2020 – 2030 |
| Figure 5‑18: Total Hip Replacement Procedures by Region, Global, 2020 – 2030 |
| Figure 5‑19: Total Hip Replacement Procedures by Country, North America, 2020 – 2030 |
| Figure 5‑20: Total Hip Replacement Procedures by Country, Latin America, 2020 – 2030 (1 of 2) |
| Figure 5‑21: Total Hip Replacement Procedures by Country, Latin America, 2020 – 2030 (2 of 2) |
| Figure 5‑22: Total Hip Replacement Procedures by Country, Western Europe, 2020 – 2030 |
| Figure 5‑23: Total Hip Replacement Procedures by Country, Central & Eastern Europe, 2020 – 2030 (1 of 2) |
| Figure 5‑24: Total Hip Replacement Procedures by Country, Central & Eastern Europe, 2020 – 2030 (2 of 2) |
| Figure 5‑25: Total Hip Replacement Procedures by Country, Middle East, 2020 – 2030 |
| Figure 5‑26: Total Hip Replacement Procedures by Country, Asia-Pacific, 2020 – 2030 (1 of 3) |
| Figure 5‑27: Total Hip Replacement Procedures by Country, Asia-Pacific, 2020 – 2030 (2 of 3) |
| Figure 5‑28: Total Hip Replacement Procedures by Country, Asia-Pacific, 2020 – 2030 (3 of 3) |
| Figure 5‑29: Total Hip Replacement Procedures by Country, Africa, 2020 – 2030 |
| Figure 5‑30: Total Hip Replacement Procedures by Cementation Type, Global, 2020 – 2030 |
| Figure 5‑31: Cemented Total Hip Replacement Procedures by Region, Global, 2020 – 2030 |
| Figure 5‑32: Cemented Total Hip Replacement Procedures by Country, North America, 2020 – 2030 |
| Figure 5‑33: Cemented Total Hip Replacement Procedures by Country, Latin America, 2020 – 2030 (1 of 2) |
| Figure 5‑34: Cemented Total Hip Replacement Procedures by Country, Latin America, 2020 – 2030 (2 of 2) |
| Figure 5‑35: Cemented Total Hip Replacement Procedures by Country, Western Europe, 2020 – 2030 |
| Figure 5‑36: Cemented Total Hip Replacement Procedures by Country, Central & Eastern Europe, 2020 – 2030 (1 of 2) |
| Figure 5‑37: Cemented Total Hip Replacement Procedures by Country, Central & Eastern Europe, 2020 – 2030 (2 of 2) |
| Figure 5‑38: Cemented Total Hip Replacement Procedures by Country, Middle East, 2020 – 2030 |
| Figure 5‑39: Cemented Total Hip Replacement Procedures by Country, Asia-Pacific, 2020 – 2030 (1 of 3) |
| Figure 5‑40: Cemented Total Hip Replacement Procedures by Country, Asia-Pacific, 2020 – 2030 (2 of 3) |
| Figure 5‑41: Cemented Total Hip Replacement Procedures by Country, Asia-Pacific, 2020 – 2030 (3 of 3) |
| Figure 5‑42: Cemented Total Hip Replacement Procedures by Country, Africa, 2020 – 2030 |
| Figure 5‑43: Cementless Total Hip Replacement Procedures by Region, Global, 2020 – 2030 |
| Figure 5‑44: Cementless Total Hip Replacement Procedures by Country, North America, 2020 – 2030 |
| Figure 5‑45: Cementless Total Hip Replacement Procedures by Country, Latin America, 2020 – 2030 (1 of 2) |
| Figure 5‑46: Cementless Total Hip Replacement Procedures by Country, Latin America, 2020 – 2030 (2 of 2) |
| Figure 5‑47: Cementless Total Hip Replacement Procedures by Country, Western Europe, 2020 – 2030 |
| Figure 5‑48: Cementless Total Hip Replacement Procedures by Country, Central & Eastern Europe, 2020 – 2030 (1 of 2) |
| Figure 5‑49: Cementless Total Hip Replacement Procedures by Country, Central & Eastern Europe, 2020 – 2030 (2 of 2) |
| Figure 5‑50: Cementless Total Hip Replacement Procedures by Country, Middle East, 2020 – 2030 |
| Figure 5‑51: Cementless Total Hip Replacement Procedures by Country, Asia-Pacific, 2020 – 2030 (1 of 3) |
| Figure 5‑52: Cementless Total Hip Replacement Procedures by Country, Asia-Pacific, 2020 – 2030 (2 of 3) |
| Figure 5‑53: Cementless Total Hip Replacement Procedures by Country, Asia-Pacific, 2020 – 2030 (3 of 3) |
| Figure 5‑54: Cementless Total Hip Replacement Procedures by Country, Africa, 2020 – 2030 |
| Figure 5‑55: Hybrid Cemented Total Hip Replacement Procedures by Region, Global, 2020 – 2030 |
| Figure 5‑56: Hybrid Cemented Total Hip Replacement Procedures by Country, North America, 2020 – 2030 |
| Figure 5‑57: Hybrid Cemented Total Hip Replacement Procedures by Country, Latin America, 2020 – 2030 (1 of 2) |
| Figure 5‑58: Hybrid Cemented Total Hip Replacement Procedures by Country, Latin America, 2020 – 2030 (2 of 2) |
| Figure 5‑59: Hybrid Cemented Total Hip Replacement Procedures by Country, Western Europe, 2020 – 2030 |
| Figure 5‑60: Hybrid Cemented Total Hip Replacement Procedures by Country, Central & Eastern Europe, 2020 – 2030 (1 of 2) |
| Figure 5‑61: Hybrid Cemented Total Hip Replacement Procedures by Country, Central & Eastern Europe, 2020 – 2030 (2 of 2) |
| Figure 5‑62: Hybrid Cemented Total Hip Replacement Procedures by Country, Middle East, 2020 – 2030 |
| Figure 5‑63: Hybrid Cemented Total Hip Replacement Procedures by Country, Asia-Pacific, 2020 – 2030 (1 of 3) |
| Figure 5‑64: Hybrid Cemented Total Hip Replacement Procedures by Country, Asia-Pacific, 2020 – 2030 (2 of 3) |
| Figure 5‑65: Hybrid Cemented Total Hip Replacement Procedures by Country, Asia-Pacific, 2020 – 2030 (3 of 3) |
| Figure 5‑66: Hybrid Cemented Total Knee Replacement Procedures by Country, Africa, 2020 – 2030 |
| Figure 5‑67: Total Hip Replacement Procedures by Implant Bearing Type, Global, 2020 – 2030 |
| Figure 5‑68: Metal/HCPE Total Hip Replacement Procedures by Region, Global, 2020 – 2030 |
| Figure 5‑69: Metal/HCPE Total Hip Replacement Procedures by Country, North America, 2020 – 2030 |
| Figure 5‑70: Metal/HCPE Total Hip Replacement Procedures by Country, Latin America, 2020 – 2030 (1 of 2) |
| Figure 5‑71: Metal/HCPE Total Hip Replacement Procedures by Country, Latin America, 2020 – 2030 (2 of 2) |
| Figure 5‑72: Metal/HCPE Total Hip Replacement Procedures by Country, Western Europe, 2020 – 2030 |
| Figure 5‑73: Metal/HCPE Total Hip Replacement Procedures by Country, Central & Eastern Europe, 2020 – 2030 (1 of 2) |
| Figure 5‑74: Metal/HCPE Total Hip Replacement Procedures by Country, Central & Eastern Europe, 2020 – 2030 (2 of 2) |
| Figure 5‑75: Metal/HCPE Total Hip Replacement Procedures by Country, Middle East, 2020 – 2030 |
| Figure 5‑76: Metal/HCPE Total Hip Replacement Procedures by Country, Asia-Pacific, 2020 – 2030 (1 of 3) |
| Figure 5‑77: Metal/HCPE Total Hip Replacement Procedures by Country, Asia-Pacific, 2020 – 2030 (2 of 3) |
| Figure 5‑78: Metal/HCPE Total Hip Replacement Procedures by Country, Asia-Pacific, 2020 – 2030 (3 of 3) |
| Figure 5‑79: Metal/HCPE Total Hip Replacement Procedures by Country, Africa, 2020 – 2030 |
| Figure 5‑80: Ceramic/Ceramic Total Hip Replacement Procedures by Region, Global, 2020 – 2030 |
| Figure 5‑81: Ceramic/Ceramic Total Hip Replacement Procedures by Country, North America, 2020 – 2030 |
| Figure 5‑82: Ceramic/Ceramic Total Hip Replacement Procedures by Country, Latin America, 2020 – 2030 (1 of 2) |
| Figure 5‑83: Ceramic/Ceramic Total Hip Replacement Procedures by Country, Latin America, 2020 – 2030 (2 of 2) |
| Figure 5‑84: Ceramic/Ceramic Total Hip Replacement Procedures by Country, Western Europe, 2020 – 2030 |
| Figure 5‑85: Ceramic/Ceramic Total Hip Replacement Procedures by Country, Central & Eastern Europe, 2020 – 2030 (1 of 2) |
| Figure 5‑86: Ceramic/Ceramic Total Hip Replacement Procedures by Country, Central & Eastern Europe, 2020 – 2030 (2 of 2) |
| Figure 5‑87: Ceramic/Ceramic Total Hip Replacement Procedures by Country, Middle East, 2020 – 2030 |
| Figure 5‑88: Ceramic/Ceramic Total Hip Replacement Procedures by Country, Asia-Pacific, 2020 – 2030 (1 of 3) |
| Figure 5‑89: Ceramic/Ceramic Total Hip Replacement Procedures by Country, Asia-Pacific, 2020 – 2030 (2 of 3) |
| Figure 5‑90: Ceramic/Ceramic Total Hip Replacement Procedures by Country, Asia-Pacific, 2020 – 2030 (3 of 3) |
| Figure 5‑91: Ceramic/Ceramic Total Hip Replacement Procedures by Country, Africa, 2020 – 2030 |
| Figure 5‑92: Ceramic/HCPE Total Hip Replacement Procedures by Region, Global, 2020 – 2030 |
| Figure 5‑93: Ceramic/HCPE Total Hip Replacement Procedures by Country, North America, 2020 – 2030 |
| Figure 5‑94: Ceramic/HCPE Total Hip Replacement Procedures by Country, Latin America, 2020 – 2030 (1 of 2) |
| Figure 5‑95: Ceramic/HCPE Total Hip Replacement Procedures by Country, Latin America, 2020 – 2030 (2 of 2) |
| Figure 5‑96: Ceramic/HCPE Total Hip Replacement Procedures by Country, Western Europe, 2020 – 2030 |
| Figure 5‑97: Ceramic/HCPE Total Hip Replacement Procedures by Country, Central & Eastern Europe, 2020 – 2030 (1 of 2) |
| Figure 5‑98: Ceramic/HCPE Total Hip Replacement Procedures by Country, Central & Eastern Europe, 2020 – 2030 (2 of 2) |
| Figure 5‑99: Ceramic/HCPE Total Hip Replacement Procedures by Country, Middle East, 2020 – 2030 |
| Figure 5‑100: Ceramic/HCPE Total Hip Replacement Procedures by Country, Asia-Pacific, 2020 – 2030 (1 of 3) |
| Figure 5‑101: Ceramic/HCPE Total Hip Replacement Procedures by Country, Asia-Pacific, 2020 – 2030 (2 of 3) |
| Figure 5‑102: Ceramic/HCPE Total Hip Replacement Procedures by Country, Asia-Pacific, 2020 – 2030 (3 of 3) |
| Figure 5‑103: Cruciate-Sacrificing Total Hip Replacement Procedures by Country, Africa, 2020 – 2030 |
| Figure 5‑104: Partial Hip Replacement Procedures by Device Type, Global, 2020 – 2030 |
| Figure 5‑105: Partial Hip Replacement Procedures by Region, Global, 2020 – 2030 |
| Figure 5‑106: Partial Hip Replacement Procedures by Country, North America, 2020 – 2030 |
| Figure 5‑107: Partial Hip Replacement Procedures by Country, Latin America, 2020 – 2030 (1 of 2) |
| Figure 5‑108: Partial Hip Replacement Procedures by Country, Latin America, 2020 – 2030 (2 of 2) |
| Figure 5‑109: Partial Hip Replacement Procedures by Country, Western Europe, 2020 – 2030 |
| Figure 5‑110: Partial Hip Replacement Procedures by Country, Central & Eastern Europe, 2020 – 2030 (1 of 2) |
| Figure 5‑111: Partial Hip Replacement Procedures by Country, Central & Eastern Europe, 2020 – 2030 (2 of 2) |
| Figure 5‑112: Partial Hip Replacement Procedures by Country, Middle East, 2020 – 2030 |
| Figure 5‑113: Partial Hip Replacement Procedures by Country, Asia-Pacific, 2020 – 2030 (1 of 3) |
| Figure 5‑114: Partial Hip Replacement Procedures by Country, Asia-Pacific, 2020 – 2030 (2 of 3) |
| Figure 5‑115: Partial Hip Replacement Procedures by Country, Asia-Pacific, 2020 – 2030 (3 of 3) |
| Figure 5‑116: Partial Hip Replacement Procedures by Country, Africa, 2020 – 2030 |
| Figure 5‑117: Bipolar Partial Hip Replacement Procedures by Region, Global, 2020 – 2030 |
| Figure 5‑118: Bipolar Partial Hip Replacement Procedures by Country, North America, 2020 – 2030 |
| Figure 5‑119: Bipolar Partial Hip Replacement Procedures by Country, Latin America, 2020 – 2030 (1 of 2) |
| Figure 5‑120: Bipolar Partial Hip Replacement Procedures by Country, Latin America, 2020 – 2030 (2 of 2) |
| Figure 5‑121: Bipolar Partial Hip Replacement Procedures by Country, Western Europe, 2020 – 2030 |
| Figure 5‑122: Bipolar Partial Hip Replacement Procedures by Country, Central & Eastern Europe, 2020 – 2030 (1 of 2) |
| Figure 5‑123: Bipolar Partial Hip Replacement Procedures by Country, Central & Eastern Europe, 2020 – 2030 (2 of 2) |
| Figure 5‑124: Bipolar Partial Hip Replacement Procedures by Country, Middle East, 2020 – 2030 |
| Figure 5‑125: Bipolar Partial Hip Replacement Procedures by Country, Asia-Pacific, 2020 – 2030 (1 of 3) |
| Figure 5‑126: Bipolar Partial Hip Replacement Procedures by Country, Asia-Pacific, 2020 – 2030 (2 of 3) |
| Figure 5‑127: Bipolar Partial Hip Replacement Procedures by Country, Asia-Pacific, 2020 – 2030 (3 of 3) |
| Figure 5‑128: Bipolar Partial Hip Replacement Procedures by Country, Africa, 2020 – 2030 |
| Figure 5‑129: Unipolar Partial Hip Replacement Procedures by Region, Global, 2020 – 2030 |
| Figure 5‑130: Unipolar Partial Hip Replacement Procedures by Country, North America, 2020 – 2030 |
| Figure 5‑131: Unipolar Partial Hip Replacement Procedures by Country, Latin America, 2020 – 2030 (1 of 2) |
| Figure 5‑132: Unipolar Partial Hip Replacement Procedures by Country, Latin America, 2020 – 2030 (2 of 2) |
| Figure 5‑133: Unipolar Partial Hip Replacement Procedures by Country, Western Europe, 2020 – 2030 |
| Figure 5‑134: Unipolar Partial Hip Replacement Procedures by Country, Central & Eastern Europe, 2020 – 2030 (1 of 2) |
| Figure 5‑135: Unipolar Partial Hip Replacement Procedures by Country, Central & Eastern Europe, 2020 – 2030 (2 of 2) |
| Figure 5‑136: Unipolar Partial Hip Replacement Procedures by Country, Middle East, 2020 – 2030 |
| Figure 5‑137: Unipolar Partial Hip Replacement Procedures by Country, Asia-Pacific, 2020 – 2030 (1 of 3) |
| Figure 5‑138: Unipolar Partial Hip Replacement Procedures by Country, Asia-Pacific, 2020 – 2030 (2 of 3) |
| Figure 5‑139: Unipolar Partial Hip Replacement Procedures by Country, Asia-Pacific, 2020 – 2030 (3 of 3) |
| Figure 5‑140: Unipolar Partial Hip Replacement Procedures by Country, Africa, 2020 – 2030 |
| Figure 5‑141: Hip Replacement Revision Procedures by Region, Global, 2020 – 2030 |
| Figure 5‑142: Hip Replacement Revision Procedures by Country, North America, 2020 – 2030 |
| Figure 5‑143: Hip Replacement Revision Procedures by Country, Latin America, 2020 – 2030 (1 of 2) |
| Figure 5‑144: Hip Replacement Revision Procedures by Country, Latin America, 2020 – 2030 (2 of 2) |
| Figure 5‑145: Hip Replacement Revision Procedures by Country, Western Europe, 2020 – 2030 |
| Figure 5‑146: Hip Replacement Revision Procedures by Country, Central & Eastern Europe, 2020 – 2030 (1 of 2) |
| Figure 5‑147: Hip Replacement Revision Procedures by Country, Central & Eastern Europe, 2020 – 2030 (2 of 2) |
| Figure 5‑148: Hip Replacement Revision Procedures by Country, Middle East, 2020 – 2030 |
| Figure 5‑149: Hip Replacement Revision Procedures by Country, Asia-Pacific, 2020 – 2030 (1 of 3) |
| Figure 5‑150: Hip Replacement Revision Procedures by Country, Asia-Pacific, 2020 – 2030 (2 of 3) |
| Figure 5‑151: Hip Replacement Revision Procedures by Country, Asia-Pacific, 2020 – 2030 (3 of 3) |
| Figure 5‑152: Hip Replacement Revision Procedures by Country, Africa, 2020 – 2030 |
| Figure 5‑153: Hip Reconstruction Market by Segment, Global, 2020 – 2030 (US$M) |
| Figure 5‑154: Hip Reconstruction Market by Region, Global, 2020 – 2030 (US$M) |
| Figure 5‑155: Hip Reconstruction Market, Global, 2020 – 2030 |
| Figure 5‑156: Units Sold by Region, Hip Reconstruction Market, Global, 2020 – 2030 |
| Figure 5‑157: Average Selling Price by Region, Hip Reconstruction Market, Global, 2020 – 2030 (US$) |
| Figure 5‑158: Market Value by Region, Hip Reconstruction Market, Global, 2020 – 2030 (US$M) |
| Figure 5‑159: Total Hip Replacement Market, Global, 2020 – 2030 |
| Figure 5‑160: Units Sold by Region, Total Hip Replacement Market, Global, 2020 – 2030 |
| Figure 5‑161: Average Selling Price by Region, Total Hip Replacement Market, Global, 2020 – 2030 (US$) |
| Figure 5‑162: Market Value by Region, Total Hip Replacement Market, Global, 2020 – 2030 (US$M) |
| Figure 5‑163: Total Hip Replacement Market by Cementation Type, Global, 2020 – 2030 (US$M) |
| Figure 5‑164: Cemented Total Hip Replacement Market, Global, 2020 – 2030 |
| Figure 5‑165: Units Sold by Region, Cemented Total Hip Replacement Market, Global, 2020 – 2030 |
| Figure 5‑166: Average Selling Price by Region, Cemented Total Hip Replacement Market, Global, 2020 – 2030 (US$) |
| Figure 5‑167: Market Value by Region, Cemented Total Hip Replacement Market, Global, 2020 – 2030 (US$M) |
| Figure 5‑168: Cementless Total Hip Replacement Market, Global, 2020 – 2030 |
| Figure 5‑169: Units Sold by Region, Cementless Total Hip Replacement Market, Global, 2020 – 2030 |
| Figure 5‑170: Average Selling Price by Region, Cementless Total Hip Replacement Market, Global, 2020 – 2030 (US$) |
| Figure 5‑171: Market Value by Region, Cementless Total Hip Replacement Market, Global, 2020 – 2030 (US$M) |
| Figure 5‑172: Hybrid Cemented Total Hip Replacement Market, Global, 2020 – 2030 |
| Figure 5‑173: Units Sold by Region, Hybrid Cemented Total Hip Replacement Market, Global, 2020 – 2030 |
| Figure 5‑174: Average Selling Price by Region, Hybrid Cemented Total Hip Replacement Market, Global, 2020 – 2030 (US$) |
| Figure 5‑175: Market Value by Region, Hybrid Cemented Total Hip Replacement Market, Global, 2020 – 2030 (US$M) |
| Figure 5‑176: Total Hip Replacement Market by Bearing Type, Global, 2020 – 2030 (US$M) |
| Figure 5‑177: Metal/HCPE Total Hip Replacement Market, Global, 2020 – 2030 |
| Figure 5‑178: Units Sold by Region, Metal/HCPE Total Hip Replacement Market, Global, 2020 – 2030 |
| Figure 5‑179: Average Selling Price by Region, Metal/HCPE Total Hip Replacement Market, Global, 2020 – 2030 (US$) |
| Figure 5‑180: Market Value by Region, Metal/HCPE Total Hip Replacement Market, Global, 2020 – 2030 (US$M) |
| Figure 5‑181: Ceramic/Ceramic Total Hip Replacement Market, Global, 2020 – 2030 |
| Figure 5‑182: Units Sold by Region, Ceramic/Ceramic Total Hip Replacement Market, Global, 2020 – 2030 |
| Figure 5‑183: Average Selling Price by Region, Ceramic/Ceramic Total Hip Replacement Market, Global, 2020 – 2030 (US$) |
| Figure 5‑184: Market Value by Region, Ceramic/Ceramic Total Hip Replacement Market, Global, 2020 – 2030 (US$M) |
| Figure 5‑185: Ceramic/HCPE Total Hip Replacement Market, Global, 2020 – 2030 |
| Figure 5‑186: Units Sold by Region, Ceramic/HCPE Total Hip Replacement Market, Global, 2020 – 2030 |
| Figure 5‑187: Average Selling Price by Region, Ceramic/HCPE Total Hip Replacement Market, Global, 2020 – 2030 (US$) |
| Figure 5‑188: Market Value by Region, Ceramic/HCPE Total Hip Replacement Market, Global, 2020 – 2030 (US$M) |
| Figure 5‑189: Partial Hip Replacement Market by Device Type, Global, 2020 – 2030 (US$M) |
| Figure 5‑190: Units Sold by Region, Partial Hip Replacement Market, Global, 2020 – 2030 |
| Figure 5‑191: Average Selling Price by Region, Partial Hip Replacement Market, Global, 2020 – 2030 (US$) |
| Figure 5‑192: Market Value by Region, Partial Hip Replacement Market, Global, 2020 – 2030 (US$M) |
| Figure 5‑193: Bipolar Partial Hip Replacement Market, Global, 2020 – 2030 |
| Figure 5‑194: Units Sold by Region, Bipolar Partial Hip Replacement Market, Global, 2020 – 2030 |
| Figure 5‑195: Average Selling Price by Region, Bipolar Partial Hip Replacement Market, Global, 2020 – 2030 (US$) |
| Figure 5‑196: Market Value by Region, Bipolar Partial Hip Replacement Market, Global, 2020 – 2030 (US$M) |
| Figure 5‑197: Unipolar Partial Hip Replacement Market, Global, 2020 – 2030 |
| Figure 5‑198: Units Sold by Region, Unipolar Partial Hip Replacement Market, Global, 2020 – 2030 |
| Figure 5‑199: Average Selling Price by Region, Unipolar Partial Hip Replacement Market, Global, 2020 – 2030 (US$) |
| Figure 5‑200: Market Value by Region, Unipolar Partial Hip Replacement Market, Global, 2020 – 2030 (US$M) |
| Figure 5‑201: Hip Replacement Revision Market, Global, 2020 – 2030 |
| Figure 5‑202: Units Sold by Region, Hip Replacement Revision Market, Global, 2020 – 2030 |
| Figure 5‑203: Average Selling Price by Region, Hip Replacement Revision Market, Global, 2020 – 2030 (US$) |
| Figure 5‑204: Market Value by Region, Hip Replacement Revision Market, Global, 2020 – 2030 (US$M) |
| Figure 5‑205: Leading Competitors, Hip Reconstruction Market, Global, 2023 |
| Figure 6‑1: Bone Cement Markets Covered |
| Figure 6‑2: Bone Cement Regions Covered, Global (1 of 2) |
| Figure 6‑3: Bone Cement Regions Covered, Global (2 of 2) |
| Figure 6‑4: Bone Cement Market by Segment, Global, 2020 – 2030 (US$M) |
| Figure 6‑5: Bone Cement Market by Region, Global, 2020 – 2030 (US$M) |
| Figure 6‑6: Bone Cement Market, Global, 2020 – 2030 |
| Figure 6‑7: Units Sold by Region, Bone Cement Market, Global, 2020 – 2030 |
| Figure 6‑8: Average Selling Price by Region, Bone Cement Market, Global, 2020 – 2030 (US$) |
| Figure 6‑9: Market Value by Region, Bone Cement Market, Global, 2020 – 2030 (US$M) |
| Figure 6‑10: Traditional Bone Cement Market, Global, 2020 – 2030 |
| Figure 6‑11: Units Sold by Region, Traditional Bone Cement Market, Global, 2020 – 2030 |
| Figure 6‑12: Average Selling Price by Region, Traditional Bone Cement Market, Global, 2020 – 2030 (US$) |
| Figure 6‑13: Market Value by Region, Traditional Bone Cement Market, Global, 2020 – 2030 (US$M) |
| Figure 6‑14: Premixed Antibiotic Bone Cement Market, Global, 2020 – 2030 |
| Figure 6‑15: Units Sold by Region, Premixed Antibiotic Bone Cement Market, Global, 2020 – 2030 |
| Figure 6‑16: Average Selling Price by Region, Premixed Antibiotic Bone Cement Market, Global, 2020 – 2030 (US$) |
| Figure 6‑17: Market Value by Region, Premixed Antibiotic Bone Cement Market, Global, 2020 – 2030 (US$M) |
| Figure 6‑18: Leading Competitors, Bone Cement Market, Global, 2023 |