| Figure 1‑1: Soft Tissue Repair Market Share Ranking by Segment, Global, 2021 |
| Figure 1‑2: Companies Researched in this Report |
| Figure 1‑3: Factors Impacting the Soft Tissue Repair Market by Segment, Global |
| Figure 1‑4: Recent Events in the Soft Tissue Repair Market, Global, 2018 – 2022 (1 of 2) |
| Figure 1‑5: Recent Events in the Soft Tissue Repair Market, Global, 2018 – 2022 (2 of 2) |
| Figure 1‑6: Soft Tissue Repair Procedures Covered |
| Figure 1‑7: Soft Tissue Repair Markets Covered (1 of 2) |
| Figure 1‑8: Soft Tissue Repair Markets Covered (2 of 2) |
| Figure 1‑9: Soft Tissue Repair Regions Covered, Global (1 of 2) |
| Figure 1‑10: Soft Tissue Repair Regions Covered, Global (2 of 2) |
| Figure 1‑11: Version History |
| Figure 2‑1: Soft Tissue Repair Market by Segment, Worst Case Scenario, Global, 2018 – 2028 (US$M) |
| Figure 2‑2: Soft Tissue Repair Market by Segment, Base Case Scenario, Global, 2018 – 2028 (US$M) |
| Figure 2‑3: Soft Tissue Repair Market by Segment, Best Case Scenario, Global, 2018 – 2028 (US$M) |
| Figure 4‑1: Breast Reconstruction Products Market by Company |
| Figure 4‑2: Hernia Repair Market Products by Company (1 of 2) |
| Figure 4‑3: Hernia Repair Market Products by Company (2 of 2) |
| Figure 4‑4: Dural Repair Market Products by Company |
| Figure 4‑5: Dental Soft Tissue Regeneration Market by Company |
| Figure 4‑6: Nerve Repair Market by Company |
| Figure 4‑7: Class 2 Device Recall VERITAS Collagen Matrix |
| Figure 4‑8: Class 2 Device Recall Proceed Surgical Mesh |
| Figure 4‑9: Class 2 Device Recall Gentrix Surgical Matrix Thick |
| Figure 4‑10: Class 2 Device Recall DuraMatrix Collagen Dura Substitute Membranes |
| Figure 4‑11: Class 2 Device Recall DuraMatrix Collagen Dura Substitute Membranes |
| Figure 4‑12: Class 2 Device Recall CryoPatch SG Pulmonary Human Cardiac Patch |
| Figure 4‑13: Evaluation of ADM Soft Tissue Reinforcement |
| Figure 4‑14: Biosynthetic Absorbable Mesh vs Standard of Repair for the Surgical Treatment of Infected Incisional Hernia (COMpACT-BIO) |
| Figure 4‑15: Mesh Type in Ventral Hernia Repair |
| Figure 4‑16: Post Market Study of Parietene™ DS Composite Mesh in Ventral Hernia Repair (PPDS) |
| Figure 4‑17: A Comparison of Fortiva and Strattice Tissue Matrices in Complex, Ventral Hernia Repair |
| Figure 4‑18: Clinical Study on the Safety of SAFIL® MESH |
| Figure 4‑19: Biologic Mesh Versus Synthetic Mesh in Repair of Ventral Hernias (ventral hernia) |
| Figure 4‑20: A Prospective, Randomized, Controlled Multi-center Study of ArtiFascia® Dural Repair Patch Compared With Commercially Available Dural Substitutes. |
| Figure 4‑21: To Compare Different Soft Tissue Grafts at the Time of Lateral Ridge Augmentation Procedure |
| Figure 4‑22 TISSIUM™ Nerve Coaptation Device First-in-Human Clinical Trial: |
| Figure 4‑23: Comparison of Processed Nerve Allograft and Collagen Nerve Cuffs for Peripheral Nerve Repair (RECON) |
| Figure 4‑24: Registry of Avance® Nerve Graft's Utilization and Recovery Outcomes Post Peripheral Nerve Reconstruction (RANGER®) |
| Figure 5‑1: Soft Tissue Repair Device Market by Segment, Global, 2018 – 2028 (US$M) |
| Figure 5‑2: Soft Tissue Repair Device Market by Region, Global, 2018 – 2028 (US$M) |
| Figure 5‑3: Leading Competitors, Soft Tissue Repair Device Market by Segment, Global, 2021 |
| Figure 6‑1: Breast Reconstruction Markets Covered |
| Figure 6‑2: Breast Reconstruction Regions Covered, Global (1 of 2) |
| Figure 6‑3: Breast Reconstruction Regions Covered, Global (2 of 2) |
| Figure 6‑4: Breast Reconstruction Procedures by Region, Global, 2018 – 2028 |
| Figure 6‑5: Breast Reconstruction Procedures by Country, North America, 2018 – 2028 |
| Figure 6‑6: Breast Reconstruction Procedures by Country, Latin America, 2018 – 2028 (1 of 2) |
| Figure 6‑7: Breast Reconstruction Procedures by Country, Latin America, 2018 – 2028 (2 of 2) |
| Figure 6‑8: Breast Reconstruction Procedures by Country, Western Europe, 2018 – 2028 |
| Figure 6‑9: Breast Reconstruction Procedures by Country, Central & Eastern Europe, 2018 – 2028 (1 of 2) |
| Figure 6‑10: Breast Reconstruction Procedures by Country, Central & Eastern Europe, 2018 – 2028 (2 of 2) |
| Figure 6‑11: Breast Reconstruction Procedures by Country, Middle East, 2018 – 2028 |
| Figure 6‑12: Breast Reconstruction Procedures by Country, Asia-Pacific, 2018 – 2028 (1 of 3) |
| Figure 6‑13: Breast Reconstruction Procedures by Country, Asia-Pacific, 2018 – 2028 (2 of 3) |
| Figure 6‑14: Breast Reconstruction Procedures by Country, Asia-Pacific, 2018 – 2028 (3 of 3) |
| Figure 6‑15: Breast Reconstruction Procedures by Country, Africa, 2018 – 2028 (1 of 2) |
| Figure 6‑16: Breast Reconstruction Procedures by Country, Africa, 2018 – 2028 (2 of 2) |
| Figure 6‑17: Breast Reconstruction Market by Segment, Global, 2018 – 2028 (US$M) |
| Figure 6‑18: Breast Reconstruction Market by Region, Global, 2018 – 2028 (US$M) |
| Figure 6‑19: Breast Reconstruction Market, Global, 2018 – 2028 |
| Figure 6‑20: Units Sold by Region, Breast Reconstruction Market, Global, 2018 – 2028 |
| Figure 6‑21: Average Selling Price by Region, Breast Reconstruction Market, Global, 2018 – 2028 (US$) |
| Figure 6‑22: Market Value by Region, Breast Reconstruction Market, Global, 2018 – 2028 (US$M) |
| Figure 6‑23: Allograft Breast Reconstruction Market, Global, 2018 – 2028 |
| Figure 6‑24: Units Sold by Region, Allograft Breast Reconstruction Market, Global, 2018 – 2028 |
| Figure 6‑25: Average Selling Price by Region, Allograft Breast Reconstruction Market, Global, 2018 – 2028 (US$) |
| Figure 6‑26: Market Value by Region, Allograft Breast Reconstruction Market, Global, 2018 – 2028 (US$M) |
| Figure 6‑27: Xenograft Breast Reconstruction Market, Global, 2018 – 2028 |
| Figure 6‑28: Units Sold by Region, Xenograft Breast Reconstruction Market, Global, 2018 – 2028 |
| Figure 6‑29: Average Selling Price by Region, Xenograft Breast Reconstruction Market, Global, 2018 – 2028 (US$) |
| Figure 6‑30: Market Value by Region, Xenograft Breast Reconstruction Market, Global, 2018 – 2028 (US$M) |
| Figure 6‑31: Synthetic Breast Reconstruction Market, Global, 2018 – 2028 |
| Figure 6‑32: Units Sold by Region, Synthetic Breast Reconstruction Market, Global, 2018 – 2028 |
| Figure 6‑33: Average Selling Price by Region, Synthetic Breast Reconstruction Market, Global, 2018 – 2028 (US$) |
| Figure 6‑34: Market Value by Region, Synthetic Breast Reconstruction Market, Global, 2018 – 2028 (US$M) |
| Figure 6‑35: Leading Competitors, Breast Reconstruction Market, Global, 2021 |
| Figure 7‑1: Hernia Repair Procedures Covered |
| Figure 7‑2: Hernia Repair Markets Covered |
| Figure 7‑3: Hernia Repair Regions Covered, Global (1 of 2) |
| Figure 7‑4: Hernia Repair Regions Covered, Global (2 of 2) |
| Figure 7‑5: Hernia Repair Procedures by Segment, Global, 2018 – 2028 |
| Figure 7‑6: Hernia Repair Procedures by Region, Global, 2018 – 2028 |
| Figure 7‑7: Hernia Repair Procedures by Country, North America, 2018 – 2028 |
| Figure 7‑8: Hernia Repair Procedures by Country, Latin America, 2018 – 2028 (1 of 2) |
| Figure 7‑9: Hernia Repair Procedures by Country, Latin America, 2018 – 2028 (2 of 2) |
| Figure 7‑10: Hernia Repair Procedures by Country, Western Europe, 2018 – 2028 |
| Figure 7‑11: Hernia Repair Procedures by Country, Central & Eastern Europe, 2018 – 2028 (1 of 2) |
| Figure 7‑12: Hernia Repair Procedures by Country, Central & Eastern Europe, 2018 – 2028 (2 of 2) |
| Figure 7‑13: Hernia Repair Procedures by Country, Middle East, 2018 – 2028 |
| Figure 7‑14: Hernia Repair Procedures by Country, Asia-Pacific, 2018 – 2028 (1 of 3) |
| Figure 7‑15: Hernia Repair Procedures by Country, Asia-Pacific, 2018 – 2028 (2 of 3) |
| Figure 7‑16: Hernia Repair Procedures by Country, Asia-Pacific, 2018 – 2028 (3 of 3) |
| Figure 7‑17: Hernia Repair Procedures by Country, Africa, 2018 – 2028 (1 of 2) |
| Figure 7‑18: Hernia Repair Procedures by Country, Africa, 2018 – 2028 (2 of 2) |
| Figure 7‑19: Ventral Hernia Repair Procedures by Region, Global, 2018 – 2028 |
| Figure 7‑20: Inguinal Hernia Repair Procedures by Region, Global, 2018 – 2028 |
| Figure 7‑21: Hiatal Hernia Repair Procedures by Region, Global, 2018 – 2028 |
| Figure 7‑22: Hernia Repair Market by Segment, Global, 2018 – 2028 (US$M) |
| Figure 7‑23: Hernia Repair Market by Region, Global, 2018 – 2028 (US$M) |
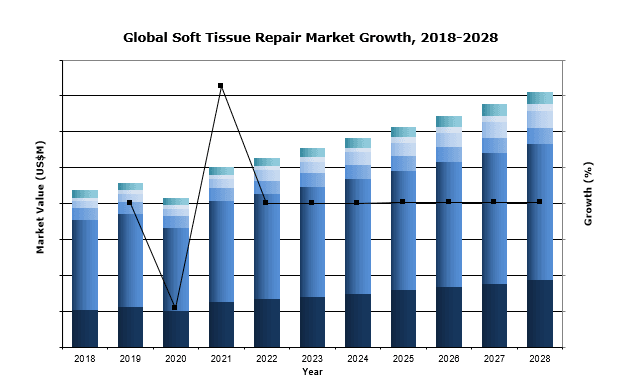
| Figure 7‑24: Hernia Repair Market, Global, 2018 – 2028 |
| Figure 7‑25: Units Sold by Region, Hernia Repair Market, Global, 2018 – 2028 |
| Figure 7‑26: Average Selling Price by Region, Hernia Repair Market, Global, 2018 – 2028 (US$) |
| Figure 7‑27: Market Value by Region, Hernia Repair Market, Global, 2018 – 2028 (US$M) |
| Figure 7‑28: Ventral Hernia Repair Market by Segment, Global, 2018 – 2028 (US$M) |
| Figure 7‑29: Total Ventral Hernia Repair Market, Global, 2018 – 2028 |
| Figure 7‑30: Units Sold by Region, Ventral Hernia Repair Market, Global, 2018 – 2028 |
| Figure 7‑31: Average Selling Price by Region, Ventral Hernia Repair Market, Global, 2018 – 2028 (US$) |
| Figure 7‑32: Market Value by Region, Ventral Hernia Repair Market, Global, 2018 – 2028 (US$M) |
| Figure 7‑33: Allograft Ventral Hernia Repair Market, Global, 2018 – 2028 |
| Figure 7‑34: Units Sold by Region, Allograft Ventral Hernia Repair Market, Global, 2018 – 2028 |
| Figure 7‑35: Average Selling Price by Region, Allograft Ventral Hernia Repair Market, Global, 2018 – 2028 (US$) |
| Figure 7‑36: Market Value by Region, Allograft Ventral Hernia Repair Market, Global, 2018 – 2028 (US$M) |
| Figure 7‑37: Xenograft Ventral Hernia Repair Market, Global, 2018 – 2028 |
| Figure 7‑38: Units Sold by Region, Xenograft Ventral Hernia Repair Market, Global, 2018 – 2028 |
| Figure 7‑39: Average Selling Price by Region, Xenograft Ventral Hernia Repair Market, Global, 2018 – 2028 (US$) |
| Figure 7‑40: Market Value by Region, Xenograft Ventral Hernia Repair Market, Global, 2018 – 2028 (US$M) |
| Figure 7‑41: Synthetic Ventral Hernia Repair Market, Global, 2018 – 2028 |
| Figure 7‑42: Units Sold by Region, Synthetic Ventral Hernia Repair Market, Global, 2018 – 2028 |
| Figure 7‑43: Average Selling Price by Region, Synthetic Ventral Hernia Repair Market, Global, 2018 – 2028 (US$) |
| Figure 7‑44: Market Value by Region, Synthetic Ventral Hernia Repair Market, Global, 2018 – 2028 (US$M) |
| Figure 7‑45: Inguinal Hernia Repair Market by Segment, Global, 2018 – 2028 (US$M) |
| Figure 7‑46: Total Inguinal Hernia Repair Market, Global, 2018 – 2028 |
| Figure 7‑47: Units Sold by Region, Inguinal Hernia Repair Market, Global, 2018 – 2028 |
| Figure 7‑48: Average Selling Price by Region, Inguinal Hernia Repair Market, Global, 2018 – 2028 (US$) |
| Figure 7‑49: Market Value by Region, Inguinal Hernia Repair Market, Global, 2018 – 2028 (US$M) |
| Figure 7‑50: Allograft Inguinal Hernia Repair Market, Global, 2018 – 2028 |
| Figure 7‑51: Units Sold by Region, Allograft Inguinal Hernia Repair Market, Global, 2018 – 2028 |
| Figure 7‑52: Average Selling Price by Region, Allograft Inguinal Hernia Repair Market, Global, 2018 – 2028 (US$) |
| Figure 7‑53: Market Value by Region, Allograft Inguinal Hernia Repair Market, Global, 2018 – 2028 (US$M) |
| Figure 7‑54: Xenograft Inguinal Hernia Repair Market, Global, 2018 – 2028 |
| Figure 7‑55: Units Sold by Region, Xenograft Inguinal Hernia Repair Market, Global, 2018 – 2028 |
| Figure 7‑56: Average Selling Price by Region, Xenograft Inguinal Hernia Repair Market, Global, 2018 – 2028 (US$) |
| Figure 7‑57: Market Value by Region, Xenograft Inguinal Hernia Repair Market, Global, 2018 – 2028 (US$M) |
| Figure 7‑58: Synthetic Inguinal Hernia Repair Market, Global, 2018 – 2028 |
| Figure 7‑59: Units Sold by Region, Synthetic Inguinal Hernia Repair Market, Global, 2018 – 2028 |
| Figure 7‑60: Average Selling Price by Region, Synthetic Inguinal Hernia Repair Market, Global, 2018 – 2028 (US$) |
| Figure 7‑61: Market Value by Region, Synthetic Inguinal Hernia Repair Market, Global, 2018 – 2028 (US$M) |
| Figure 7‑62: Hiatal Hernia Repair Market by Segment, Global, 2018 – 2028 (US$M) |
| Figure 7‑63: Total Hiatal Hernia Repair Market, Global, 2018 – 2028 |
| Figure 7‑64: Units Sold by Region, Hiatal Hernia Repair Market, Global, 2018 – 2028 |
| Figure 7‑65: Average Selling Price by Region, Hiatal Hernia Repair Market, Global, 2018 – 2028 (US$) |
| Figure 7‑66: Market Value by Region, Hiatal Hernia Repair Market, Global, 2018 – 2028 (US$M) |
| Figure 7‑67: Allograft Hiatal Hernia Repair Market, Global, 2018 – 2028 |
| Figure 7‑68: Units Sold by Region, Allograft Hiatal Hernia Repair Market, Global, 2018 – 2028 |
| Figure 7‑69: Average Selling Price by Region, Allograft Hiatal Hernia Repair Market, Global, 2018 – 2028 (US$) |
| Figure 7‑70: Market Value by Region, Allograft Hiatal Hernia Repair Market, Global, 2018 – 2028 (US$M) |
| Figure 7‑71: Xenograft Hiatal Hernia Repair Market, Global, 2018 – 2028 |
| Figure 7‑72: Units Sold by Region, Xenograft Hiatal Hernia Repair Market, Global, 2018 – 2028 |
| Figure 7‑73: Average Selling Price by Region, Xenograft Hiatal Hernia Repair Market, Global, 2018 – 2028 (US$) |
| Figure 7‑74: Market Value by Region, Xenograft Hiatal Hernia Repair Market, Global, 2018 – 2028 (US$M) |
| Figure 7‑75: Synthetic Hiatal Hernia Repair Market, Global, 2018 – 2028 |
| Figure 7‑76: Units Sold by Region, Synthetic Hiatal Hernia Repair Market, Global, 2018 – 2028 |
| Figure 7‑77: Average Selling Price by Region, Synthetic Hiatal Hernia Repair Market, Global, 2018 – 2028 (US$) |
| Figure 7‑78: Market Value by Region, Synthetic Hiatal Hernia Repair Market, Global, 2018 – 2028 (US$M) |
| Figure 7‑79: Leading Competitors, Hernia Repair Market, Global, 2021 |
| Figure 8‑1: Dural Repair Procedures Covered |
| Figure 8‑2: Dural Repair Markets Covered |
| Figure 8‑3: Dural Repair Regions Covered, Global (1 of 2) |
| Figure 8‑4: Dural Repair Regions Covered, Global (2 of 2) |
| Figure 8‑5: Dural Repair Procedures by Region, Global, 2018 – 2028 |
| Figure 8‑6: Dural Repair Market by Segment, Global, 2018 – 2028 (US$M) |
| Figure 8‑7: Dural Repair Market by Region, Global, 2018 – 2028 (US$M) |
| Figure 8‑8: Dural Repair Market, Global, 2018 – 2028 |
| Figure 8‑9: Units Sold by Region, Dural Repair Market, Global, 2018 – 2028 |
| Figure 8‑10: Average Selling Price by Region, Dural Repair Market, Global, 2018 – 2028 (US$) |
| Figure 8‑11: Market Value by Region, Dural Repair Market, Global, 2018 – 2028 (US$M) |
| Figure 8‑12: Allograft Dural Repair Market, Global, 2018 – 2028 |
| Figure 8‑13: Units Sold by Region, Allograft Dural Repair Market, Global, 2018 – 2028 |
| Figure 8‑14: Average Selling Price by Region, Allograft Dural Repair Market, Global, 2018 – 2028 (US$) |
| Figure 8‑15: Market Value by Region, Allograft Dural Repair Market, Global, 2018 – 2028 (US$M) |
| Figure 8‑16: Xenograft Dural Repair Market, Global, 2018 – 2028 |
| Figure 8‑17: Units Sold by Region, Xenograft Dural Repair Market, Global, 2018 – 2028 |
| Figure 8‑18: Average Selling Price by Region, Xenograft Dural Repair Market, Global, 2018 – 2028 (US$) |
| Figure 8‑19: Market Value by Region, Xenograft Dural Repair Market, Global, 2018 – 2028 (US$M) |
| Figure 8‑20: Synthetic Dural Repair Market, Global, 2018 – 2028 |
| Figure 8‑21: Units Sold by Region, Synthetic Dural Repair Market, Global, 2018 – 2028 |
| Figure 8‑22: Average Selling Price by Region, Synthetic Dural Repair Market, Global, 2018 – 2028 (US$) |
| Figure 8‑23: Market Value by Region, Synthetic Dural Repair Market, Global, 2018 – 2028 (US$M) |
| Figure 8‑24: Leading Competitors, Dural Repair Market, Global, 2021 |
| Figure 9‑1: Dental Soft Tissue Regeneration Procedures Covered |
| Figure 9‑2: Dental Soft Tissue Regeneration Markets Covered |
| Figure 9‑3: Dental Soft Tissue Regeneration Regions Covered, Global (1 of 2) |
| Figure 9‑4: Dental Soft Tissue Regeneration Regions Covered, Global (2 of 2) |
| Figure 9‑5: Dental Soft Tissue Regeneration Procedures by Region, Global, 2018 – 2028 |
| Figure 9‑6: Dental Soft Tissue Regeneration Market by Segment, Global, 2018 – 2028 (US$M) |
| Figure 9‑7: Dental Soft Tissue Regeneration Market by Region, Global, 2018 – 2028 (US$M) |
| Figure 9‑8: Dental Soft Tissue Regeneration Market, Global, 2018 – 2028 |
| Figure 9‑9: Units Sold by Region, Dental Soft Tissue Regeneration Market, Global, 2018 – 2028 |
| Figure 9‑10: Average Selling Price by Region, Dental Soft Tissue Regeneration Market, Global, 2018 – 2028 (US$) |
| Figure 9‑11: Market Value by Region, Dental Soft Tissue Regeneration Market, Global, 2018 – 2028 (US$M) |
| Figure 9‑12: Dental Wound Care Market by Segment, Global, 2018 – 2028 (US$M) |
| Figure 9‑13: Dental Wound Care Market, Global, 2018 – 2028 |
| Figure 9‑14: Units Sold by Region, Dental Wound Care Market, Global, 2018 – 2028 |
| Figure 9‑15: Average Selling Price by Region, Dental Wound Care Market, Global, 2018 – 2028 (US$) |
| Figure 9‑16: Market Value by Region, Dental Wound Care Market, Global, 2018 – 2028 (US$M) |
| Figure 9‑17: Plug Dental Soft Tissue Wound Care Market, Global, 2018 – 2028 |
| Figure 9‑18: Units Sold by Region, Plug Dental Wound Care Market, Global, 2018 – 2028 |
| Figure 9‑19: Average Selling Price by Region, Plug Dental Wound Care Market, Global, 2018 – 2028 (US$) |
| Figure 9‑20: Market Value by Region, Plug Dental Wound Care Market, Global, 2018 – 2028 (US$M) |
| Figure 9‑21: Tape Dental Wound Care Market, Global, 2018 – 2028 |
| Figure 9‑22: Units Sold by Region, Tape Dental Wound Care Market, Global, 2018 – 2028 |
| Figure 9‑23: Average Selling Price by Region, Tape Dental Wound Care Market, Global, 2018 – 2028 (US$) |
| Figure 9‑24: Market Value by Region, Tape Dental Wound Care Market, Global, 2018 – 2028 (US$M) |
| Figure 9‑25: Foam Dental Wound Care Market, Global, 2018 – 2028 |
| Figure 9‑26: Units Sold by Region, Foam Dental Wound Care Market, Global, 2018 – 2028 |
| Figure 9‑27: Average Selling Price by Region, Foam Dental Wound Care Market, Global, 2018 – 2028 (US$) |
| Figure 9‑28: Market Value by Region, Foam Dental Wound Care Market, Global, 2018 – 2028 (US$M) |
| Figure 9‑29: Leading Competitors, Dental Soft Tissue Regeneration Market, Global, 2021 |
| Figure 10‑1: Nerve Repair Procedures Covered |
| Figure 10‑2: Nerve Repair Markets Covered |
| Figure 10‑3: Nerve Repair Regions Covered, Global (1 of 2) |
| Figure 10‑4: Nerve Repair Regions Covered, Global (2 of 2) |
| Figure 10‑5: Nerve Repair Procedures by Region, Global, 2018 – 2028 |
| Figure 10‑6: Nerve Repair Market by Segment, Global, 2018 – 2028 (US$M) |
| Figure 10‑7: Nerve Repair Market by Region, Global, 2018 – 2028 (US$M) |
| Figure 10‑8: Nerve Repair Market, Global, 2018 – 2028 |
| Figure 10‑9: Units Sold by Region, Nerve Repair Market, Global, 2018 – 2028 |
| Figure 10‑10: Average Selling Price by Region, Nerve Repair Market, Global, 2018 – 2028 (US$) |
| Figure 10‑11: Market Value by Region, Nerve Repair Market, Global, 2018 – 2028 (US$M) |
| Figure 10‑12: Nerve Wrap Market, Global, 2018 – 2028 |
| Figure 10‑13: Units Sold by Region, Nerve Wrap Market, Global, 2018 – 2028 |
| Figure 10‑14: Average Selling Price by Region, Nerve Wrap Market, Global, 2018 – 2028 (US$) |
| Figure 10‑15: Market Value by Region, Nerve Wrap Market, Global, 2018 – 2028 (US$M) |
| Figure 10‑16: Nerve Tube Market, Global, 2018 – 2028 |
| Figure 10‑17: Units Sold by Region, Nerve Tube Market, Global, 2018 – 2028 |
| Figure 10‑18: Average Selling Price by Region, Nerve Tube Market, Global, 2018 – 2028 (US$) |
| Figure 10‑19: Market Value by Region, Nerve Tube Market, Global, 2018 – 2028 (US$M) |
| Figure 10‑20: Leading Competitors, Nerve Repair Market, Global, 2021 |
| Figure 11‑1: Cardiovascular Patch Repair Procedures Covered |
| Figure 11‑2: Cardiovascular Patch Repair Markets Covered |
| Figure 11‑3: Cardiovascular Patch Repair Regions Covered, Global (1 of 2) |
| Figure 11‑4: Cardiovascular Patch Repair Regions Covered, Global (2 of 2) |
| Figure 11‑5: Cardiovascular Patch Repair Procedures by Region, Global, 2018 – 2028 |
| Figure 11‑6: Cardiovascular Patch Repair Market by Segment, Global, 2018 – 2028 (US$M) |
| Figure 11‑7: Cardiovascular Patch Repair Market by Region, Global, 2018 – 2028 (US$M) |
| Figure 11‑8: Cardiovascular Patch Repair Market, Global, 2018 – 2028 |
| Figure 11‑9: Units Sold by Region, Cardiovascular Patch Repair Market, Global, 2018 – 2028 |
| Figure 11‑10: Average Selling Price by Region, Cardiovascular Patch Repair Market, Global, 2018 – 2028 (US$) |
| Figure 11‑11: Market Value by Region, Cardiovascular Patch Repair Market, Global, 2018 – 2028 (US$M) |
| Figure 11‑12: Cardiac Patch Market by Segment, Global, 2018 – 2028 (US$M) |
| Figure 11‑13: Total Cardiac Patch Market, Global, 2018 – 2028 |
| Figure 11‑14: Units Sold by Region, Cardiac Patch Market, Global, 2018 – 2028 |
| Figure 11‑15: Average Selling Price by Region, Cardiac Patch Market, Global, 2018 – 2028 (US$) |
| Figure 11‑16: Market Value by Region, Cardiac Patch Market, Global, 2018 – 2028 (US$M) |
| Figure 11‑17: Allograft Cardiac Patch Market, Global, 2018 – 2028 |
| Figure 11‑18: Units Sold by Region, Allograft Cardiac Patch Market, Global, 2018 – 2028 |
| Figure 11‑19: Average Selling Price by Region, Allograft Cardiac Patch Market, Global, 2018 – 2028 (US$) |
| Figure 11‑20: Market Value by Region, Allograft Cardiac Patch Market, Global, 2018 – 2028 (US$M) |
| Figure 11‑21: Xenograft Cardiac Patch Market, Global, 2018 – 2028 |
| Figure 11‑22: Units Sold by Region, Xenograft Cardiac Patch Market, Global, 2018 – 2028 |
| Figure 11‑23: Average Selling Price by Region, Xenograft Cardiac Patch Market, Global, 2018 – 2028 (US$) |
| Figure 11‑24: Market Value by Region, Xenograft Cardiac Patch Market, Global, 2018 – 2028 (US$M) |
| Figure 11‑25: Synthetic Cardiac Patch Market, Global, 2018 – 2028 |
| Figure 11‑26: Units Sold by Region, Synthetic Cardiac Patch Market, Global, 2018 – 2028 |
| Figure 11‑27: Average Selling Price by Region, Synthetic Cardiac Patch Market, Global, 2018 – 2028 (US$) |
| Figure 11‑28: Market Value by Region, Synthetic Cardiac Patch Market, Global, 2018 – 2028 (US$M) |
| Figure 11‑29: Vascular Patch Market, Global, 2018 – 2028 |
| Figure 11‑30: Units Sold by Region, Vascular Patch Market, Global, 2018 – 2028 |
| Figure 11‑31: Average Selling Price by Region, Vascular Patch Market, Global, 2018 – 2028 (US$) |
| Figure 11‑32: Market Value by Region, Vascular Patch Market, Global, 2018 – 2028 (US$M) |
| Figure 11‑33: Leading Competitors, Cardiovascular Patch Repair Market, Global, 2021 |