| Figure 1‑1: Video and Integrated Operating Room Equipment Market Share Ranking by Segment, U.S., 2024 (1 of 3) |
| Figure 1‑2: Video and Integrated Operating Room Equipment Market Share Ranking by Segment, U.S., 2024 (2 of 3) |
| Figure 1‑3: Video and Integrated Operating Room Equipment Market Share Ranking by Segment, U.S., 2024 (3 of 3) |
| Figure 1‑4: Companies Researched in This Report (1 of 2) |
| Figure 1‑5: Companies Researched in This Report (2 of 2) |
| Figure 1‑6: Recent Events in the Video and Integrated Operating Room Equipment Market, U.S., 2021 – 2025 (1 of 3) |
| Figure 1‑7: Recent Events in the Video and Integrated Operating Room Equipment Market, U.S., 2021 – 2025 (2 of 3) |
| Figure 1‑8: Recent Events in the Video and Integrated Operating Room Equipment Market, U.S., 2021 – 2025 (3 of 3) |
| Figure 1‑9: Factors Impacting the Video and Integrated Operating Room Equipment Market by Segment, U.S. (1 of 3) |
| Figure 1‑10: Factors Impacting the Video and Integrated Operating Room Equipment Market by Segment, U.S. (2 of 3) |
| Figure 1‑11: Factors Impacting the Video and Integrated Operating Room Equipment Market by Segment, U.S. (3 of 3) |
| Figure 1‑12: Video and Integrated Operating Room Equipment Markets Covered (1 of 3) |
| Figure 1‑13: Video and Integrated Operating Room Equipment Markets Covered (2 of 3) |
| Figure 1‑14: Video and Integrated Operating Room Equipment Markets Covered (3 of 3) |
| Figure 1‑15: Key Report Updates |
| Figure 1‑16: Version History |
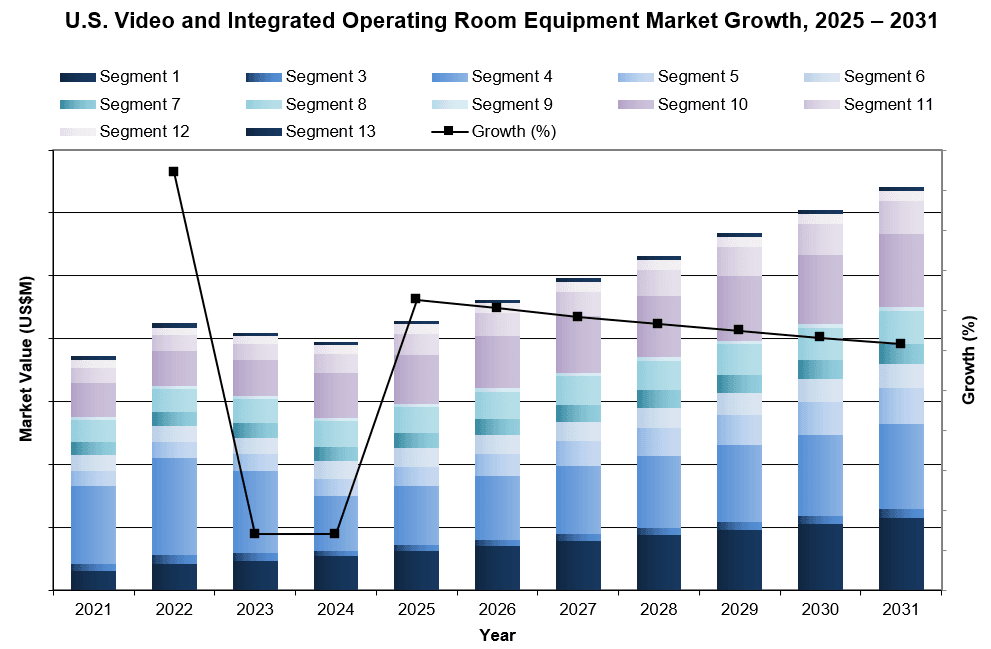
| Figure 3‑1: Video and Integrated Operating Room Equipment Market by Segment, U.S., 2021 – 2031 (US$M) (1 of 2) |
| Figure 3‑2: Video and Integrated Operating Room Equipment Market by Segment, U.S., 2021 – 2031 (US$M) (2 of 2) |
| Figure 3‑3: Leading Competitors, Video and Integrated Operating Room Equipment Market, U.S., 2024 (1 of 2) |
| Figure 3‑4: Leading Competitors, Video and Integrated Operating Room Equipment Market, U.S., 2024 (2 of 2) |
| Figure 4‑1: Integrated Operating Room Market by Segment, U.S., 2021 – 2031 (US$M) |
| Figure 4‑2: Integrated Operating Room Market, U.S., 2021 – 2031 |
| Figure 4‑3: Hospital Integrated Operating Room Component Market, U.S., 2021 – 2031 |
| Figure 4‑4: ASC Integrated Operating Room Component Market, U.S., 2021 – 2031 |
| Figure 4‑5: Total Integrated Operating Room Installed Base, U.S., 2021 – 2031 |
| Figure 4‑6: Hospital Integrated OR Installed Base, U.S., 2021 – 2031 |
| Figure 4‑7: ASC Integrated OR Installed Base, U.S., 2021 – 2031 |
| Figure 4‑8: Total Integrated Operating Room Installed Base by Specialty, U.S., 2024 |
| Figure 4‑9: Total Integrated Operating Room ASP by Component, U.S., 2021 – 2031 |
| Figure 4‑10: Hospital Integrated Operating Room ASP by Component, U.S., 2021 – 2031 |
| Figure 4‑11: ASC Integrated Operating Room ASP by Component, U.S., 2021 – 2031 |
| Figure 4‑12: Leading Competitors, Integrated Operating Room Market, U.S., 2024 |
| Figure 5‑1: Integrated Operating Room Management Software Market by Segment, U.S., 2021 – 2031 (US$M) |
| Figure 5‑2: Integrated Operating Room Management Software Market, U.S., 2021 – 2031 |
| Figure 5‑3: Hospital Integrated Operating Room Management Software Market, U.S., 2021 – 2031 |
| Figure 5‑4: ASC Integrated Operating Room Management Software Market, U.S., 2021 – 2031 |
| Figure 5‑5: Total Integrated Operating Room Management Software Installed Base, U.S., 2021 – 2031 |
| Figure 5‑6: Hospital Integrated OR Software Installed Base, U.S., 2021 – 2031 |
| Figure 5‑7: ASC Integrated OR Software Installed Base, U.S., 2021 – 2031 |
| Figure 5‑8: Leading Competitors, Integrated Operating Room Management Software Market, U.S., 2024 |
| Figure 6‑1: Hybrid Operating Room Market, U.S., 2021 – 2031 |
| Figure 6‑2: Total Hybrid Operating Room Installed Base, U.S., 2021 – 2031 |
| Figure 6‑3: Leading Competitors, Hybrid Operating Room Market, U.S., 2024 |
| Figure 7‑1: Hybrid Operating Room Imaging System Market by Segment, U.S., 2021 – 2031 (US$M) |
| Figure 7‑2: Hybrid Operating Room Imaging System Market, U.S., 2021 – 2031 |
| Figure 7‑3: MRI Hybrid Operating Room Imaging System Market, U.S., 2021 – 2031 |
| Figure 7‑4: CT Hybrid Operating Room Imaging System Market, U.S., 2021 – 2031 |
| Figure 7‑5: Angiography Hybrid Operating Room Imaging System Market, U.S., 2021 – 2031 |
| Figure 7‑6: Total Hybrid Operating Room Imaging System Installed Base, U.S., 2021 – 2031 |
| Figure 7‑7: Leading Competitors, Hybrid Operating Room Imaging System Market, U.S., 2024 |
| Figure 8‑1: Surgical Display and PACS Monitor Market by Segment, U.S., 2021 – 2031 (US$M) |
| Figure 8‑2: Total Surgical Display and PACS Monitor Market, U.S., 2021 – 2031 |
| Figure 8‑3: Surgical Display Market by Segment, U.S., 2021 – 2031 |
| Figure 8‑4: Surgical Display Market, U.S., 2021 – 2031 |
| Figure 8‑5: Total HD Surgical Display Market, U.S., 2021 – 2031 |
| Figure 8‑6: HD Surgical Display Market by Segment, U.S., 2021 – 2031 |
| Figure 8‑7: HD Surgical Display ≤27” Market, U.S., 2021 – 2031 |
| Figure 8‑8: HD Surgical Display ≥31” Market, U.S., 2021 – 2031 |
| Figure 8‑9: HD Surgical Display Market by Care Setting, U.S., 2021 – 2031 |
| Figure 8‑10: Hospital HD Surgical Display Market, U.S., 2021 – 2031 |
| Figure 8‑11: ASC HD Surgical Display Market, U.S., 2021 – 2031 |
| Figure 8‑12: Total 4K Surgical Display Market, U.S., 2021 – 2031 |
| Figure 8‑13: 4K Surgical Display Market by Segment, U.S., 2021 – 2031 |
| Figure 8‑14: 4K Surgical Display ≤32” Market, U.S., 2021 – 2031 |
| Figure 8‑15: 4K Surgical Display ≥55” Market, U.S., 2021 – 2031 |
| Figure 8‑16: 4K Surgical Display Market by Care Setting, U.S., 2021 – 2031 |
| Figure 8‑17: Hospital 4K Surgical Display Market, U.S., 2021 – 2031 |
| Figure 8‑18: ASC 4K Surgical Display Market, U.S., 2021 – 2031 |
| Figure 8‑19: 3D Surgical Display Market, U.S., 2021 – 2031 |
| Figure 8‑20: 3D Surgical Display Market by Care Setting, U.S., 2021 – 2031 |
| Figure 8‑21: Hospital 3D Surgical Display Market, U.S., 2021 – 2031 |
| Figure 8‑22: ASC 3D Surgical Display Market, U.S., 2021 – 2031 |
| Figure 8‑23: 8-Megapixel UHD Surgical Display Market, U.S., 2021 – 2031 |
| Figure 8‑24: 8-Megapixel UHD Surgical Display Market by Care Setting, U.S., 2021 – 2031 |
| Figure 8‑25: Hospital 8-Megapixel UHD Surgical Display Market, U.S., 2021 – 2031 |
| Figure 8‑26: ASC 8-Megapixel UHD Surgical Display Market, U.S., 2021 – 2031 |
| Figure 8‑27: PACS Monitor Market, U.S., 2021 – 2031 |
| Figure 8‑28: Leading Competitors, Surgical Display and PACS Monitor Market by Manufacturer, U.S., 2022 |
| Figure 8‑29: Leading Competitors, Surgical Display and PACS Monitor Market by Distributor, U.S., 2024 |
| Figure 9‑1: Surgical Lighting Market by Segment, U.S., 2021 – 2031 (US$M) |
| Figure 9‑2: Surgical Lighting Market, U.S., 2021 – 2031 |
| Figure 9‑3: Hospital OR Surgical Lighting Market, U.S., 2021 – 2031 |
| Figure 9‑4: ASC OR Surgical Lighting Market, U.S., 2021 – 2031 |
| Figure 9‑5: Leading Competitors, Surgical Lighting Market, U.S., 2024 |
| Figure 10‑1: Surgical Boom Market by Segment, U.S., 2021 – 2031 (US$M) |
| Figure 10‑2: Surgical Boom Market, U.S., 2021 – 2031 |
| Figure 10‑3: Equipment Boom Market, U.S., 2021 – 2031 |
| Figure 10‑4: Anesthesia/Nursing Boom Market, U.S., 2021 – 2031 |
| Figure 10‑5: Utility Boom Market, U.S., 2021 – 2031 |
| Figure 10‑6: Total Surgical Boom Market by Setting, U.S., 2021 – 2031 (US$M) |
| Figure 10‑7: Hospital Surgical Boom Market by Segment, U.S., 2019 – 2029 (US$M) |
| Figure 10‑8: Total Hospital OR Surgical Boom Market, U.S., 2021 – 2031 |
| Figure 10‑9: Hospital OR Equipment Surgical Boom Market, U.S., 2021 – 2031 |
| Figure 10‑10: Hospital OR Anesthesia/Nursing Surgical Boom Market, U.S., 2021 – 2031 |
| Figure 10‑11: Hospital Utility Boom Market, U.S., 2021 – 2031 |
| Figure 10‑12: ASC OR Surgical Boom Market by Segment, U.S., 2021 – 2031 (US$M) |
| Figure 10‑13: Total ASC OR Surgical Boom Market, U.S., 2021 – 2031 |
| Figure 10‑14: ASC OR Equipment Surgical Boom Market, U.S., 2021 – 2031 |
| Figure 10‑15: ASC OR Anesthesia/Nursing Surgical Boom Market, U.S., 2021 – 2031 |
| Figure 10‑16: ASC Utility Boom Market, U.S., 2021 – 2031 |
| Figure 10‑17: Leading Competitors, Surgical Boom Market, U.S., 2024 |
| Figure 11‑1: Surgical Table Market by Segment, U.S., 2021 – 2031 (US$M) |
| Figure 11‑2: Total Surgical Table Market, U.S., 2021 – 2031 |
| Figure 11‑3: General Surgical Table Market, U.S., 2021 – 2031 |
| Figure 11‑4: Specialty Surgical Table Market by Segment, U.S., 2021 – 2031 |
| Figure 11‑5: Specialty Surgical Table Market, U.S., 2021 – 2031 |
| Figure 11‑6: Orthopedic Surgical Table Market by Segment, U.S., 2021 – 2031 |
| Figure 11‑7: Total Orthopedic Surgical Table Market, U.S., 2021 – 2031 |
| Figure 11‑8: Standard Orthopedic Surgical Table Market, U.S., 2021 – 2031 |
| Figure 11‑9: Multifunctional Orthopedic Surgical Table Market, U.S., 2021 – 2031 |
| Figure 11‑10: Spinal Surgical Table Market, U.S., 2021 – 2031 |
| Figure 11‑11: Neurosurgical Table Market, U.S., 2021 – 2031 |
| Figure 11‑12: Image-Guided Surgical Table Market by Segment, U.S., 2021 – 2031 |
| Figure 11‑13: Total Image-Guided Surgical Table Market, U.S., 2021 – 2031 |
| Figure 11‑14: Integrated Image-Guided Surgical Table Market, U.S., 2021 – 2031 |
| Figure 11‑15: Non-Integrated Image-Guided Surgical Table Market, U.S., 2021 – 2031 |
| Figure 11‑16: Total Surgical Table Market by Setting, U.S., 2021 – 2031 |
| Figure 11‑17: Hospital Surgical Table Market by Segment, U.S., 2021 – 2031 (US$M) |
| Figure 11‑18: Total Hospital Surgical Table Market, U.S., 2021 – 2031 |
| Figure 11‑19: Hospital General Surgical Table Market, U.S., 2021 – 2031 |
| Figure 11‑20: Hospital Orthopedic Surgical Table Market, U.S., 2021 – 2031 |
| Figure 11‑21: Hospital Spinal Surgical Table Market, U.S., 2021 – 2031 |
| Figure 11‑22: Hospital Neurosurgical Table Market, U.S., 2021 – 2031 |
| Figure 11‑23: Hospital Image-Guided Surgical Table Market, U.S., 2021 – 2031 |
| Figure 11‑24: ASC Surgical Table Market by Segment, U.S., 2021 – 2031 (US$M) |
| Figure 11‑25: Total ASC Surgical Table Market, U.S., 2021 – 2031 |
| Figure 11‑26: ASC General Surgical Table Market, U.S., 2021 – 2031 |
| Figure 11‑27: ASC Orthopedic Surgical Table Market, U.S., 2021 – 2031 |
| Figure 11‑28: ASC Spinal Surgical Table Market, U.S., 2021 – 2031 |
| Figure 11‑29: ASC Neurosurgical Table Market, U.S., 2021 – 2031 |
| Figure 11‑30: ASC Image-Guided Surgical Table Market, U.S., 2021 – 2031 |
| Figure 11‑31: Leading Competitors, Surgical Table Market, U.S., 2024 |
| Figure 11‑32: Leading Competitors, Specialty Surgical Table Market, U.S., 2024 |
| Figure 12‑1: Surgical Headlight Market, U.S., 2021 – 2031 |
| Figure 12‑2: Leading Competitors, Surgical Headlight Market, U.S., 2024 |
| Figure 13‑1: Surgical Camera System Market by Segment, U.S., 2021 – 2031 (US$M) |
| Figure 13‑2: Total Surgical Camera System Market, U.S., 2021 – 2031 |
| Figure 13‑3: HD Camera System Market by Segment, U.S., 2021 – 2031 (US$M) |
| Figure 13‑4: HD Camera System Market, U.S., 2021 – 2031 |
| Figure 13‑5: HD Surgical Camera Head Market, U.S., 2021 – 2031 |
| Figure 13‑6: HD Camera Control Unit Market, U.S., 2021 – 2031 |
| Figure 13‑7: 4K Camera System Market by Segment, U.S., 2021 – 2031 (US$M) |
| Figure 13‑8: 4K Camera System Market, U.S., 2021 – 2031 |
| Figure 13‑9: 4K Surgical Camera Head Market, U.S., 2021 – 2031 |
| Figure 13‑10: 4K Camera Control Unit Market, U.S., 2021 – 2031 |
| Figure 13‑11: 3D Camera System Market by Segment, U.S., 2021 – 2031 (US$M) |
| Figure 13‑12: 3D Camera System Market, U.S., 2021 – 2031 |
| Figure 13‑13: 3D Surgical Camera Head Market, U.S., 2021 – 2031 |
| Figure 13‑14: 3D Camera Control Unit Market, U.S., 2021 – 2031 |
| Figure 13‑15: Total Surgical Camera System Market by Setting, U.S., 2021 – 2031 (US$M) |
| Figure 13‑16: Hospital Camera System Market by Segment, U.S., 2021 – 2031 (US$M) |
| Figure 13‑17: Total Hospital Camera System Market, U.S., 2021 – 2031 |
| Figure 13‑18: Hospital HD Camera System Market, U.S., 2021 – 2031 |
| Figure 13‑19: Hospital 4K Camera System Market, U.S., 2021 – 2031 |
| Figure 13‑20: Hospital 3D Camera System Market, U.S., 2021 – 2031 |
| Figure 13‑21: ASC Camera System Market by Segment, U.S., 2021 – 2031 (US$M) |
| Figure 13‑22: Total ASC Camera System Market, U.S., 2021 – 2031 |
| Figure 13‑23: ASC HD Camera System Market, U.S., 2021 – 2031 |
| Figure 13‑24: ASC 4K Camera System Market, U.S., 2021 – 2031 |
| Figure 13‑25: ASC 3D Camera System Market, U.S., 2021 – 2031 |
| Figure 13‑26: Leading Competitors, Surgical Camera System Market, U.S., 2024 |
| Figure 14‑1: Image Management Market by Segment, U.S., 2021 – 2031 (US$M) |
| Figure 14‑2: Image Management Market, U.S., 2021 – 2031 |
| Figure 14‑3: Hospital OR Image Management Market, U.S., 2021 – 2031 |
| Figure 14‑4: ASC OR Image Management Market, U.S., 2021 – 2031 |
| Figure 14‑5: Leading Competitors, Image Management Market, U.S., 2024 |
| Figure 15‑1: Surgical Light Source Market by Segment, U.S., 2021 – 2031 (US$M) |
| Figure 15‑2: Surgical Light Source Market, U.S., 2021 – 2031 |
| Figure 15‑3: Hospital OR Surgical Light Sources Market, U.S., 2021 – 2031 |
| Figure 15‑4: ASC OR Surgical Light Sources Market, U.S., 2021 – 2031 |
| Figure 15‑5: Leading Competitors, Surgical Light Source Market, U.S., 2024 |
| Figure 16‑1: Combination Console Market by Segment, U.S., 2021 – 2031 (US$M) |
| Figure 16‑2: Combination Console Market, U.S., 2021 – 2031 |
| Figure 16‑3: 4K Combination Console Market, U.S., 2021 – 2031 |
| Figure 16‑4: HD Combination Console Market, U.S., 2021 – 2031 |
| Figure 16‑5: Leading Competitors, Combination Console Market, U.S., 2024 |