| Figure 1‑1: Peripheral Vascular Device Market Share Ranking by Segment, Global, 2023 (1 of 4) |
| Figure 1‑2: Peripheral Vascular Device Market Share Ranking by Segment, Global, 2023 (2 of 4) |
| Figure 1‑3: Peripheral Vascular Device Market Share Ranking by Segment, Global, 2023 (3 of 4) |
| Figure 1‑4: Peripheral Vascular Device Market Share Ranking by Segment, Global, 2023 (4 of 4) |
| Figure 1‑5: Companies Researched in This Report |
| Figure 1‑6: Factors Impacting the Peripheral Vascular Device Market by Segment, Global (1 of 4) |
| Figure 1‑7: Factors Impacting the Peripheral Vascular Device Market by Segment, Global (2 of 4) |
| Figure 1‑8: Factors Impacting the Peripheral Vascular Device Market by Segment, Global (3 of 4) |
| Figure 1‑9: Factors Impacting the Peripheral Vascular Device Market by Segment, Global (4 of 4) |
| Figure 1‑10: Recent Events in the Peripheral Vascular Device Market, Global, 2019 – 2023 |
| Figure 1‑11: Peripheral Vascular Procedures Covered (1 of 2) |
| Figure 1‑12: Peripheral Vascular Procedures Covered (2 of 2) |
| Figure 1‑13: Peripheral Vascular Device Markets Covered (1 of 3) |
| Figure 1‑14: Peripheral Vascular Device Markets Covered (2 of 3) |
| Figure 1‑15: Peripheral Vascular Device Markets Covered (3 of 3) |
| Figure 1‑16: Peripheral Vascular Regions Covered, Global (1 of 2) |
| Figure 1‑17: Peripheral Vascular Regions Covered, Global (2 of 2) |
| Figure 1‑18: Version History |
| Figure 2‑1: Peripheral Vascular Device Market by Segment, Worst Case Scenario, Global, 2020 – 2030 (US$M) (1 of 3) |
| Figure 2‑2: Peripheral Vascular Device Market by Segment, Worst Case Scenario, Global, 2020 – 2030 (US$M) (2 of 3) |
| Figure 2‑3: Peripheral Vascular Device Market by Segment, Worst Case Scenario, Global, 2020 – 2030 (US$M) (3 of 3) |
| Figure 2‑4: Peripheral Vascular Device Market by Segment, Base Case Scenario, Global, 2020 – 2030 (US$M) (1 of 3) |
| Figure 2‑5: Peripheral Vascular Device Market by Segment, Base Case Scenario, Global, 2020 – 2030 (US$M) (2 of 3) |
| Figure 2‑6: Peripheral Vascular Device Market by Segment, Base Case Scenario, Global, 2020 – 2030 (US$M) (3 of 3) |
| Figure 2‑7: Peripheral Vascular Device Market by Segment, Best Case Scenario, Global, 2020 – 2030 (US$M) (1 of 3) |
| Figure 2‑8: Peripheral Vascular Device Market by Segment, Best Case Scenario, Global, 2020 – 2030 (US$M) (2 of 3) |
| Figure 2‑9: Peripheral Vascular Device Market by Segment, Best Case Scenario, Global, 2020 – 2030 (US$M) (3 of 3) |
| Figure 4‑1: Peripheral Vascular Stent by Company (1 of 2) |
| Figure 4‑2: Peripheral Vascular Stent by Company (2 of 2) |
| Figure 4‑3: PTA Balloon Catheter by Company (1 of 3) |
| Figure 4‑4: PTA Balloon Catheter by Company (2 of 3) |
| Figure 4‑5: PTA Balloon Catheter by Company (3 of 3) |
| Figure 4‑6: Drug-Coated Balloon by Company |
| Figure 4‑7: Atherectomy Device by Company (1 of 2) |
| Figure 4‑8: Atherectomy Device by Company (2 of 2) |
| Figure 4‑9: Lithotripsy Device by Company |
| Figure 4‑10: Chronic Total Occlusion Device by Company |
| Figure 4‑11: Surgical Graft by Company (1 of 2) |
| Figure 4‑12: Surgical Graft by Company (2 of 2) |
| Figure 4‑13: Stent Graft by Company |
| Figure 4‑14: Embolic Protection Device by Company |
| Figure 4‑15: Peripheral Thrombus Management by Company |
| Figure 4‑16: Inferior Vena Cava Filter & Retrieval Device by Company (1 of 2) |
| Figure 4‑17: Inferior Vena Cava Filter & Retrieval Device by Company (2 of 2) |
| Figure 4‑18: Carotid Shunt by Company |
| Figure 4‑19: Diagnostic and Interventional Catheters by Company (1 of 2) |
| Figure 4‑20: Diagnostic and Interventional Catheters by Company (2 of 2) |
| Figure 4‑21: Diagnostic and Interventional Guidewire by Company (1 of 3) |
| Figure 4‑22: Diagnostic and Interventional Guidewire by Company (2 of 3) |
| Figure 4‑23: Diagnostic and Interventional Guidewire by Company (3 of 3) |
| Figure 4‑24: Introducer Sheath by Company (1 of 2) |
| Figure 4‑25: Introducer Sheath by Company (2 of 2) |
| Figure 4‑26: Vascular Closure Device by Company |
| Figure 4‑27: Transcatheter Embolization Devices by Company (1 of 2) |
| Figure 4‑28: Transcatheter Embolization Devices by Company (2 of 2) |
| Figure 4‑29: Peripheral IVUS Catheter by Company |
| Figure 4‑30: Class 2 Device Recall VENOVO Venous Stent System |
| Figure 4‑31: Class 1 Device Recall VICI VENOUS STENT System |
| Figure 4‑32: Class 2 Device Recall ELUVIA |
| Figure 4‑33: Class 2 Device Recall PALMAZ GENESIS |
| Figure 4‑34: Class 2 Device Recall S.M.A.R.T. Flex |
| Figure 4‑35: Class 1 Device Recall PRECISE PRO RX CAROTID STENT Implant System |
| Figure 4‑36: Class 2 Device Recall Cordis S.M.A.R.T. CONTROL /S.M.A.R.T. Vascular Stent System |
| Figure 4‑37: Class 2 Device Recall S.M.A.R.T. Nitinol Stent System and the S.M.A.R.T. Control Nitinol Stent System |
| Figure 4‑38: Class 2 Device Recall Cordis Precise Nitinol Stent System |
| Figure 4‑39: Class 2 Device Recall Formula 418 Renal BalloonExpandable Stent |
| Figure 4‑40: Class 2 Device Recall Zilver 635 Biliary Stent |
| Figure 4‑41: Class 2 Device Recall Zilver 518 Biliary Stent |
| Figure 4‑42: Class 1 Device Recall Atrium |
| Figure 4‑43: Class 2 Device Recall Everflex Selfexpanding Peripheral Stent |
| Figure 4‑44: Class 2 Device Recall Medtronic Abre |
| Figure 4‑45: Class 2 Device Recall Medtronic Abre Venous Selfexpanding Sent System |
| Figure 4‑46: Class 2 Device Recall ENROUTE Transcarotid Stent System |
| Figure 4‑47: Class 2 Device Recall GORE VIABAHN VBX, BALLOON EXPANDABLE ENDOPROSTHESIS |
| Figure 4‑48: Class 2 Device Recall Conquest PTA Balloon Dilatation Catheter |
| Figure 4‑49: Class 2 Device Recall Conquest 40 PTA Dilatation Catheter |
| Figure 4‑50: Class 2 Device Recall Cordis SABER PTA Balloon Dilation Catheter |
| Figure 4‑51: Class 2 Device Recall Cordis POWERFLEX P3, PTA Dilation Catheter |
| Figure 4‑52: Class 2 Device Recall Cordis MAXI LD PTA Dilatation Catheter |
| Figure 4‑53: Class 2 Device Recall POWERFLEX PRO Percutaneous Transluminal Angioplasty (PTA) Catheter |
| Figure 4‑54: Class 1 Device Recall ADVANCE ENFORCER 35 FOCAL FORCE PTA BALLOON CATHETER |
| Figure 4‑55: Class 2 Device Recall Medtronic IN.PACT Admiral, Paclitaxelcoated PTA Balloon Catheter |
| Figure 4‑56: Class 2 Device Recall Chameleon PTA Balloon Dilation Catheter |
| Figure 4‑57: Class 2 Device Recall Boston Scientific ROTAPRO |
| Figure 4‑58: Class 2 Device Recall STEALTH 360 GEN2 PERIPHERAL ORBITAL ATHERECTOMY SYSTEM |
| Figure 4‑59: Class 2 Device Recall DIAMONDBACK 360 GEN2 PERIPHERAL ORBITAL ATHERECTOMY SYSTEM |
| Figure 4‑60: Class 1 Device Recall TurboHawk Plus |
| Figure 4‑61: Class 1 Device Recall HawkOne |
| Figure 4‑62: Class 2 Device Recall Shockwave Medical Peripheral Intravascular Lithotripsy (IVL) System |
| Figure 4‑63: Class 1 Device Recall IntraClude IntraAortic Occlusion Device |
| Figure 4‑64: Class 2 Device Recall Intergard Woven Vascular Graft |
| Figure 4‑65: Class 2 Device Recall Interavascular SAS/Getinge |
| Figure 4‑66: Class 2 Device Recall Hemashield Gold Knitted Bifurcated |
| Figure 4‑67: Class 2 Device Recall Atrium ADVANTA VXT Vascular Graft |
| Figure 4‑68: Class 2 Device Recall HEMASHIELD MICROVEL Double Velour Knitted Vascular Grafts |
| Figure 4‑69: Class 2 Device Recall HEMASHIELD PLATINUM WOVEN/MICROVEL DOUBLE VELOUR VASCULAR GRAFTS |
| Figure 4‑70: Class 2 Device Recall HEMASHIELD PLATINUM Woven Double Velour Vascular Graft |
| Figure 4‑71: Class 2 Device Recall VASCUTEK/TERUMO |
| Figure 4‑72: Class 2 Device Recall Gore Propaten Vascular Graft |
| Figure 4‑73: Class 1 Device Recall ENDOLOGIX AFX2 Bifurcated Endograft System |
| Figure 4‑74: Class 1 Device Recall ENDOLOGIX AFX/AFX2, Proximal (Aortic) Extension Endograft |
| Figure 4‑75: Class 1 Device Recall ENDOLOGIX AFX Endovascular AAA System |
| Figure 4‑76: Class 1 Device Recall ENDOLOGIX AFX/AFX2, Limb (Iliac) Extension Endograft |
| Figure 4‑77: Class 2 Device Recall Zenith Alpha Abdominal Endovascular Graft |
| Figure 4‑78: Class 2 Device Recall Zenith Alpha Abdominal Endovascular Graft |
| Figure 4‑79: Class 2 Device Recall Zenith Alpha SpiralZ Endovascular Leg |
| Figure 4‑80: Class 2 Device Recall Zenith Alpha Abdominal Endovascular Graft |
| Figure 4‑81: Class 2 Device Recall Endurant, Endurant II and Endurant IIs Stent Graft Systems |
| Figure 4‑82: Class 2 Device Recall Endurant Stent Graft System |
| Figure 4‑83: Class 2 Device Recall Endurant II Stent Graft System |
| Figure 4‑84: Class 2 Device Recall Endurant II/IIs Stent Graft System |
| Figure 4‑85: Class 2 Device Recall Endurant II/IIs Stent Graft System |
| Figure 4‑86: Class 1 Device Recall Valiant Navion Thoracic Stent Graft System |
| Figure 4‑87: Device Recall AngioJet Ultra 5000 A Console, Boston Scientific |
| Figure 4‑88: Class 2 Device Recall EKOS |
| Figure 4‑89: Class 2 Device Recall EkoSonic Endovascular Device |
| Figure 4‑90: Class 2 Device Recall EKOS Control System |
| Figure 4‑91: Class 2 Device Recall AngioJet Ultra Consoles Thrombectomy System |
| Figure 4‑92: Class 1 Device Recall ArrowTrerotola PTD |
| Figure 4‑93: Class 1 Device Recall ArrowTrerotola Percutaneous Thrombolytic Device |
| Figure 4‑94: Class 1 Device Recall ArrowTrerotola OverTheWire PTD Kit Percutaneous Thrombolytic Device: 7FR |
| Figure 4‑95: Class 3 Device Recall Cook |
| Figure 4‑96: Class 3 Device Recall Cook Celect Platinum Vena Cava Filter Set |
| Figure 4‑97: Class 2 Device Recall SoftVu Omni Flush Angiographic Catheter |
| Figure 4‑98: Class 2 Device Recall SEEKER(R) Crossing Support Catheter |
| Figure 4‑99: Class 1 Device Recall Imager II 5F Angiographic Catheter |
| Figure 4‑100: Class 1 Device Recall SUPER TORQUE MB 5F PIG |
| Figure 4‑101: Class 1 Device Recall CrossCath Support Catheter |
| Figure 4‑102: Class 2 Device Recall Torcon NB Advantage |
| Figure 4‑103: Class 2 Device Recall Amplatz extra Stiff Wire Guide |
| Figure 4‑104: Class 2 Device Recall Bentson Wire Guide |
| Figure 4‑105: Class 2 Device Recall Cope Mandril Wire Guide |
| Figure 4‑106: Class 2 Device Recall Cope Mandril Wire Guide (Nitinol) |
| Figure 4‑107: Class 2 Device Recall Coons Interventional Wire Guide |
| Figure 4‑108: Class 2 Device Recall Lunderquist Ring Torque Wire Guide |
| Figure 4‑109: Class 2 Device Recall Newton Wire Guide |
| Figure 4‑110: Class 2 Device Recall Roadrunner PC Hydrophilic Wire Guide |
| Figure 4‑111: Class 2 Device Recall Roadrunner PC Wire Guide (Nimble Floppy) |
| Figure 4‑112: Class 2 Device Recall Roadrunner PC Wire Guide (The Firm) |
| Figure 4‑113: Class 2 Device Recall Cook Roadrunner UniGlide Hydrophilic Wire Guide |
| Figure 4‑114: Class 2 Device Recall Cook Roadrunner PC Wire Guide |
| Figure 4‑115: Class 2 Device Recall Roadrunner Hydrophilic PC Wire Guide |
| Figure 4‑116: Class 2 Device Recall Zurpaz(TM) MEDIUM CURL, ASYMMETRIC CURVE, Steerable Sheath |
| Figure 4‑117: Class 2 Device Recall Ultimum HEMOSTASIS INTRODUCER |
| Figure 4‑118: Class 2 Device Recall FastCath Trio HEMOSTASIS INTRODUCER |
| Figure 4‑119: Class 2 Device Recall FastCath Hemostasis Introducer, HEMOSTASIS INTRODUCER |
| Figure 4‑120: Class 2 Device Recall Avanti Catheter Sheath Introducer |
| Figure 4‑121: Class 2 Device Recall |
| Figure 4‑122: Class 2 Device Recall Flexor CheckFlo Introducer |
| Figure 4‑123: Class 1 Device Recall Flexor CheckFlo Introducer |
| Figure 4‑124: Class 2 Device Recall Hilal Embolization Microcoil |
| Figure 4‑125: Class 2 Device Recall Nester Embolization Microcoil |
| Figure 4‑126: Class 2 Device Recall Tornado Embolization Microcoil |
| Figure 4‑127: Class 2 Device Recall Terumo AZUR Peripheral Coil System, Detachable 18 |
| Figure 4‑128: Class 2 Device Recall Terumo AZUR CX Peripheral Coil System, Detachable 35, CX Coil |
| Figure 4‑129: Class 2 Device Recall Terumo AZUR CX Peripheral Coil System, Detachable 18, CX Coil |
| Figure 4‑130: Class 2 Device Recall OptiCross 35 15 MHz Peripheral Imaging Catheter |
| Figure 4‑131: Peripheral Venous Stent System in the Treatment of Iliac Vein Stenosis or Occlusion |
| Figure 4‑132: Belgian Trial Investigating the LifeStream Stent in Complex TASC C and D Iliac Lesions (BELSTREAM) |
| Figure 4‑133: Paclitaxel-Coated Peripheral Stents Used in the Treatment of Femoropopliteal Stenoses (XPEDITE) |
| Figure 4‑134: An All-Comers Observational Study of the MicroStent™ Peripheral Vascular Stent System in Subjects with Peripheral Arterial Disease (HEAL) |
| Figure 4‑135: SOLARIS Peripheral PMCF Trial |
| Figure 4‑136: A Superiority Trial of the SUPERA Peripheral Stent System in Patients with Femoro-popliteal Artery Disease |
| Figure 4‑137: Evaluation of Safety and Efficacy of the S.M.A.R.T. RADIANZ™ Vascular Stent System in the Treatment of Iliac and Femoropopliteal Lesions Via Transradial Access (RADIANCY) |
| Figure 4‑138: Stella Supera Siberia |
| Figure 4‑139: A Real World Evaluation of the ELUVIA Stent in Subjects with Lesions Located in the Femoropopliteal Arteries (REGAL) |
| Figure 4‑140: Zilver® PTX® V Clinical Study |
| Figure 4‑141: In-Stent Restenosis Post-Approval Study |
| Figure 4‑142: BARD® The VENOVO™ Venous Stent Study for Treatment of Iliofemoral Occlusive Disease (VERNACULAR) |
| Figure 4‑143: VIVO Clinical Study |
| Figure 4‑144: ULTRASCORE™ Focused Force PTA Balloon Angioplasty for CLI Patients with Below the Knee Vessel Disease |
| Figure 4‑145: Real World Registry Assessing the Clinical Use of the Bard UltraScore Forced Focus PTA Balloon |
| Figure 4‑146: Ranger™ and Ranger™ SL (OTW) DCB in China |
| Figure 4‑147: The VaSecure BTK Study |
| Figure 4‑148: Comparison of the Ranger™ Paclitaxel-Coated PTA Balloon Catheter and Uncoated PTA Balloons in Femoropopliteal Arteries (RANGER-SFA) |
| Figure 4‑149: A Trial to Evaluate the Safety and Efficacy of the Passeo-18 Lux Drug-coated Balloon of Biotronik in the Treatment of the Femoropopliteal Artery Compared to the Medtronic IN.PACT Admiral Drug-coated Balloon. (BIOPACT-RCT) |
| Figure 4‑150: Safety and Efficacy of the SurVeil™ Drug-Coated Balloon (TRANSCEND) |
| Figure 4‑151: RANGER™ Paclitaxel Coated Balloon vs Standard Balloon Angioplasty (RANGER II SFA) |
| Figure 4‑152: IN.PACT BTK Randomized Study to Assess Safety and Efficacy of IN.PACT 014 vs. PTA |
| Figure 4‑153: Compare I Pilot Study for the Treatment of Subjects with Symptomatic Femoropopliteal Artery Disease |
| Figure 4‑154: ILLUMENATE Below-The-Knee (BTK) Arteries: a Post Market Clinical Study (BTK PMS) |
| Figure 4‑155: IN.PACT Global Clinical Study |
| Figure 4‑156: ILLUMENATE Pivotal Post-Approval Study (PAS) |
| Figure 4‑157: BIOLUX P-III BENELUX All-Comers Registry |
| Figure 4‑158: Real-World Registry Assessing the Clinical Use of the Lutonix 035 Drug Coated Balloon Catheter (SAFE-DCB) |
| Figure 4‑159: Safety and Effectiveness Evaluation of Peripheral Orbital Atherectomy (KAIZEN) |
| Figure 4‑160: Jetstream in Treatment of Occlusive Atherosclerotic Lesions in the SFA and/or PPA |
| Figure 4‑161: Revascularization of Total or Sub-total Occluded Peripheral Arteries with ByCross® Device. Post Market Clinical Follow-up |
| Figure 4‑162: Post-Market Registry of AURYON™ Atherectomy Device in Subjects Affected with Infrainguinal Peripheral Artery Disease (PATHFINDER-I) |
| Figure 4‑163: JET-RANGER Trial - JETStream Atherectomy With Adjunctive Paclitaxel-Coated Balloon Angioplasty vs Plain Old Balloon Angioplasty Followed by Paclitaxel-Coated Balloon |
| Figure 4‑164: Pantheris Atherectomy Treatment of In-Stent Restenosis in Lower Extremity Arteries (INSIGHT) |
| Figure 4‑165: Safety and Effectiveness Study of Eximo's B-Laser™ Atherectomy Device for PAD Treatment |
| Figure 4‑166: Safety and Effectiveness of Jetstream Atherectomy System (J-SUPREME II) |
| Figure 4‑167: DiRectional AthErectomy + Drug CoAted BaLloon to Treat Long, CalcifIed FemoropopliTeal ArterY Lesions (REALITY) |
| Figure 4‑168: Mini S Feasibility Study with Shockwave Medical Mini S Peripheral IVL System |
| Figure 4‑169: SOLUTION Trial in China |
| Figure 4‑170: Disrupt PAD+ Study with the Shockwave Medical M5+ Peripheral IVL System (Disrupt PAD+) |
| Figure 4‑171: Shockwave Medical Peripheral Lithoplasty System Study for PAD (Disrupt PAD III) |
| Figure 4‑172: A Prospective and Retrospective, Multi-Centre, Post-Market, Non-Interventional Study of Terumo Aortic Knitted and Woven Grafts, and Cardiovascular Patches (PANTHER) |
| Figure 4‑173: Retrospective Post-Market Clinical Follow-Up Study of GORE-TEX® Vascular Grafts and GORE® PROPATEN® Vascular Graft in Peripheral Artery Disease, Aortic Aneurysms, and Dialysis Access |
| Figure 4‑174: Ankura™ TAA Stent Graft System Post-Market Clinical Follow-up Study |
| Figure 4‑175: Post-Approval Study of the TREO Abdominal Stent-Graft System (TREO PAS) |
| Figure 4‑176: The Merit WRAPSODY™ Endovascular Stent Graft for Treatment of Iliac Artery Occlusive Disease |
| Figure 4‑177: Zenith Alpha™ Abdominal Endovascular Graft |
| Figure 4‑178: Fenestrated AAA Endovascular Graft Post-Approval Study |
| Figure 4‑179: transShield Embolic Protection System Feasibility Study |
| Figure 4‑180: Study of the Long-Term Safety and Outcomes of Treating Pulmonary Embolism with the Indigo Aspiration System |
| Figure 4‑181: Preservation of Venous Valvular Function After PMT for Acute DVT (PREFER) |
| Figure 4‑182: A Study of Patients with Lower Extremity Acute Limb Ischemia to Remove Thrombus with the Indigo Aspiration System (STRIDE) |
| Figure 4‑183: FlowTriever All-Comer Registry for Patient Safety and Hemodynamics (FLASH) |
| Figure 4‑184: JETi Peripheral Thrombectomy Registry (JETi) |
| Figure 4‑185: Treatment of Low-Risk Submassive Pulmonary Embolism with FlowTriever |
| Figure 4‑186: Forceps vs. Snare IVC Filter Removal |
| Figure 4‑187: Predictors of Attempted Inferior Vena Cava Filters Retrieval |
| Figure 4‑188: Retrievability and Incidence of Complex Retrieval in Celect Versus Denali Filter |
| Figure 4‑189: Cook IVC Filter Study (CIVC) |
| Figure 4‑190: Predicting the Safety and Effectiveness of Inferior Vena Cava Filters (PRESERVE) |
| Figure 4‑191: Evaluation of Safety and Efficacy of the Mynx Control Venous Vascular Closure Device 6F-12F vs Manual Compression (ReliaSeal) |
| Figure 4‑192: AbsorbaSeal (ABS 5.6.7) Vascular Closure Device Trial |
| Figure 4‑193: Vascular Closure Device in Transcatheter Aortic Valve Replacement |
| Figure 4‑194: Manta™ Versus Suture-based Closure After Transcatheter Aortic Valve Implantation Trial (MASH-TAVI) |
| Figure 4‑195: Study to Evaluate the Safety and Effectiveness of MynxGrip Vascular Closure Device (PANDA) |
| Figure 4‑196: (HALT) Embrace Hydrogel Embolic System (HES) Study of Embolization in Peripheral Arterial Bleeds |
| Figure 4‑197: Microvascular Plug (MVP) for the Treatment of Pulmonary ArterioVenous Malformations (PAVMs) |
| Figure 4‑198: Use of Interlocking Detachable Coils System in Embolization of Peripheral Arterial Embolization |
| Figure 4‑199: CATERPILLAR™ Arterial Embolization Device Study (CHRYSALIS) |
| Figure 4‑200: LC Bead LUMI for Prostatic Artery Embolization |
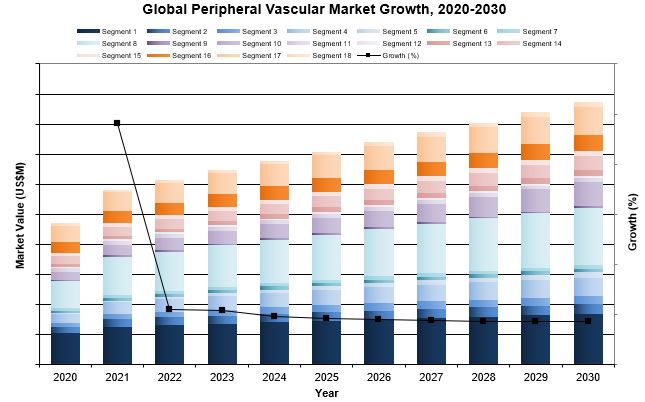
| Figure 5‑1: Peripheral Vascular Device Market by Segment, Global, 2020 – 2030 (US$M) (1 of 3) |
| Figure 5‑2: Peripheral Vascular Device Market by Segment, Global, 2020 – 2030 (US$M) (2 of 3) |
| Figure 5‑3: Peripheral Vascular Device Market by Segment, Global, 2020 – 2030 (US$M) (3 of 3) |
| Figure 5‑4: Peripheral Vascular Device Market by Region, Global, 2020 – 2030 (US$M) |
| Figure 5‑5: Leading Competitors, Peripheral Vascular Device Market by Segment, Global, 2023 (1 of 4) |
| Figure 5‑6: Leading Competitors, Peripheral Vascular Device Market by Segment, Global, 2023 (2 of 4) |
| Figure 5‑7: Leading Competitors, Peripheral Vascular Device Market by Segment, Global, 2023 (3 of 4) |
| Figure 5‑8: Leading Competitors, Peripheral Vascular Device Market by Segment, Global, 2023 (4 of 4) |
| Figure 5‑9: SWOT Analysis, Abbott (1 of 2) |
| Figure 5‑10: SWOT Analysis, Abbott (2 of 2) |
| Figure 5‑11: SWOT Analysis, Becton Dickinson (1 of 2) |
| Figure 5‑12: SWOT Analysis, Becton Dickinson (2 of 2) |
| Figure 5‑13: SWOT Analysis, Boston Scientific |
| Figure 5‑14: SWOT Analysis, Cardinal Health |
| Figure 5‑15: SWOT Analysis, Cardiovascular Systems, Inc. |
| Figure 5‑16: SWOT Analysis, Cook Medical |
| Figure 5‑17: SWOT Analysis, Medtronic |
| Figure 5‑18: SWOT Analysis, Penumbra |
| Figure 5‑19: SWOT Analysis, Philips |
| Figure 5‑20: SWOT Analysis, Shockwave Medical |
| Figure 5‑21: SWOT Analysis, Silk Road Medical |
| Figure 5‑22: SWOT Analysis, Terumo (1 of 2) |
| Figure 5‑23: SWOT Analysis, Terumo (2 of 2) |
| Figure 5‑24: SWOT Analysis, W.L. Gore |
| Figure 6‑1: Peripheral Vascular Stent Procedures Covered |
| Figure 6‑2: Peripheral Vascular Stent Markets Covered |
| Figure 6‑3: Peripheral Vascular Stent Regions Covered, Global (1 of 2) |
| Figure 6‑4: Peripheral Vascular Stent Regions Covered, Global (2 of 2) |
| Figure 6‑5: Peripheral Vascular Stenting Procedures by Segment, Global, 2020 – 2030 |
| Figure 6‑6: Peripheral Vascular Stenting Procedures by Region, Global, 2020 – 2030 |
| Figure 6‑7: Peripheral Vascular Stenting Procedures by Country, North America, 2020 – 2030 |
| Figure 6‑8: Peripheral Vascular Stenting Procedures by Country, Latin America, 2020 – 2030 (1 of 2) |
| Figure 6‑9: Peripheral Vascular Stenting Procedures by Country, Latin America, 2020 – 2030 (2 of 2) |
| Figure 6‑10: Peripheral Vascular Stenting Procedures by Country, Western Europe, 2020 – 2030 |
| Figure 6‑11: Peripheral Vascular Stenting Procedures by Country, Central & Eastern Europe, 2020 – 2030 (1 of 2) |
| Figure 6‑12: Peripheral Vascular Stenting Procedures by Country, Central & Eastern Europe, 2020 – 2030 (2 of 2) |
| Figure 6‑13: Peripheral Vascular Stenting Procedures by Country, Middle East, 2020 – 2030 |
| Figure 6‑14: Peripheral Vascular Stenting Procedures by Country, Asia-Pacific, 2020 – 2030 (1 of 3) |
| Figure 6‑15: Peripheral Vascular Stenting Procedures by Country, Asia-Pacific, 2020 – 2030 (2 of 3) |
| Figure 6‑16: Peripheral Vascular Stenting Procedures by Country, Asia-Pacific, 2020 – 2030 (3 of 3) |
| Figure 6‑17: Peripheral Vascular Stenting Procedures by Country, Africa, 2020 – 2030 |
| Figure 6‑18: Arterial Stent Procedures by Segment, Global, 2020 – 2030 |
| Figure 6‑19: Arterial Stent Procedures by Region, Global, 2020 – 2030 |
| Figure 6‑20: Arterial Stent Procedures by Country, North America, 2020 – 2030 |
| Figure 6‑21: Arterial Stent Procedures by Country, Latin America, 2020 – 2030 (1 of 2) |
| Figure 6‑22: Arterial Stent Procedures by Country, Latin America, 2020 – 2030 (2 of 2) |
| Figure 6‑23: Arterial Stent Procedures by Country, Western Europe, 2020 – 2030 |
| Figure 6‑24: Arterial Stent Procedures by Country, Central & Eastern Europe, 2020 – 2030 (1 of 2) |
| Figure 6‑25: Arterial Stent Procedures by Country, Central & Eastern Europe, 2020 – 2030 (2 of 2) |
| Figure 6‑26: Arterial Stent Procedures by Country, Middle East, 2020 – 2030 |
| Figure 6‑27: Arterial Stent Procedures by Country, Asia-Pacific, 2020 – 2030 (1 of 3) |
| Figure 6‑28: Arterial Stent Procedures by Country, Asia-Pacific, 2020 – 2030 (2 of 3) |
| Figure 6‑29: Arterial Stent Procedures by Country, Asia-Pacific, 2020 – 2030 (3 of 3) |
| Figure 6‑30: Arterial Stent Procedures by Country, Africa, 2020 – 2030 |
| Figure 6‑31: Bare-Metal Stent Procedures by Region, Global, 2020 – 2030 |
| Figure 6‑32: Bare-Metal Stent Procedures by Country, North America, 2020 – 2030 |
| Figure 6‑33: Bare-Metal Stent Procedures by Country, Latin America, 2020 – 2030 (1 of 2) |
| Figure 6‑34: Bare-Metal Stent Procedures by Country, Latin America, 2020 – 2030 (2 of 2) |
| Figure 6‑35: Bare-Metal Stent Procedures by Country, Western Europe, 2020 – 2030 |
| Figure 6‑36: Bare-Metal Stent Procedures by Country, Central & Eastern Europe, 2020 – 2030 (1 of 2) |
| Figure 6‑37: Bare-Metal Stent Procedures by Country, Central & Eastern Europe, 2020 – 2030 (2 of 2) |
| Figure 6‑38: Bare-Metal Stent Procedures by Country, Middle East, 2020 – 2030 |
| Figure 6‑39: Bare-Metal Stent Procedures by Country, Asia-Pacific, 2020 – 2030 (1 of 3) |
| Figure 6‑40: Bare-Metal Stent Procedures by Country, Asia-Pacific, 2020 – 2030 (2 of 3) |
| Figure 6‑41: Bare-Metal Stent Procedures by Country, Asia-Pacific, 2020 – 2030 (3 of 3) |
| Figure 6‑42: Bare-Metal Stent Procedures by Country, Africa, 2020 – 2030 |
| Figure 6‑43: Covered Stent Procedures by Region, Global, 2020 – 2030 |
| Figure 6‑44: Covered Stent Procedures by Country, North America, 2020 – 2030 |
| Figure 6‑45: Covered Stent Procedures by Country, Latin America, 2020 – 2030 (1 of 2) |
| Figure 6‑46: Covered Stent Procedures by Country, Latin America, 2020 – 2030 (2 of 2) |
| Figure 6‑47: Covered Stent Procedures by Country, Western Europe, 2020 – 2030 |
| Figure 6‑48: Covered Stent Procedures by Country, Central & Eastern Europe, 2020 – 2030 (1 of 2) |
| Figure 6‑49: Covered Stent Procedures by Country, Central & Eastern Europe, 2020 – 2030 (2 of 2) |
| Figure 6‑50: Covered Stent Procedures by Country, Middle East, 2020 – 2030 |
| Figure 6‑51: Covered Stent Procedures by Country, Asia-Pacific, 2020 – 2030 (1 of 3) |
| Figure 6‑52: Covered Stent Procedures by Country, Asia-Pacific, 2020 – 2030 (2 of 3) |
| Figure 6‑53: Covered Stent Procedures by Country, Asia-Pacific, 2020 – 2030 (3 of 3) |
| Figure 6‑54: Covered Stent Procedures by Country, Africa, 2020 – 2030 |
| Figure 6‑55: Drug-Eluting Stent Procedures by Region, Global, 2020 – 2030 |
| Figure 6‑56: Drug-Eluting Stent Procedures by Country, North America, 2020 – 2030 |
| Figure 6‑57: Drug-Eluting Stent Procedures by Country, Latin America, 2020 – 2030 (1 of 2) |
| Figure 6‑58: Drug-Eluting Stent Procedures by Country, Latin America, 2020 – 2030 (2 of 2) |
| Figure 6‑59: Drug-Eluting Stent Procedures by Country, Western Europe, 2020 – 2030 |
| Figure 6‑60: Drug-Eluting Stent Procedures by Country, Central & Eastern Europe, 2020 – 2030 (1 of 2) |
| Figure 6‑61: Drug-Eluting Stent Procedures by Country, Central & Eastern Europe, 2020 – 2030 (2 of 2) |
| Figure 6‑62: Drug-Eluting Stent Procedures by Country, Middle East, 2020 – 2030 |
| Figure 6‑63: Drug-Eluting Stent Procedures by Country, Asia-Pacific, 2020 – 2030 (1 of 3) |
| Figure 6‑64: Drug-Eluting Stent Procedures by Country, Asia-Pacific, 2020 – 2030 (2 of 3) |
| Figure 6‑65: Drug-Eluting Stent Procedures by Country, Asia-Pacific, 2020 – 2030 (3 of 3) |
| Figure 6‑66: Drug-Eluting Stent Procedures by Country, Africa, 2020 – 2030 |
| Figure 6‑67: Venous Stent Procedures by Region, Global, 2020 – 2030 |
| Figure 6‑68: Venous Stent Procedures by Country, North America, 2020 – 2030 |
| Figure 6‑69: Venous Stent Procedures by Country, Latin America, 2020 – 2030 (1 of 2) |
| Figure 6‑70: Venous Stent Procedures by Country, Latin America, 2020 – 2030 (2 of 2) |
| Figure 6‑71: Venous Stent Procedures by Country, Western Europe, 2020 – 2030 |
| Figure 6‑72: Venous Stent Procedures by Country, Central & Eastern Europe, 2020 – 2030 (1 of 2) |
| Figure 6‑73: Venous Stent Procedures by Country, Central & Eastern Europe, 2020 – 2030 (2 of 2) |
| Figure 6‑74: Venous Stent Procedures by Country, Middle East, 2020 – 2030 |
| Figure 6‑75: Venous Stent Procedures by Country, Asia-Pacific, 2020 – 2030 (1 of 3) |
| Figure 6‑76: Venous Stent Procedures by Country, Asia-Pacific, 2020 – 2030 (2 of 3) |
| Figure 6‑77: Venous Stent Procedures by Country, Asia-Pacific, 2020 – 2030 (3 of 3) |
| Figure 6‑78: Venous Stent Procedures by Country, Africa, 2020 – 2030 |
| Figure 6‑79: Peripheral Vascular Stent Market by Segment, Global, 2020 – 2030 (US$M) |
| Figure 6‑80: Peripheral Vascular Stent Market by Region, Global, 2020 – 2030 (US$M) |
| Figure 6‑81: Arterial Stent Market by Segment, Global, 2020 – 2030 (US$M) |
| Figure 6‑82: Total Arterial Stent Market, Global, 2020 – 2030 |
| Figure 6‑83: Units Sold by Region, Arterial Stent Market, Global, 2020 – 2030 |
| Figure 6‑84: Average Selling Price by Region, Arterial Stent Market, Global, 2020 – 2030 (US$) |
| Figure 6‑85: Market Value by Region, Arterial Stent Market, Global, 2020 – 2030 (US$M) |
| Figure 6‑86: Bare-Metal Stent Market by Segment, Global, 2020 – 2030 (US$M) |
| Figure 6‑87: Total Bare-Metal Stent Market, Global, 2020 – 2030 |
| Figure 6‑88: Units Sold by Region, Bare-Metal Stent Market, Global, 2020 – 2030 |
| Figure 6‑89: Average Selling Price by Region, Bare-Metal Stent Market, Global, 2020 – 2030 (US$) |
| Figure 6‑90: Market Value by Region, Bare-Metal Stent Market, Global, 2020 – 2030 (US$M) |
| Figure 6‑91: Bare-Metal Carotid Stent Market, Global, 2020 – 2030 |
| Figure 6‑92: Units Sold by Region, Bare-Metal Carotid Stent Market, Global, 2020 – 2030 |
| Figure 6‑93: Average Selling Price by Region, Bare-Metal Carotid Stent Market, Global, 2020 – 2030 (US$) |
| Figure 6‑94: Market Value by Region, Bare-Metal Carotid Stent Market, Global, 2020 – 2030 (US$M) |
| Figure 6‑95: Bare-Metal Iliac Stent Market, Global, 2020 – 2030 |
| Figure 6‑96: Units Sold by Region, Bare-Metal Iliac Stent Market, Global, 2020 – 2030 |
| Figure 6‑97: Average Selling Price by Region, Bare-Metal Iliac Stent Market, Global, 2020 – 2030 (US$) |
| Figure 6‑98: Market Value by Region, Bare-Metal Iliac Stent Market, Global, 2020 – 2030 (US$M) |
| Figure 6‑99: Bare-Metal Renal Stent Market, Global, 2020 – 2030 |
| Figure 6‑100: Units Sold by Region, Bare-Metal Renal Stent Market, Global, 2020 – 2030 |
| Figure 6‑101: Average Selling Price by Region, Bare-Metal Renal Stent Market, Global, 2020 – 2030 (US$) |
| Figure 6‑102: Market Value by Region, Bare-Metal Renal Stent Market, Global, 2020 – 2030 (US$M) |
| Figure 6‑103: Bare-Metal Fem-Pop Stent Market, Global, 2020 – 2030 |
| Figure 6‑104: Units Sold by Region, Bare-Metal Fem-Pop Stent Market, Global, 2020 – 2030 |
| Figure 6‑105: Average Selling Price by Region, Bare-Metal Fem-Pop Stent Market, Global, 2020 – 2030 (US$) |
| Figure 6‑106: Market Value by Region, Bare-Metal Fem-Pop Stent Market, Global, 2020 – 2030 (US$M) |
| Figure 6‑107: Bare-Metal Infra-Pop Stent Market, Global, 2020 – 2030 |
| Figure 6‑108: Units Sold by Region, Bare-Metal Infra-Pop Stent Market, Global, 2020 – 2030 |
| Figure 6‑109: Average Selling Price by Region, Bare-Metal Infra-Pop Stent Market, Global, 2020 – 2030 (US$) |
| Figure 6‑110: Market Value by Region, Bare-Metal Infra-Pop Stent Market, Global, 2020 – 2030 (US$M) |
| Figure 6‑111: Covered Stent Market, Global, 2020 – 2030 |
| Figure 6‑112: Units Sold by Region, Covered Stent Market, Global, 2020 – 2030 |
| Figure 6‑113: Average Selling Price by Region, Covered Stent Market, Global, 2020 – 2030 (US$) |
| Figure 6‑114: Market Value by Region, Covered Stent Market, Global, 2020 – 2030 (US$M) |
| Figure 6‑115: Drug-Eluting Stent Market, Global, 2020 – 2030 |
| Figure 6‑116: Units Sold by Region, Drug-Eluting Stent Market, Global, 2020 – 2030 |
| Figure 6‑117: Average Selling Price by Region, Drug-Eluting Stent Market, Global, 2020 – 2030 (US$) |
| Figure 6‑118: Market Value by Region, Drug-Eluting Stent Market, Global, 2020 – 2030 (US$M) |
| Figure 6‑119: Venous Stent Market, Global, 2020 – 2030 |
| Figure 6‑120: Units Sold by Region, Venous Stent Market, Global, 2020 – 2030 |
| Figure 6‑121: Average Selling Price by Region, Venous Stent Market, Global, 2020 – 2030 (US$) |
| Figure 6‑122: Market Value by Region, Venous Stent Market, Global, 2020 – 2030 (US$M) |
| Figure 6‑123: Leading Competitors, Peripheral Vascular Stent Market, Global, 2023 |
| Figure 7‑1: PTA Balloon Procedures Covered |
| Figure 7‑2: PTA Balloon Markets Covered |
| Figure 7‑3: PTA Balloon Regions Covered, Global (1 of 2) |
| Figure 7‑4: PTA Balloon Regions Covered, Global (2 of 2) |
| Figure 7‑5: PTA Balloon Procedures by Region, Global, 2020 – 2030 |
| Figure 7‑6: PTA Balloon Procedures by Country, North America, 2020 – 2030 |
| Figure 7‑7: PTA Balloon Procedures by Country, Latin America, 2020 – 2030 (1 of 2) |
| Figure 7‑8: PTA Balloon Procedures by Country, Latin America, 2020 – 2030 (2 of 2) |
| Figure 7‑9: PTA Balloon Procedures by Country, Western Europe, 2020 – 2030 |
| Figure 7‑10: PTA Balloon Procedures by Country, Central & Eastern Europe, 2020 – 2030 (1 of 2) |
| Figure 7‑11: PTA Balloon Procedures by Country, Central & Eastern Europe, 2020 – 2030 (2 of 2) |
| Figure 7‑12: PTA Balloon Procedures by Country, Middle East, 2020 – 2030 |
| Figure 7‑13: PTA Balloon Procedures by Country, Asia-Pacific, 2020 – 2030 (1 of 3) |
| Figure 7‑14: PTA Balloon Procedures by Country, Asia-Pacific, 2020 – 2030 (2 of 3) |
| Figure 7‑15: PTA Balloon Procedures by Country, Asia-Pacific, 2020 – 2030 (3 of 3) |
| Figure 7‑16: PTA Balloon Procedures by Country, Africa, 2020 – 2030 |
| Figure 7‑17: PTA Balloon Market by Segment, Global, 2020 – 2030 (US$M) |
| Figure 7‑18: PTA Balloon Market by Region, Global, 2020 – 2030 (US$M) |
| Figure 7‑19: PTA Balloon Market, Global, 2020 – 2030 |
| Figure 7‑20: Units Sold by Region, PTA Balloon Market, Global, 2020 – 2030 |
| Figure 7‑21: Average Selling Price by Region, PTA Balloon Market, Global, 2020 – 2030 (US$) |
| Figure 7‑22: Market Value by Region, PTA Balloon Market, Global, 2020 – 2030 (US$M) |
| Figure 7‑23: Standard PTA Balloon Market, Global, 2020 – 2030 |
| Figure 7‑24: Units Sold by Region, Standard PTA Balloon Market, Global, 2020 – 2030 |
| Figure 7‑25: Average Selling Price by Region, Standard PTA Balloon Market, Global, 2020 – 2030 (US$) |
| Figure 7‑26: Market Value by Region, Standard PTA Balloon Market, Global, 2020 – 2030 (US$M) |
| Figure 7‑27: High-Pressure PTA Balloon Market, Global, 2020 – 2030 |
| Figure 7‑28: Units Sold by Region, High-Pressure PTA Balloon Market, Global, 2020 – 2030 |
| Figure 7‑29: Average Selling Price by Region, High-Pressure PTA Balloon Market, Global, 2020 – 2030 (US$) |
| Figure 7‑30: Market Value by Region, High-Pressure PTA Balloon Market, Global, 2020 – 2030 (US$M) |
| Figure 7‑31: Large PTA Balloon Market, Global, 2020 – 2030 |
| Figure 7‑32: Units Sold by Region, Large PTA Balloon Market, Global, 2020 – 2030 |
| Figure 7‑33: Average Selling Price by Region, Large PTA Balloon Market, Global, 2020 – 2030 (US$) |
| Figure 7‑34: Market Value by Region, Large PTA Balloon Market, Global, 2020 – 2030 (US$M) |
| Figure 7‑35: Small PTA Balloon Market, Global, 2020 – 2030 |
| Figure 7‑36: Units Sold by Region, Small PTA Balloon Market, Global, 2020 – 2030 |
| Figure 7‑37: Average Selling Price by Region, Small PTA Balloon Market, Global, 2020 – 2030 (US$) |
| Figure 7‑38: Market Value by Region, Small PTA Balloon Market, Global, 2020 – 2030 (US$M) |
| Figure 7‑39: Specialty PTA Balloon PTA Balloon Market, Global, 2020 – 2030 |
| Figure 7‑40: Units Sold by Region, Specialty PTA Balloon PTA Balloon Market, Global, 2020 – 2030 |
| Figure 7‑41: Average Selling Price by Region, Specialty PTA Balloon PTA Balloon Market, Global, 2020 – 2030 (US$) |
| Figure 7‑42: Market Value by Region, Specialty PTA Balloon PTA Balloon Market, Global, 2020 – 2030 (US$M) |
| Figure 7‑43: Leading Competitors, Percutaneous Transluminal Angioplasty Balloon Market, Global, 2023 |
| Figure 8‑1: Drug-Coated Balloon Procedures Covered |
| Figure 8‑2: Drug-Coated Balloon Regions Covered, Global (1 of 2) |
| Figure 8‑3: Drug-Coated Balloon Regions Covered, Global (2 of 2) |
| Figure 8‑4: Drug-Coated Balloon Procedures by Region, Global, 2020 – 2030 |
| Figure 8‑5: Drug-Coated Balloon Procedures by Country, North America, 2020 – 2030 |
| Figure 8‑6: Drug-Coated Balloon Procedures by Country, Latin America, 2020 – 2030 (1 of 2) |
| Figure 8‑7: Drug-Coated Balloon Procedures by Country, Latin America, 2020 – 2030 (2 of 2) |
| Figure 8‑8: Drug-Coated Balloon Procedures by Country, Western Europe, 2020 – 2030 |
| Figure 8‑9: Drug-Coated Balloon Procedures by Country, Central & Eastern Europe, 2020 – 2030 (1 of 2) |
| Figure 8‑10: Drug-Coated Balloon Procedures by Country, Central & Eastern Europe, 2020 – 2030 (2 of 2) |
| Figure 8‑11: Drug-Coated Balloon Procedures by Country, Middle East, 2020 – 2030 |
| Figure 8‑12: Drug-Coated Balloon Procedures by Country, Asia-Pacific, 2020 – 2030 (1 of 3) |
| Figure 8‑13: Drug-Coated Balloon Procedures by Country, Asia-Pacific, 2020 – 2030 (2 of 3) |
| Figure 8‑14: Drug-Coated Balloon Procedures by Country, Asia-Pacific, 2020 – 2030 (3 of 3) |
| Figure 8‑15: Drug-Coated Balloon Procedures by Country, Africa, 2020 – 2030 |
| Figure 8‑16: Drug-Coated Balloon Market, Global, 2020 – 2030 |
| Figure 8‑17: Units Sold by Region, Drug-Coated Balloon Market, Global, 2020 – 2030 |
| Figure 8‑18: Average Selling Price by Region, Drug-Coated Balloon Market, Global, 2020 – 2030 (US$) |
| Figure 8‑19: Market Value by Region, Drug-Coated Balloon Market, Global, 2020 – 2030 (US$M) |
| Figure 8‑20: Leading Competitors, Drug-Coated Balloon Market, Global, 2023 |
| Figure 9‑1: Atherectomy Procedures Covered |
| Figure 9‑2: Atherectomy Markets Covered |
| Figure 9‑3: Atherectomy Device Regions Covered, Global (1 of 2) |
| Figure 9‑4: Atherectomy Device Regions Covered, Global (2 of 2) |
| Figure 9‑5: Atherectomy Procedures by Region, Global, 2020 – 2030 |
| Figure 9‑6: Atherectomy Procedures by Country, North America, 2020 – 2030 |
| Figure 9‑7: Atherectomy Procedures by Country, Latin America, 2020 – 2030 (1 of 2) |
| Figure 9‑8: Atherectomy Procedures by Country, Latin America, 2020 – 2030 (2 of 2) |
| Figure 9‑9: Atherectomy Procedures by Country, Western Europe, 2020 – 2030 |
| Figure 9‑10: Atherectomy Procedures by Country, Central & Eastern Europe, 2020 – 2030 (1 of 2) |
| Figure 9‑11: Atherectomy Procedures by Country, Central & Eastern Europe, 2020 – 2030 (2 of 2) |
| Figure 9‑12: Atherectomy Procedures by Country, Middle East, 2020 – 2030 |
| Figure 9‑13: Atherectomy Procedures by Country, Asia-Pacific, 2020 – 2030 (1 of 3) |
| Figure 9‑14: Atherectomy Procedures by Country, Asia-Pacific, 2020 – 2030 (2 of 3) |
| Figure 9‑15: Atherectomy Procedures by Country, Asia-Pacific, 2020 – 2030 (3 of 3) |
| Figure 9‑16: Atherectomy Procedures by Country, Africa, 2020 – 2030 |
| Figure 9‑17: Atherectomy Device Market by Segment, Global, 2020 – 2030 (US$M) |
| Figure 9‑18: Atherectomy Device Market by Region, Global, 2020 – 2030 (US$M) |
| Figure 9‑19: Laser Atherectomy Device Market, Global, 2020 – 2030 |
| Figure 9‑20: Units Sold by Region, Laser Atherectomy Device Market, Global, 2020 – 2030 |
| Figure 9‑21: Average Selling Price by Region, Laser atherectomy Device Market, Global, 2020 – 2030 (US$) |
| Figure 9‑22: Market Value by Region, Laser Atherectomy Device Market, Global, 2020 – 2030 (US$M) |
| Figure 9‑23: Mechanical Atherectomy Device Market, Global, 2020 – 2030 |
| Figure 9‑24: Units Sold by Region, Mechanical Atherectomy Device Market, Global, 2020 – 2030 |
| Figure 9‑25: Average Selling Price by Region, Mechanical Atherectomy Device Market, Global, 2020 – 2030 (US$) |
| Figure 9‑26: Market Value by Region, Mechanical Atherectomy Market, Global, 2020 – 2030 (US$M) |
| Figure 9‑27: Leading Competitors, Atherectomy Device Market, Global, 2023 |
| Figure 10‑1: Intravascular Lithotripsy Procedures Covered |
| Figure 10‑2: Intravascular Lithotripsy Regions Covered, Global (1 of 2) |
| Figure 10‑3: Intravascular Lithotripsy Regions Covered, Global (2 of 2) |
| Figure 10‑4: Intravascular Lithotripsy Procedures by Region, Global, 2020 – 2030 |
| Figure 10‑5: Intravascular Lithotripsy Procedures by Country, North America, 2020 – 2030 |
| Figure 10‑6: Intravascular Lithotripsy Procedures by Country, Latin America, 2020 – 2030 (1 of 2) |
| Figure 10‑7: Intravascular Lithotripsy Procedures by Country, Latin America, 2020 – 2030 (2 of 2) |
| Figure 10‑8: Intravascular Lithotripsy Procedures by Country, Western Europe, 2020 – 2030 |
| Figure 10‑9: Intravascular Lithotripsy Procedures by Country, Central & Eastern Europe, 2020 – 2030 (1 of 2) |
| Figure 10‑10: Intravascular Lithotripsy Procedures by Country, Central & Eastern Europe, 2020 – 2030 (2 of 2) |
| Figure 10‑11: Intravascular Lithotripsy Procedures by Country, Middle East, 2020 – 2030 |
| Figure 10‑12: Intravascular Lithotripsy Procedures by Country, Asia-Pacific, 2020 – 2030 (1 of 3) |
| Figure 10‑13: Intravascular Lithotripsy Procedures by Country, Asia-Pacific, 2020 – 2030 (2 of 3) |
| Figure 10‑14: Intravascular Lithotripsy Procedures by Country, Asia-Pacific, 2020 – 2030 (3 of 3) |
| Figure 10‑15: Intravascular Lithotripsy Procedures by Country, Africa, 2020 – 2030 |
| Figure 10‑16: Intravascular Lithotripsy Market, Global, 2020 – 2030 |
| Figure 10‑17: Units Sold by Region, Intravascular Lithotripsy Market, Global, 2020 – 2030 |
| Figure 10‑18: Average Selling Price by Region, Intravascular Lithotripsy Market, Global, 2020 – 2030 (US$) |
| Figure 10‑19: Market Value by Region, Intravascular Lithotripsy Market, Global, 2020 – 2030 (US$M) |
| Figure 10‑20: Leading Competitors, Intravascular Lithotripsy Market, Global, 2023 |
| Figure 11‑1: CTO Device Procedures Covered |
| Figure 11‑2: CTO Device Markets Covered |
| Figure 11‑3: CTO Device Regions Covered, Global (1 of 2) |
| Figure 11‑4: CTO Device Regions Covered, Global (2 of 2) |
| Figure 11‑5: CTO Procedures by Segment, Global, 2020 – 2030 |
| Figure 11‑6: CTO Procedures by Region, Global, 2020 – 2030 |
| Figure 11‑7: CTO Procedures by Country, North America, 2020 – 2030 |
| Figure 11‑8: CTO Procedures by Country, Latin America, 2020 – 2030 (1 of 2) |
| Figure 11‑9: CTO Procedures by Country, Latin America, 2020 – 2030 (2 of 2) |
| Figure 11‑10: CTO Procedures by Country, Western Europe, 2020 – 2030 |
| Figure 11‑11: CTO Procedures by Country, Central & Eastern Europe, 2020 – 2030 (1 of 2) |
| Figure 11‑12: CTO Procedures by Country, Central & Eastern Europe, 2020 – 2030 (2 of 2) |
| Figure 11‑13: CTO Procedures by Country, Middle East, 2020 – 2030 |
| Figure 11‑14: CTO Procedures by Country, Asia-Pacific, 2020 – 2030 (1 of 3) |
| Figure 11‑15: CTO Procedures by Country, Asia-Pacific, 2020 – 2030 (2 of 3) |
| Figure 11‑16: CTO Procedures by Country, Asia-Pacific, 2020 – 2030 (3 of 3) |
| Figure 11‑17: CTO Procedures by Country, Africa, 2020 – 2030 |
| Figure 11‑18: Re-Entry Procedures by Region, Global, 2020 – 2030 |
| Figure 11‑19: Re-Entry Procedures by Country, North America, 2020 – 2030 |
| Figure 11‑20: Re-Entry Procedures by Country, Latin America, 2020 – 2030 (1 of 2) |
| Figure 11‑21: Re-Entry Procedures by Country, Latin America, 2020 – 2030 (2 of 2) |
| Figure 11‑22: Re-Entry Procedures by Country, Western Europe, 2020 – 2030 |
| Figure 11‑23: Re-Entry Procedures by Country, Central & Eastern Europe, 2020 – 2030 (1 of 2) |
| Figure 11‑24: Re-Entry Procedures by Country, Central & Eastern Europe, 2020 – 2030 (2 of 2) |
| Figure 11‑25: Re-Entry Procedures by Country, Middle East, 2020 – 2030 |
| Figure 11‑26: Re-Entry Procedures by Country, Asia-Pacific, 2020 – 2030 (1 of 3) |
| Figure 11‑27: Re-Entry Procedures by Country, Asia-Pacific, 2020 – 2030 (2 of 3) |
| Figure 11‑28: Re-Entry Procedures by Country, Asia-Pacific, 2020 – 2030 (3 of 3) |
| Figure 11‑29: Re-Entry Procedures by Country, Africa, 2020 – 2030 |
| Figure 11‑30: Recanalization Procedures by Region, Global, 2020 – 2030 |
| Figure 11‑31: Recanalization Procedures by Country, North America, 2020 – 2030 |
| Figure 11‑32: Recanalization Procedures by Country, Latin America, 2020 – 2030 (1 of 2) |
| Figure 11‑33: Recanalization Procedures by Country, Latin America, 2020 – 2030 (2 of 2) |
| Figure 11‑34: Recanalization Procedures by Country, Western Europe, 2020 – 2030 |
| Figure 11‑35: Recanalization Procedures by Country, Central & Eastern Europe, 2020 – 2030 (1 of 2) |
| Figure 11‑36: Recanalization Procedures by Country, Central & Eastern Europe, 2020 – 2030 (2 of 2) |
| Figure 11‑37: Recanalization Procedures by Country, Middle East, 2020 – 2030 |
| Figure 11‑38: Recanalization Procedures by Country, Asia-Pacific, 2020 – 2030 (1 of 3) |
| Figure 11‑39: Recanalization Procedures by Country, Asia-Pacific, 2020 – 2030 (2 of 3) |
| Figure 11‑40: Recanalization Procedures by Country, Asia-Pacific, 2020 – 2030 (3 of 3) |
| Figure 11‑41: Recanalization Procedures by Country, Africa, 2020 – 2030 |
| Figure 11‑42: CTO Device Market by Segment, Global, 2020 – 2030 (US$M) |
| Figure 11‑43: CTO Device Market by Region, Global, 2020 – 2030 (US$M) |
| Figure 11‑44: Total CTO Device Market, Global, 2020 – 2030 |
| Figure 11‑45: Units Sold by Region, CTO Device Market, Global, 2020 – 2030 |
| Figure 11‑46: Average Selling Price by Region, CTO Device Market, Global, 2020 – 2030 (US$) |
| Figure 11‑47: Market Value by Region, CTO Device Market, Global, 2020 – 2030 (US$M) |
| Figure 11‑48: Re-Entry Device Market, Global, 2020 – 2030 |
| Figure 11‑49: Units Sold by Region, Re-Entry Device Market, Global, 2020 – 2030 |
| Figure 11‑50: Average Selling Price by Region, Re-Entry Device Market, Global, 2020 – 2030 (US$) |
| Figure 11‑51: Market Value by Region, Re-Entry Device Market, Global, 2020 – 2030 (US$M) |
| Figure 11‑52: Recanalization Device Market, Global, 2020 – 2030 |
| Figure 11‑53: Units Sold by Region, Recanalization Device Market, Global, 2020 – 2030 |
| Figure 11‑54: Average Selling Price by Region, Recanalization Device Market, Global, 2020 – 2030 (US$) |
| Figure 11‑55: Market Value by Region, Recanalization Device Market, Global, 2020 – 2030 (US$M) |
| Figure 11‑56: Leading Competitors, CTO Device Market, Global, 2023 |
| Figure 12‑1: Surgical Graft Procedures Covered |
| Figure 12‑2: Surgical Graft Markets Covered |
| Figure 12‑3: Surgical Graft Regions Covered, Global (1 of 2) |
| Figure 12‑4: Surgical Graft Regions Covered, Global (2 of 2) |
| Figure 12‑5: Surgical Graft Procedures by Segment, Global, 2020 – 2030 |
| Figure 12‑6: Surgical Graft Procedures by Region, Global, 2020 – 2030 |
| Figure 12‑7: Surgical Graft Procedures by Country, North America, 2020 – 2030 |
| Figure 12‑8: Surgical Graft Procedures by Country, Latin America, 2020 – 2030 (1 of 2) |
| Figure 12‑9: Surgical Graft Procedures by Country, Latin America, 2020 – 2030 (2 of 2) |
| Figure 12‑10: Surgical Graft Procedures by Country, Western Europe, 2020 – 2030 |
| Figure 12‑11: Surgical Graft Procedures by Country, Central & Eastern Europe, 2020 – 2030 (1 of 2) |
| Figure 12‑12: Surgical Graft Procedures by Country, Central & Eastern Europe, 2020 – 2030 (2 of 2) |
| Figure 12‑13: Surgical Graft Procedures by Country, Middle East, 2020 – 2030 |
| Figure 12‑14: Surgical Graft Procedures by Country, Asia-Pacific, 2020 – 2030 (1 of 3) |
| Figure 12‑15: Surgical Graft Procedures by Country, Asia-Pacific, 2020 – 2030 (2 of 3) |
| Figure 12‑16: Surgical Graft Procedures by Country, Asia-Pacific, 2020 – 2030 (3 of 3) |
| Figure 12‑17: Surgical Graft Procedures by Country, Africa, 2020 – 2030 |
| Figure 12‑18: Lower-Limb Surgical Graft Procedures by Region, Global, 2020 – 2030 |
| Figure 12‑19: Lower-Limb Surgical Graft Procedures by Country, North America, 2020 – 2030 |
| Figure 12‑20: Lower-Limb Surgical Graft Procedures by Country, Latin America, 2020 – 2030 (1 of 2) |
| Figure 12‑21: Lower-Limb Surgical Graft Procedures by Country, Latin America, 2020 – 2030 (2 of 2) |
| Figure 12‑22: Lower-Limb Surgical Graft Procedures by Country, Western Europe, 2020 – 2030 |
| Figure 12‑23: Lower-Limb Surgical Graft Procedures by Country, Central & Eastern Europe, 2020 – 2030 (1 of 2) |
| Figure 12‑24: Lower-Limb Surgical Graft Procedures by Country, Central & Eastern Europe, 2020 – 2030 (2 of 2) |
| Figure 12‑25: Lower-Limb Surgical Graft Procedures by Country, Middle East, 2020 – 2030 |
| Figure 12‑26: Lower-Limb Surgical Graft Procedures by Country, Asia-Pacific, 2020 – 2030 (1 of 3) |
| Figure 12‑27: Lower-Limb Surgical Graft Procedures by Country, Asia-Pacific, 2020 – 2030 (2 of 3) |
| Figure 12‑28: Lower-Limb Surgical Graft Procedures by Country, Asia-Pacific, 2020 – 2030 (3 of 3) |
| Figure 12‑29: Lower-Limb Surgical Graft Procedures by Country, Africa, 2020 – 2030 |
| Figure 12‑30: Aorta Repair Surgical Graft Procedures by Segment, Global, 2020 – 2030 |
| Figure 12‑31: Aorta Repair Surgical Graft Procedures by Region, Global, 2020 – 2030 |
| Figure 12‑32: Aorta Repair Surgical Graft Procedures by Country, North America, 2020 – 2030 |
| Figure 12‑33: Aorta Repair Surgical Graft Procedures by Country, Latin America, 2020 – 2030 (1 of 2) |
| Figure 12‑34: Aorta Repair Surgical Graft Procedures by Country, Latin America, 2020 – 2030 (2 of 2) |
| Figure 12‑35: Aorta Repair Surgical Graft Procedures by Country, Western Europe, 2020 – 2030 |
| Figure 12‑36: Aorta Repair Surgical Graft Procedures by Country, Central & Eastern Europe, 2020 – 2030 (1 of 2) |
| Figure 12‑37: Aorta Repair Surgical Graft Procedures by Country, Central & Eastern Europe, 2020 – 2030 (2 of 2) |
| Figure 12‑38: Aorta Repair Surgical Graft Procedures by Country, Middle East, 2020 – 2030 |
| Figure 12‑39: Aorta Repair Surgical Graft Procedures by Country, Asia-Pacific, 2020 – 2030 (1 of 3) |
| Figure 12‑40: Aorta Repair Surgical Graft Procedures by Country, Asia-Pacific, 2020 – 2030 (2 of 3) |
| Figure 12‑41: Aorta Repair Surgical Graft Procedures by Country, Asia-Pacific, 2020 – 2030 (3 of 3) |
| Figure 12‑42: Aorta Repair Surgical Graft Procedures by Country, Africa, 2020 – 2030 |
| Figure 12‑43: AAA Surgical Graft Procedures by Region, Global, 2020 – 2030 |
| Figure 12‑44: AAA Surgical Graft Procedures by Country, North America, 2020 – 2030 |
| Figure 12‑45: AAA Surgical Graft Procedures by Country, Latin America, 2020 – 2030 (1 of 2) |
| Figure 12‑46: AAA Surgical Graft Procedures by Country, Latin America, 2020 – 2030 (2 of 2) |
| Figure 12‑47: AAA Surgical Graft Procedures by Country, Western Europe, 2020 – 2030 |
| Figure 12‑48: AAA Surgical Graft Procedures by Country, Central & Eastern Europe, 2020 – 2030 (1 of 2) |
| Figure 12‑49: AAA Surgical Graft Procedures by Country, Central & Eastern Europe, 2020 – 2030 (2 of 2) |
| Figure 12‑50: AAA Surgical Graft Procedures by Country, Middle East, 2020 – 2030 |
| Figure 12‑51: AAA Surgical Graft Procedures by Country, Asia-Pacific, 2020 – 2030 (1 of 3) |
| Figure 12‑52: AAA Surgical Graft Procedures by Country, Asia-Pacific, 2020 – 2030 (2 of 3) |
| Figure 12‑53: AAA Surgical Graft Procedures by Country, Asia-Pacific, 2020 – 2030 (3 of 3) |
| Figure 12‑54: AAA Surgical Graft Procedures by Country, Africa, 2020 – 2030 |
| Figure 12‑55: TAA Surgical Graft Procedures by Region, Global, 2020 – 2030 |
| Figure 12‑56: TAA Surgical Graft Procedures by Country, North America, 2020 – 2030 |
| Figure 12‑57: TAA Surgical Graft Procedures by Country, Latin America, 2020 – 2030 (1 of 2) |
| Figure 12‑58: TAA Surgical Graft Procedures by Country, Latin America, 2020 – 2030 (2 of 2) |
| Figure 12‑59: TAA Surgical Graft Procedures by Country, Western Europe, 2020 – 2030 |
| Figure 12‑60: TAA Surgical Graft Procedures by Country, Central & Eastern Europe, 2020 – 2030 (1 of 2) |
| Figure 12‑61: TAA Surgical Graft Procedures by Country, Central & Eastern Europe, 2020 – 2030 (2 of 2) |
| Figure 12‑62: TAA Surgical Graft Procedures by Country, Middle East, 2020 – 2030 |
| Figure 12‑63: TAA Surgical Graft Procedures by Country, Asia-Pacific, 2020 – 2030 (1 of 3) |
| Figure 12‑64: TAA Surgical Graft Procedures by Country, Asia-Pacific, 2020 – 2030 (2 of 3) |
| Figure 12‑65: TAA Surgical Graft Procedures by Country, Asia-Pacific, 2020 – 2030 (3 of 3) |
| Figure 12‑66: TAA Surgical Graft Procedures by Country, Africa, 2020 – 2030 |
| Figure 12‑67: Extra-Anatomical Bypass Surgical Graft Procedures by Region, Global, 2020 – 2030 |
| Figure 12‑68: Extra-Anatomical Bypass Surgical Graft Procedures by Country, North America, 2020 – 2030 |
| Figure 12‑69: Extra-Anatomical Bypass Surgical Graft Procedures by Country, Latin America, 2020 – 2030 (1 of 2) |
| Figure 12‑70: Extra-Anatomical Bypass Surgical Graft Procedures by Country, Latin America, 2020 – 2030 (2 of 2) |
| Figure 12‑71: Extra-Anatomical Bypass Surgical Graft Procedures by Country, Western Europe, 2020 – 2030 |
| Figure 12‑72: Extra-Anatomical Bypass Surgical Graft Procedures by Country, Central & Eastern Europe, 2020 – 2030 (1 of 2) |
| Figure 12‑73: Extra-Anatomical Bypass Surgical Graft Procedures by Country, Central & Eastern Europe, 2020 – 2030 (2 of 2) |
| Figure 12‑74: Extra-Anatomical Bypass Surgical Graft Procedures by Country, Middle East, 2020 – 2030 |
| Figure 12‑75: Extra-Anatomical Bypass Surgical Graft Procedures by Country, Asia-Pacific, 2020 – 2030 (1 of 3) |
| Figure 12‑76: Extra-Anatomical Bypass Surgical Graft Procedures by Country, Asia-Pacific, 2020 – 2030 (2 of 3) |
| Figure 12‑77: Extra-Anatomical Bypass Surgical Graft Procedures by Country, Asia-Pacific, 2020 – 2030 (3 of 3) |
| Figure 12‑78: Extra-Anatomical Bypass Surgical Graft Procedures by Country, Africa, 2020 – 2030 |
| Figure 12‑79: Surgical Graft Market by Segment, Global, 2020 – 2030 (US$M) |
| Figure 12‑80: Surgical Graft Market by Region, Global, 2020 – 2030 (US$M) |
| Figure 12‑81: Total Surgical Graft Market, Global, 2020 – 2030 |
| Figure 12‑82: Units Sold by Region, Surgical Graft Market, Global, 2020 – 2030 |
| Figure 12‑83: Average Selling Price by Region, Surgical Graft Market, Global, 2020 – 2030 (US$) |
| Figure 12‑84: Market Value by Region, Surgical Graft Market, Global, 2020 – 2030 (US$M) |
| Figure 12‑85: Lower-Limb Surgical Graft Market, Global, 2020 – 2030 |
| Figure 12‑86: Units Sold by Region, Lower-Limb Surgical Graft Market, Global, 2020 – 2030 |
| Figure 12‑87: Average Selling Price by Region, Lower-Limb Surgical Graft Market, Global, 2020 – 2030 (US$) |
| Figure 12‑88: Market Value by Region, Lower-Limb Surgical Graft Market, Global, 2020 – 2030 (US$M) |
| Figure 12‑89: Aorta Repair Surgical Graft Market by Segment, Global, 2020 – 2030 (US$M) |
| Figure 12‑90: Total Aorta Repair Surgical Graft Market, Global, 2020 – 2030 |
| Figure 12‑91: Units Sold by Region, Aorta Repair Surgical Graft Market, Global, 2020 – 2030 |
| Figure 12‑92: Average Selling Price by Region, Aorta Repair Surgical Graft Market, Global, 2020 – 2030 (US$) |
| Figure 12‑93: Market Value by Region, Aorta Repair Surgical Graft Market, Global, 2020 – 2030 (US$M) |
| Figure 12‑94: AAA Surgical Graft Surgical Graft Market, Global, 2020 – 2030 |
| Figure 12‑95: Units Sold by Region, AAA Surgical Graft Surgical Graft Market, Global, 2020 – 2030 |
| Figure 12‑96: Average Selling Price by Region, AAA Surgical Graft Surgical Graft Market, Global, 2020 – 2030 (US$) |
| Figure 12‑97: Market Value by Region, AAA Surgical Graft Surgical Graft Market, Global, 2020 – 2030 (US$M) |
| Figure 12‑98: TAA Surgical Graft Surgical Graft Market, Global, 2020 – 2030 |
| Figure 12‑99: Units Sold by Region, TAA Surgical Graft Surgical Graft Market, Global, 2020 – 2030 |
| Figure 12‑100: Average Selling Price by Region, TAA Surgical Graft Surgical Graft Market, Global, 2020 – 2030 (US$) |
| Figure 12‑101: Market Value by Region, TAA Surgical Graft Surgical Graft Market, Global, 2020 – 2030 (US$M) |
| Figure 12‑102: Extra-Anatomical Bypass Surgical Graft Market, Global, 2020 – 2030 |
| Figure 12‑103: Units Sold by Region, Extra-Anatomical Bypass Surgical Graft Market, Global, 2020 – 2030 |
| Figure 12‑104: Average Selling Price by Region, Extra-Anatomical Bypass Surgical Graft Market, Global, 2020 – 2030 (US$) |
| Figure 12‑105: Market Value by Region, Extra-Anatomical Bypass Surgical Graft Market, Global, 2020 – 2030 (US$M) |
| Figure 12‑106: Leading Competitors, Surgical Graft Market, Global, 2023 |
| Figure 13‑1: Stent Graft Procedures Covered |
| Figure 13‑2: Stent Graft Markets Covered |
| Figure 13‑3: Stent Graft Regions Covered, Global (1 of 2) |
| Figure 13‑4: Stent Graft Regions Covered, Global (2 of 2) |
| Figure 13‑5: Stent Graft Procedures by Segment, Global, 2020 – 2030 |
| Figure 13‑6: Stent Graft Procedures by Region, Global, 2020 – 2030 |
| Figure 13‑7: Stent Graft Procedures by Country, North America, 2020 – 2030 |
| Figure 13‑8: Stent Graft Procedures by Country, Latin America, 2020 – 2030 (1 of 2) |
| Figure 13‑9: Stent Graft Procedures by Country, Latin America, 2020 – 2030 (2 of 2) |
| Figure 13‑10: Stent Graft Procedures by Country, Western Europe, 2020 – 2030 |
| Figure 13‑11: Stent Graft Procedures by Country, Central & Eastern Europe, 2020 – 2030 (1 of 2) |
| Figure 13‑12: Stent Graft Procedures by Country, Central & Eastern Europe, 2020 – 2030 (2 of 2) |
| Figure 13‑13: Stent Graft Procedures by Country, Middle East, 2020 – 2030 |
| Figure 13‑14: Stent Graft Procedures by Country, Asia-Pacific, 2020 – 2030 (1 of 3) |
| Figure 13‑15: Stent Graft Procedures by Country, Asia-Pacific, 2020 – 2030 (2 of 3) |
| Figure 13‑16: Stent Graft Procedures by Country, Asia-Pacific, 2020 – 2030 (3 of 3) |
| Figure 13‑17: Stent Graft Procedures by Country, Africa, 2020 – 2030 |
| Figure 13‑18: AAA Stent Graft Procedures by Region, Global, 2020 – 2030 |
| Figure 13‑19: AAA Stent Graft Procedures by Country, North America, 2020 – 2030 |
| Figure 13‑20: AAA Stent Graft Procedures by Country, Latin America, 2020 – 2030 (1 of 2) |
| Figure 13‑21: AAA Stent Graft Procedures by Country, Latin America, 2020 – 2030 (2 of 2) |
| Figure 13‑22: AAA Stent Graft Procedures by Country, Western Europe, 2020 – 2030 |
| Figure 13‑23: AAA Stent Graft Procedures by Country, Central & Eastern Europe, 2020 – 2030 (1 of 2) |
| Figure 13‑24: AAA Stent Graft Procedures by Country, Central & Eastern Europe, 2020 – 2030 (2 of 2) |
| Figure 13‑25: AAA Stent Graft Procedures by Country, Middle East, 2020 – 2030 |
| Figure 13‑26: AAA Stent Graft Procedures by Country, Asia-Pacific, 2020 – 2030 (1 of 3) |
| Figure 13‑27: AAA Stent Graft Procedures by Country, Asia-Pacific, 2020 – 2030 (2 of 3) |
| Figure 13‑28: AAA Stent Graft Procedures by Country, Asia-Pacific, 2020 – 2030 (3 of 3) |
| Figure 13‑29: AAA Stent Graft Procedures by Country, Africa, 2020 – 2030 |
| Figure 13‑30: Fenestrated Stent Graft Procedures by Region, Global, 2020 – 2030 |
| Figure 13‑31: Fenestrated Stent Graft Procedures by Country, North America, 2020 – 2030 |
| Figure 13‑32: Fenestrated Stent Graft Procedures by Country, Latin America, 2020 – 2030 (1 of 2) |
| Figure 13‑33: Fenestrated Stent Graft Procedures by Country, Latin America, 2020 – 2030 (2 of 2) |
| Figure 13‑34: Fenestrated Stent Graft Procedures by Country, Western Europe, 2020 – 2030 |
| Figure 13‑35: Fenestrated Stent Graft Procedures by Country, Central & Eastern Europe, 2020 – 2030 (1 of 2) |
| Figure 13‑36: Fenestrated Stent Graft Procedures by Country, Central & Eastern Europe, 2020 – 2030 (2 of 2) |
| Figure 13‑37: Fenestrated Stent Graft Procedures by Country, Middle East, 2020 – 2030 |
| Figure 13‑38: Fenestrated Stent Graft Procedures by Country, Asia-Pacific, 2020 – 2030 (1 of 3) |
| Figure 13‑39: Fenestrated Stent Graft Procedures by Country, Asia-Pacific, 2020 – 2030 (2 of 3) |
| Figure 13‑40: Fenestrated Stent Graft Procedures by Country, Asia-Pacific, 2020 – 2030 (3 of 3) |
| Figure 13‑41: Fenestrated Stent Graft Procedures by Country, Africa, 2020 – 2030 |
| Figure 13‑42: TAA Stent Graft Procedures by Region, Global, 2020 – 2030 |
| Figure 13‑43: TAA Stent Graft Procedures by Country, North America, 2020 – 2030 |
| Figure 13‑44: TAA Stent Graft Procedures by Country, Latin America, 2020 – 2030 (1 of 2) |
| Figure 13‑45: TAA Stent Graft Procedures by Country, Latin America, 2020 – 2030 (2 of 2) |
| Figure 13‑46: TAA Stent Graft Procedures by Country, Western Europe, 2020 – 2030 |
| Figure 13‑47: TAA Stent Graft Procedures by Country, Central & Eastern Europe, 2020 – 2030 (1 of 2) |
| Figure 13‑48: TAA Stent Graft Procedures by Country, Central & Eastern Europe, 2020 – 2030 (2 of 2) |
| Figure 13‑49: TAA Stent Graft Procedures by Country, Middle East, 2020 – 2030 |
| Figure 13‑50: TAA Stent Graft Procedures by Country, Asia-Pacific, 2020 – 2030 (1 of 3) |
| Figure 13‑51: TAA Stent Graft Procedures by Country, Asia-Pacific, 2020 – 2030 (2 of 3) |
| Figure 13‑52: TAA Stent Graft Procedures by Country, Asia-Pacific, 2020 – 2030 (3 of 3) |
| Figure 13‑53: TAA Stent Graft Procedures by Country, Africa, 2020 – 2030 |
| Figure 13‑54: Stent Graft Market by Segment, Global, 2020 – 2030 (US$M) |
| Figure 13‑55: Stent Graft Market by Region, Global, 2020 – 2030 (US$M) |
| Figure 13‑56: Stent Graft Market, Global, 2020 – 2030 |
| Figure 13‑57: Units Sold by Region, Stent Graft Market, Global, 2020 – 2030 |
| Figure 13‑58: Average Selling Price by Region, Stent Graft Market, Global, 2020 – 2030 (US$) |
| Figure 13‑59: Market Value by Region, Stent Graft Market, Global, 2020 – 2030 (US$M) |
| Figure 13‑60: AAA Stent Graft Market, Global, 2020 – 2030 |
| Figure 13‑61: Units Sold by Region, AAA Stent Graft Market, Global, 2020 – 2030 |
| Figure 13‑62: Average Selling Price by Region, AAA Stent Graft Market, Global, 2020 – 2030 (US$) |
| Figure 13‑63: Market Value by Region, AAA Stent Graft Market, Global, 2020 – 2030 (US$M) |
| Figure 13‑64: Fenestrated Stent Graft Market, Global, 2020 – 2030 |
| Figure 13‑65: Units Sold by Region, Fenestrated Stent Graft Market, Global, 2020 – 2030 |
| Figure 13‑66: Average Selling Price by Region, Fenestrated Stent Graft Market, Global, 2020 – 2030 (US$) |
| Figure 13‑67: Market Value by Region, Fenestrated Stent Graft Market, Global, 2020 – 2030 (US$M) |
| Figure 13‑68: TAA Stent Graft Market, Global, 2020 – 2030 |
| Figure 13‑69: Units Sold by Region, TAA Stent Graft Market, Global, 2020 – 2030 |
| Figure 13‑70: Average Selling Price by Region, TAA Stent Graft Market, Global, 2020 – 2030 (US$) |
| Figure 13‑71: Market Value by Region, TAA Stent Graft Market, Global, 2020 – 2030 (US$M) |
| Figure 13‑72: Leading Competitors, Stent Graft Market, Global, 2023 |
| Figure 14‑1: Embolic Protection Device Procedures Covered |
| Figure 14‑2: Embolic Protection Device Markets Covered |
| Figure 14‑3: Embolic Protection Device Regions Covered, Global (1 of 2) |
| Figure 14‑4: Embolic Protection Device Regions Covered, Global (2 of 2) |
| Figure 14‑5: Embolic Protection Device Procedures by Region, Global, 2020 – 2030 |
| Figure 14‑6: Embolic Protection Device Procedures by Country, North America, 2020 – 2030 |
| Figure 14‑7: Embolic Protection Device Procedures by Country, Latin America, 2020 – 2030 (1 of 2) |
| Figure 14‑8: Embolic Protection Device Procedures by Country, Latin America, 2020 – 2030 (2 of 2) |
| Figure 14‑9: Embolic Protection Device Procedures by Country, Western Europe, 2020 – 2030 |
| Figure 14‑10: Embolic Protection Device Procedures by Country, Central & Eastern Europe, 2020 – 2030 (1 of 2) |
| Figure 14‑11: Embolic Protection Device Procedures by Country, Central & Eastern Europe, 2020 – 2030 (2 of 2) |
| Figure 14‑12: Embolic Protection Device Procedures by Country, Middle East, 2020 – 2030 |
| Figure 14‑13: Embolic Protection Device Procedures by Country, Asia-Pacific, 2020 – 2030 (1 of 3) |
| Figure 14‑14: Embolic Protection Device Procedures by Country, Asia-Pacific, 2020 – 2030 (2 of 3) |
| Figure 14‑15: Embolic Protection Device Procedures by Country, Asia-Pacific, 2020 – 2030 (3 of 3) |
| Figure 14‑16: Embolic Protection Device Procedures by Country, Africa, 2020 – 2030 |
| Figure 14‑17: Embolic Protection Device Market by Segment, Global, 2020 – 2030 (US$M) |
| Figure 14‑18: Embolic Protection Device Market by Region, Global, 2020 – 2030 (US$M) |
| Figure 14‑19: Embolic Protection Device Market, Global, 2020 – 2030 |
| Figure 14‑20: Units Sold by Region, Embolic Protection Device Market, Global, 2020 – 2030 |
| Figure 14‑21: Average Selling Price by Region, Embolic Protection Device Market, Global, 2020 – 2030 (US$) |
| Figure 14‑22: Market Value by Region, Embolic Protection Device Market, Global, 2020 – 2030 (US$M) |
| Figure 14‑23: Carotid EPD Market, Global, 2020 – 2030 |
| Figure 14‑24: Units Sold by Region, Carotid EPD Market, Global, 2020 – 2030 |
| Figure 14‑25: Average Selling Price by Region, Carotid EPD Market, Global, 2020 – 2030 (US$) |
| Figure 14‑26: Market Value by Region, Carotid EPD Market, Global, 2020 – 2030 (US$M) |
| Figure 14‑27: Renal EPD Market, Global, 2020 – 2030 |
| Figure 14‑28: Units Sold by Region, Renal EPD Market, Global, 2020 – 2030 |
| Figure 14‑29: Average Selling Price by Region, Renal EPD Market, Global, 2020 – 2030 (US$) |
| Figure 14‑30: Market Value by Region, Renal EPD Market, Global, 2020 – 2030 (US$M) |
| Figure 14‑31: Lower-Limb EPD Market, Global, 2020 – 2030 |
| Figure 14‑32: Units Sold by Region, Lower-Limb EPD Market, Global, 2020 – 2030 |
| Figure 14‑33: Average Selling Price by Region, Lower-Limb EPD Market, Global, 2020 – 2030 (US$) |
| Figure 14‑34: Market Value by Region, Lower-Limb EPD Market, Global, 2020 – 2030 (US$M) |
| Figure 14‑35: Leading Competitors, Embolic Protection Device Market, Global, 2023 |
| Figure 15‑1: Peripheral Thrombus Management Procedures Covered |
| Figure 15‑2: Peripheral Thrombus Management Markets Covered |
| Figure 15‑3: Peripheral Thrombus Management Regions Covered, Global (1 of 2) |
| Figure 15‑4: Peripheral Thrombus Management Regions Covered, Global (2 of 2) |
| Figure 15‑5: Peripheral Thrombus Management Procedures by Region, Global, 2020 – 2030 |
| Figure 15‑6: Peripheral Thrombus Management Procedures by Country, North America, 2020 – 2030 |
| Figure 15‑7: Peripheral Thrombus Management Procedures by Country, Latin America, 2020 – 2030 (1 of 2) |
| Figure 15‑8: Peripheral Thrombus Management Procedures by Country, Latin America, 2020 – 2030 (2 of 2) |
| Figure 15‑9: Peripheral Thrombus Management Procedures by Country, Western Europe, 2020 – 2030 |
| Figure 15‑10: Peripheral Thrombus Management Procedures by Country, Central & Eastern Europe, 2020 – 2030 (1 of 2) |
| Figure 15‑11: Peripheral Thrombus Management Procedures by Country, Central & Eastern Europe, 2020 – 2030 (2 of 2) |
| Figure 15‑12: Peripheral Thrombus Management Procedures by Country, Middle East, 2020 – 2030 |
| Figure 15‑13: Peripheral Thrombus Management Procedures by Country, Asia-Pacific, 2020 – 2030 (1 of 3) |
| Figure 15‑14: Peripheral Thrombus Management Procedures by Country, Asia-Pacific, 2020 – 2030 (2 of 3) |
| Figure 15‑15: Peripheral Thrombus Management Procedures by Country, Asia-Pacific, 2020 – 2030 (3 of 3) |
| Figure 15‑16: Peripheral Thrombus Management Procedures by Country, Africa, 2020 – 2030 |
| Figure 15‑17: Peripheral Thrombus Management Market by Segment, Global, 2020 – 2030 (US$M) |
| Figure 15‑18: Peripheral Thrombus Management Market by Region, Global, 2020 – 2030 (US$M) |
| Figure 15‑19: Peripheral Thrombus Management Market, Global, 2020 – 2030 |
| Figure 15‑20: Units Sold by Region, Peripheral Thrombus Management Market, Global, 2020 – 2030 |
| Figure 15‑21: Average Selling Price by Region, Peripheral Thrombus Management Market, Global, 2020 – 2030 (US$) |
| Figure 15‑22: Market Value by Region, Peripheral Thrombus Management Market, Global, 2020 – 2030 (US$M) |
| Figure 15‑23: Traditional Thrombectomy Device Market, Global, 2020 – 2030 |
| Figure 15‑24: Units Sold by Region, Traditional Thrombectomy Device Market, Global, 2020 – 2030 |
| Figure 15‑25: Average Selling Price by Region, Traditional Thrombectomy Device Market, Global, 2020 – 2030 (US$) |
| Figure 15‑26: Market Value by Region, Traditional Thrombectomy Device Market, Global, 2020 – 2030 (US$M) |
| Figure 15‑27: Pharmacomechanical Thrombectomy Device Market, Global, 2020 – 2030 |
| Figure 15‑28: Units Sold by Region, Pharmacomechanical Thrombectomy Device Market, Global, 2020 – 2030 |
| Figure 15‑29: Average Selling Price by Region, Pharmacomechanical Thrombectomy Device Market, Global, 2020 – 2030 (US$) |
| Figure 15‑30: Market Value by Region, Pharmacomechanical Thrombectomy Device Market, Global, 2020 – 2030 (US$M) |
| Figure 15‑31: Leading Competitors, Peripheral Thrombus Management Market, Global, 2023 |
| Figure 16‑1: Inferior Vena Cava Filter Procedures Covered |
| Figure 16‑2: Inferior Vena Cava Filter Regions Covered, Global (1 of 2) |
| Figure 16‑3: Inferior Vena Cava Filter Regions Covered, Global (2 of 2) |
| Figure 16‑4: Inferior Vena Cava Filter Placement Procedures by Region, Global, 2020 – 2030 |
| Figure 16‑5: Inferior Vena Cava Filter Placement Procedures by Country, North America, 2020 – 2030 |
| Figure 16‑6: Inferior Vena Cava Filter Placement Procedures by Country, Latin America, 2020 – 2030 (1 of 2) |
| Figure 16‑7: Inferior Vena Cava Filter Placement Procedures by Country, Latin America, 2020 – 2030 (2 of 2) |
| Figure 16‑8: Inferior Vena Cava Filter Placement Procedures by Country, Western Europe, 2020 – 2030 |
| Figure 16‑9: Inferior Vena Cava Filter Placement Procedures by Country, Central & Eastern Europe, 2020 – 2030 (1 of 2) |
| Figure 16‑10: Inferior Vena Cava Filter Placement Procedures by Country, Central & Eastern Europe, 2020 – 2030 (2 of 2) |
| Figure 16‑11: Inferior Vena Cava Filter Placement Procedures by Country, Middle East, 2020 – 2030 |
| Figure 16‑12: Inferior Vena Cava Filter Placement Procedures by Country, Asia-Pacific, 2020 – 2030 (1 of 3) |
| Figure 16‑13: Inferior Vena Cava Filter Placement Procedures by Country, Asia-Pacific, 2020 – 2030 (2 of 3) |
| Figure 16‑14: Inferior Vena Cava Filter Placement Procedures by Country, Asia-Pacific, 2020 – 2030 (3 of 3) |
| Figure 16‑15: Inferior Vena Cava Filter Placement Procedures by Country, Africa, 2020 – 2030 |
| Figure 16‑16: Inferior Vena Cava Filter Market, Global, 2020 – 2030 |
| Figure 16‑17: Units Sold by Region, Inferior Vena Cava Filter Market, Global, 2020 – 2030 |
| Figure 16‑18: Average Selling Price by Region, Inferior Vena Cava Filter Market, Global, 2020 – 2030 (US$) |
| Figure 16‑19: Market Value by Region, Inferior Vena Cava Filter Market, Global, 2020 – 2030 (US$M) |
| Figure 16‑20: Leading Competitors, Inferior Vena Cava Filter Market, Global, 2023 |
| Figure 17‑1: Carotid Shunt Procedures Covered |
| Figure 17‑2: Carotid Shunt Regions Covered, Global (1 of 2) |
| Figure 17‑3: Carotid Shunt Regions Covered, Global (2 of 2) |
| Figure 17‑4: Carotid Endarterectomy Procedures by Region, Global, 2020 – 2030 |
| Figure 17‑5: Carotid Endarterectomy Procedures by Country, North America, 2020 – 2030 |
| Figure 17‑6: Carotid Endarterectomy Procedures by Country, Latin America, 2020 – 2030 (1 of 2) |
| Figure 17‑7: Carotid Endarterectomy Procedures by Country, Latin America, 2020 – 2030 (2 of 2) |
| Figure 17‑8: Carotid Endarterectomy Procedures by Country, Western Europe, 2020 – 2030 |
| Figure 17‑9: Carotid Endarterectomy Procedures by Country, Central & Eastern Europe, 2020 – 2030 (1 of 2) |
| Figure 17‑10: Carotid Endarterectomy Procedures by Country, Central & Eastern Europe, 2020 – 2030 (2 of 2) |
| Figure 17‑11: Carotid Endarterectomy Procedures by Country, Middle East, 2020 – 2030 |
| Figure 17‑12: Carotid Endarterectomy Procedures by Country, Asia-Pacific, 2020 – 2030 (1 of 3) |
| Figure 17‑13: Carotid Endarterectomy Procedures by Country, Asia-Pacific, 2020 – 2030 (2 of 3) |
| Figure 17‑14: Carotid Endarterectomy Procedures by Country, Asia-Pacific, 2020 – 2030 (3 of 3) |
| Figure 17‑15: Carotid Endarterectomy Procedures by Country, Africa, 2020 – 2030 |
| Figure 17‑16: Carotid Shunt Market, Global, 2020 – 2030 |
| Figure 17‑17: Units Sold by Region, Carotid Shunt Market, Global, 2020 – 2030 |
| Figure 17‑18: Average Selling Price by Region, Carotid Shunt Market, Global, 2020 – 2030 (US$) |
| Figure 17‑19: Market Value by Region, Carotid Shunt Market, Global, 2020 – 2030 (US$M) |
| Figure 17‑20: Leading Competitors, Carotid Shunt Market, Global, 2023 |
| Figure 18‑1: Diagnostic & Interventional Catheter Markets Covered |
| Figure 18‑2: Diagnostic & Interventional Catheter Regions Covered, Global (1 of 2) |
| Figure 18‑3: Diagnostic & Interventional Catheter Regions Covered, Global (2 of 2) |
| Figure 18‑4: Diagnostic & Interventional Catheter Market by Segment, Global, 2020 – 2030 (US$M) |
| Figure 18‑5: Diagnostic & Interventional Catheter Market by Region, Global, 2020 – 2030 (US$M) |
| Figure 18‑6: Diagnostic & Interventional Catheter Market, Global, 2020 – 2030 |
| Figure 18‑7: Units Sold by Region, Diagnostic & Interventional Catheter Market, Global, 2020 – 2030 |
| Figure 18‑8: Average Selling Price by Region, Diagnostic & Interventional Catheter Market, Global, 2020 – 2030 (US$) |
| Figure 18‑9: Market Value by Region, Diagnostic & Interventional Catheter Market, Global, 2020 – 2030 (US$M) |
| Figure 18‑10: Diagnostic Catheter Market by Segment, Global, 2020 – 2030 (US$M) |
| Figure 18‑11: Total Diagnostic Catheter Market, Global, 2020 – 2030 |
| Figure 18‑12: Units Sold by Region, Diagnostic Catheter Market, Global, 2020 – 2030 |
| Figure 18‑13: Average Selling Price by Region, Diagnostic Catheter Market, Global, 2020 – 2030 (US$) |
| Figure 18‑14: Market Value by Region, Diagnostic Catheter Market, Global, 2020 – 2030 (US$M) |
| Figure 18‑15: Standard Diagnostic Catheter Market, Global, 2020 – 2030 |
| Figure 18‑16: Units Sold by Region, Standard Diagnostic Catheter Market, Global, 2020 – 2030 |
| Figure 18‑17: Average Selling Price by Region, Standard Diagnostic Catheter Market, Global, 2020 – 2030 (US$) |
| Figure 18‑18: Market Value by Region, Standard Diagnostic Catheter Market, Global, 2020 – 2030 (US$M) |
| Figure 18‑19: Hydrophilic Diagnostic Catheter Market, Global, 2020 – 2030 |
| Figure 18‑20: Units Sold by Region, Hydrophilic Diagnostic Catheter Market, Global, 2020 – 2030 |
| Figure 18‑21: Average Selling Price by Region, Hydrophilic Diagnostic Catheter Market, Global, 2020 – 2030 (US$) |
| Figure 18‑22: Market Value by Region, Hydrophilic Diagnostic Catheter Market, Global, 2020 – 2030 (US$M) |
| Figure 18‑23: Support Catheter Market, Global, 2020 – 2030 |
| Figure 18‑24: Units Sold by Region, Support Catheter Market, Global, 2020 – 2030 |
| Figure 18‑25: Average Selling Price by Region, Support Catheter Market, Global, 2020 – 2030 (US$) |
| Figure 18‑26: Market Value by Region, Support Catheter Market, Global, 2020 – 2030 (US$M) |
| Figure 18‑27: Leading Competitors, Diagnostic & Interventional Catheter Market, Global, 2023 |
| Figure 19‑1: Diagnostic & Interventional Guidewire Markets Covered |
| Figure 19‑2: Diagnostic & Interventional Guidewire Regions Covered, Global (1 of 2) |
| Figure 19‑3: Diagnostic & Interventional Guidewire Regions Covered, Global (2 of 2) |
| Figure 19‑4: Diagnostic and Interventional Guidewire Market by Segment, Global, 2020 – 2030 (US$M) |
| Figure 19‑5: Diagnostic and Interventional Guidewire Market by Region, Global, 2020 – 2030 (US$M) |
| Figure 19‑6: Diagnostic & Interventional Guidewire Market, Global, 2020 – 2030 |
| Figure 19‑7: Units Sold by Region, Diagnostic & Interventional Guidewire Market, Global, 2020 – 2030 |
| Figure 19‑8: Average Selling Price by Region, Diagnostic & Interventional Guidewire Market, Global, 2020 – 2030 (US$) |
| Figure 19‑9: Market Value by Region, Diagnostic & Interventional Guidewire Market, Global, 2020 – 2030 (US$M) |
| Figure 19‑10: Standard Guidewire Market, Global, 2020 – 2030 |
| Figure 19‑11: Units Sold by Region, Standard Guidewire Market, Global, 2020 – 2030 |
| Figure 19‑12: Average Selling Price by Region, Standard Guidewire Market, Global, 2020 – 2030 (US$) |
| Figure 19‑13: Market Value by Region, Standard Guidewire Market, Global, 2020 – 2030 (US$M) |
| Figure 19‑14: Hydrophilic Guidewire Market, Global, 2020 – 2030 |
| Figure 19‑15: Units Sold by Region, Hydrophilic Guidewire Market, Global, 2020 – 2030 |
| Figure 19‑16: Average Selling Price by Region, Hydrophilic Guidewire Market, Global, 2020 – 2030 (US$) |
| Figure 19‑17: Market Value by Region, Hydrophilic Guidewire Market, Global, 2020 – 2030 (US$M) |
| Figure 19‑18: Leading Competitors, Diagnostic & Interventional Guidewire Market, Global, 2023 |
| Figure 20‑1: Introducer Sheath Regions Covered, Global (1 of 2) |
| Figure 20‑2: Introducer Sheath Regions Covered, Global (2 of 2) |
| Figure 20‑3: Introducer Sheath Market, Global, 2020 – 2030 |
| Figure 20‑4: Units Sold by Region, Introducer Sheath Market, Global, 2020 – 2030 |
| Figure 20‑5: Average Selling Price by Region, Introducer Sheath Market, Global, 2020 – 2030 (US$) |
| Figure 20‑6: Market Value by Region, Introducer Sheath Market, Global, 2020 – 2030 (US$M) |
| Figure 20‑7: Leading Competitors, Introducer Sheath Market, Global, 2023 |
| Figure 21‑1: Vascular Closure Device Procedures Covered |
| Figure 21‑2: Vascular Closure Device Markets Covered |
| Figure 21‑3: Vascular Closure Device Regions Covered, Global (1 of 2) |
| Figure 21‑4: Vascular Closure Device Regions Covered, Global (2 of 2) |
| Figure 21‑5: Vascular Closure Device Procedures by Segment, Global, 2020 – 2030 |
| Figure 21‑6: Vascular Closure Device Procedures by Region, Global, 2020 – 2030 |
| Figure 21‑7: Vascular Closure Device Procedures by Country, North America, 2020 – 2030 |
| Figure 21‑8: Vascular Closure Device Procedures by Country, Latin America, 2020 – 2030 (1 of 2) |
| Figure 21‑9: Vascular Closure Device Procedures by Country, Latin America, 2020 – 2030 (2 of 2) |
| Figure 21‑10: Vascular Closure Device Procedures by Country, Western Europe, 2020 – 2030 |
| Figure 21‑11: Vascular Closure Device Procedures by Country, Central & Eastern Europe, 2020 – 2030 (1 of 2) |
| Figure 21‑12: Vascular Closure Device Procedures by Country, Central & Eastern Europe, 2020 – 2030 (2 of 2) |
| Figure 21‑13: Vascular Closure Device Procedures by Country, Middle East, 2020 – 2030 |
| Figure 21‑14: Vascular Closure Device Procedures by Country, Asia-Pacific, 2020 – 2030 (1 of 3) |
| Figure 21‑15: Vascular Closure Device Procedures by Country, Asia-Pacific, 2020 – 2030 (2 of 3) |
| Figure 21‑16: Vascular Closure Device Procedures by Country, Asia-Pacific, 2020 – 2030 (3 of 3) |
| Figure 21‑17: Vascular Closure Device Procedures by Country, Africa, 2020 – 2030 |
| Figure 21‑18: Invasive VCD Procedures by Region, Global, 2020 – 2030 |
| Figure 21‑19: Invasive VCD Procedures by Country, North America, 2020 – 2030 |
| Figure 21‑20: Invasive VCD Procedures by Country, Latin America, 2020 – 2030 (1 of 2) |
| Figure 21‑21: Invasive VCD Procedures by Country, Latin America, 2020 – 2030 (2 of 2) |
| Figure 21‑22: Invasive VCD Procedures by Country, Western Europe, 2020 – 2030 |
| Figure 21‑23: Invasive VCD Procedures by Country, Central & Eastern Europe, 2020 – 2030 (1 of 2) |
| Figure 21‑24: Invasive VCD Procedures by Country, Central & Eastern Europe, 2020 – 2030 (2 of 2) |
| Figure 21‑25: Invasive VCD Procedures by Country, Middle East, 2020 – 2030 |
| Figure 21‑26: Invasive VCD Procedures by Country, Asia-Pacific, 2020 – 2030 (1 of 3) |
| Figure 21‑27: Invasive VCD Procedures by Country, Asia-Pacific, 2020 – 2030 (2 of 3) |
| Figure 21‑28: Invasive VCD Procedures by Country, Asia-Pacific, 2020 – 2030 (3 of 3) |
| Figure 21‑29: Invasive VCD Procedures by Country, Africa, 2020 – 2030 |
| Figure 21‑30: Non-Invasive VCD Procedures by Region, Global, 2020 – 2030 |
| Figure 21‑31: Non-Invasive VCD Procedures by Country, North America, 2020 – 2030 |
| Figure 21‑32: Non-Invasive VCD Procedures by Country, Latin America, 2020 – 2030 (1 of 2) |
| Figure 21‑33: Non-Invasive VCD Procedures by Country, Latin America, 2020 – 2030 (2 of 2) |
| Figure 21‑34: Non-Invasive VCD Procedures by Country, Western Europe, 2020 – 2030 |
| Figure 21‑35: Non-Invasive VCD Procedures by Country, Central & Eastern Europe, 2020 – 2030 (1 of 2) |
| Figure 21‑36: Non-Invasive VCD Procedures by Country, Central & Eastern Europe, 2020 – 2030 (2 of 2) |
| Figure 21‑37: Non-Invasive VCD Procedures by Country, Middle East, 2020 – 2030 |
| Figure 21‑38: Non-Invasive VCD Procedures by Country, Asia-Pacific, 2020 – 2030 (1 of 3) |
| Figure 21‑39: Non-Invasive VCD Procedures by Country, Asia-Pacific, 2020 – 2030 (2 of 3) |
| Figure 21‑40: Non-Invasive VCD Procedures by Country, Asia-Pacific, 2020 – 2030 (3 of 3) |
| Figure 21‑41: Non-Invasive VCD Procedures by Country, Africa, 2020 – 2030 |
| Figure 21‑42: Vascular Closure Device Market by Segment, Global, 2020 – 2030 (US$M) |
| Figure 21‑43: Vascular Closure Device Market by Region, Global, 2020 – 2030 (US$M) |
| Figure 21‑44: Vascular Closure Device Market, Global, 2020 – 2030 |
| Figure 21‑45: Units Sold by Region, Vascular Closure Device Market, Global, 2020 – 2030 |
| Figure 21‑46: Average Selling Price by Region, Vascular Closure Device Market, Global, 2020 – 2030 (US$) |
| Figure 21‑47: Market Value by Region, Vascular Closure Device Market, Global, 2020 – 2030 (US$M) |
| Figure 21‑48: Invasive VCD Market by Segment, Global, 2020 – 2030 (US$M) |
| Figure 21‑49: Total Invasive VCD Market, Global, 2020 – 2030 |
| Figure 21‑50: Units Sold by Region, Invasive VCD Market, Global, 2020 – 2030 |
| Figure 21‑51: Average Selling Price by Region, Invasive VCD Market, Global, 2020 – 2030 (US$) |
| Figure 21‑52: Market Value by Region, Invasive VCD Market, Global, 2020 – 2030 (US$M) |
| Figure 21‑53: Small-Bore Invasive VCD Market, Global, 2020 – 2030 |
| Figure 21‑54: Units Sold by Region, Small-Bore Invasive VCD Market, Global, 2020 – 2030 |
| Figure 21‑55: Average Selling Price by Region, Small-Bore Invasive VCD Market, Global, 2020 – 2030 (US$) |
| Figure 21‑56: Market Value by Region, Small-Bore Invasive VCD Market, Global, 2020 – 2030 (US$M) |
| Figure 21‑57: Large-Bore Invasive VCD Market, Global, 2020 – 2030 |
| Figure 21‑58: Units Sold by Region, Large-Bore Invasive VCD Market, Global, 2020 – 2030 |
| Figure 21‑59: Average Selling Price by Region, Large-Bore Invasive VCD Market, Global, 2020 – 2030 (US$) |
| Figure 21‑60: Market Value by Region, Large-Bore Invasive VCD Market, Global, 2020 – 2030 (US$M) |
| Figure 21‑61: Non-Invasive VCD Market, Global, 2020 – 2030 |
| Figure 21‑62: Units Sold by Region, Non-Invasive VCD Market, Global, 2020 – 2030 |
| Figure 21‑63: Average Selling Price by Region, Non-Invasive VCD Market, Global, 2020 – 2030 (US$) |
| Figure 21‑64: Market Value by Region, Non-Invasive VCD Market, Global, 2020 – 2030 (US$M) |
| Figure 21‑65: Leading Competitors, Vascular Closure Device Market, Global, 2023 |
| Figure 22‑1: Transcatheter Embolization Procedures Covered |
| Figure 22‑2: Transcatheter Embolization Markets Covered |
| Figure 22‑3: Transcatheter Embolization Regions Covered, Global (1 of 2) |
| Figure 22‑4: Transcatheter Embolization Regions Covered, Global (2 of 2) |
| Figure 22‑5: Transcatheter Embolization Procedures by Segment, Global, 2020 – 2030 |
| Figure 22‑6: Transcatheter Embolization Procedures by Region, Global, 2020 – 2030 |
| Figure 22‑7: Transcatheter Embolization Procedures by Country, North America, 2020 – 2030 |
| Figure 22‑8: Transcatheter Embolization Procedures by Country, Latin America, 2020 – 2030 (1 of 2) |
| Figure 22‑9: Transcatheter Embolization Procedures by Country, Latin America, 2020 – 2030 (2 of 2) |
| Figure 22‑10: Transcatheter Embolization Procedures by Country, Western Europe, 2020 – 2030 |
| Figure 22‑11: Transcatheter Embolization Procedures by Country, Central & Eastern Europe, 2020 – 2030 (1 of 2) |
| Figure 22‑12: Transcatheter Embolization Procedures by Country, Central & Eastern Europe, 2020 – 2030 (2 of 2) |
| Figure 22‑13: Transcatheter Embolization Procedures by Country, Middle East, 2020 – 2030 |
| Figure 22‑14: Transcatheter Embolization Procedures by Country, Asia-Pacific, 2020 – 2030 (1 of 3) |
| Figure 22‑15: Transcatheter Embolization Procedures by Country, Asia-Pacific, 2020 – 2030 (2 of 3) |
| Figure 22‑16: Transcatheter Embolization Procedures by Country, Asia-Pacific, 2020 – 2030 (3 of 3) |
| Figure 22‑17: Transcatheter Embolization Procedures by Country, Africa, 2020 – 2030 |
| Figure 22‑18: Particle Embolization Procedures by Region, Global, 2020 – 2030 |
| Figure 22‑19: Particle Embolization Procedures by Country, North America, 2020 – 2030 |
| Figure 22‑20: Particle Embolization Procedures by Country, Latin America, 2020 – 2030 (1 of 2) |
| Figure 22‑21: Particle Embolization Procedures by Country, Latin America, 2020 – 2030 (2 of 2) |
| Figure 22‑22: Particle Embolization Procedures by Country, Western Europe, 2020 – 2030 |
| Figure 22‑23: Particle Embolization Procedures by Country, Central & Eastern Europe, 2020 – 2030 (1 of 2) |
| Figure 22‑24: Particle Embolization Procedures by Country, Central & Eastern Europe, 2020 – 2030 (2 of 2) |
| Figure 22‑25: Particle Embolization Procedures by Country, Middle East, 2020 – 2030 |
| Figure 22‑26: Particle Embolization Procedures by Country, Asia-Pacific, 2020 – 2030 (1 of 3) |
| Figure 22‑27: Particle Embolization Procedures by Country, Asia-Pacific, 2020 – 2030 (2 of 3) |
| Figure 22‑28: Particle Embolization Procedures by Country, Asia-Pacific, 2020 – 2030 (3 of 3) |
| Figure 22‑29: Particle Embolization Procedures by Country, Africa, 2020 – 2030 |
| Figure 22‑30: Coil Embolization Procedures by Region, Global, 2020 – 2030 |
| Figure 22‑31: Coil Embolization Procedures by Country, North America, 2020 – 2030 |
| Figure 22‑32: Coil Embolization Procedures by Country, Latin America, 2020 – 2030 (1 of 2) |
| Figure 22‑33: Coil Embolization Procedures by Country, Latin America, 2020 – 2030 (2 of 2) |
| Figure 22‑34: Coil Embolization Procedures by Country, Western Europe, 2020 – 2030 |
| Figure 22‑35: Coil Embolization Procedures by Country, Central & Eastern Europe, 2020 – 2030 (1 of 2) |
| Figure 22‑36: Coil Embolization Procedures by Country, Central & Eastern Europe, 2020 – 2030 (2 of 2) |
| Figure 22‑37: Coil Embolization Procedures by Country, Middle East, 2020 – 2030 |
| Figure 22‑38: Coil Embolization Procedures by Country, Asia-Pacific, 2020 – 2030 (1 of 3) |
| Figure 22‑39: Coil Embolization Procedures by Country, Asia-Pacific, 2020 – 2030 (2 of 3) |
| Figure 22‑40: Coil Embolization Procedures by Country, Asia-Pacific, 2020 – 2030 (3 of 3) |
| Figure 22‑41: Coil Embolization Procedures by Country, Africa, 2020 – 2030 |
| Figure 22‑42: Transcatheter Embolization Market by Segment, Global, 2020 – 2030 (US$M) |
| Figure 22‑43: Transcatheter Embolization Market by Region, Global, 2020 – 2030 (US$M) |
| Figure 22‑44: Transcatheter Embolization Market, Global, 2020 – 2030 |
| Figure 22‑45: Units Sold by Region, Transcatheter Embolization Market, Global, 2020 – 2030 |
| Figure 22‑46: Average Selling Price by Region, Transcatheter Embolization Market, Global, 2020 – 2030 (US$) |
| Figure 22‑47: Market Value by Region, Transcatheter Embolization Market, Global, 2020 – 2030 (US$M) |
| Figure 22‑48: Particle Embolization Market by Segment, Global, 2020 – 2030 (US$M) |
| Figure 22‑49: Total Particle Embolization Market, Global, 2020 – 2030 |
| Figure 22‑50: Units Sold by Region, Particle Embolization Market, Global, 2020 – 2030 |
| Figure 22‑51: Average Selling Price by Region, Particle Embolization Market, Global, 2020 – 2030 (US$) |
| Figure 22‑52: Market Value by Region, Particle Embolization Market, Global, 2020 – 2030 (US$M) |
| Figure 22‑53: PVA Particle Market, Global, 2020 – 2030 |
| Figure 22‑54: Units Sold by Region, PVA Particle Market, Global, 2020 – 2030 |
| Figure 22‑55: Average Selling Price by Region, PVA Particle Market, Global, 2020 – 2030 (US$) |
| Figure 22‑56: Market Value by Region, PVA Particle Market, Global, 2020 – 2030 (US$M) |
| Figure 22‑57: Microsphere Particle Market, Global, 2020 – 2030 |
| Figure 22‑58: Units Sold by Region, Microsphere Particle Market, Global, 2020 – 2030 |
| Figure 22‑59: Average Selling Price by Region, Microsphere Particle Market, Global, 2020 – 2030 (US$) |
| Figure 22‑60: Market Value by Region, Microsphere Particle Market, Global, 2020 – 2030 (US$M) |
| Figure 22‑61: Drug-Eluting Particle Market, Global, 2020 – 2030 |
| Figure 22‑62: Units Sold by Region, Drug-Eluting Particle Market, Global, 2020 – 2030 |
| Figure 22‑63: Average Selling Price by Region, Drug-Eluting Particle Market, Global, 2020 – 2030 (US$) |
| Figure 22‑64: Market Value by Region, Drug-Eluting Particle Market, Global, 2020 – 2030 (US$M) |
| Figure 22‑65: Radioactive Particle Market, Global, 2020 – 2030 |
| Figure 22‑66: Units Sold by Region, Radioactive Particle Market, Global, 2020 – 2030 |
| Figure 22‑67: Average Selling Price by Region, Radioactive Particle Market, Global, 2020 – 2030 (US$) |
| Figure 22‑68: Market Value by Region, Radioactive Particle Market, Global, 2020 – 2030 (US$M) |
| Figure 22‑69: Coil Embolization Market, Global, 2020 – 2030 |
| Figure 22‑70: Units Sold by Region, Coil Embolization Market, Global, 2020 – 2030 |
| Figure 22‑71: Average Selling Price by Region, Coil Embolization Market, Global, 2020 – 2030 (US$) |
| Figure 22‑72: Market Value by Region, Coil Embolization Market, Global, 2020 – 2030 (US$M) |
| Figure 22‑73: Leading Competitors, Transcatheter Embolization Market, Global, 2023 |
| Figure 23‑1: Peripheral IVUS Procedures Covered |
| Figure 23‑2: Peripheral IVUS Regions Covered, Global (1 of 2) |
| Figure 23‑3: Peripheral IVUS Regions Covered, Global (2 of 2) |
| Figure 23‑4: Peripheral IVUS Procedures by Region, Global, 2020 – 2030 |
| Figure 23‑5: Peripheral IVUS Procedures by Country, North America, 2020 – 2030 |
| Figure 23‑6: Peripheral IVUS Procedures by Country, Latin America, 2020 – 2030 (1 of 2) |
| Figure 23‑7: Peripheral IVUS Procedures by Country, Latin America, 2020 – 2030 (2 of 2) |
| Figure 23‑8: Peripheral IVUS Procedures by Country, Western Europe, 2020 – 2030 |
| Figure 23‑9: Peripheral IVUS Procedures by Country, Central & Eastern Europe, 2020 – 2030 (1 of 2) |
| Figure 23‑10: Peripheral IVUS Procedures by Country, Central & Eastern Europe, 2020 – 2030 (2 of 2) |
| Figure 23‑11: Peripheral IVUS Procedures by Country, Middle East, 2020 – 2030 |
| Figure 23‑12: Peripheral IVUS Procedures by Country, Asia-Pacific, 2020 – 2030 (1 of 3) |
| Figure 23‑13: Peripheral IVUS Procedures by Country, Asia-Pacific, 2020 – 2030 (2 of 3) |
| Figure 23‑14: Peripheral IVUS Procedures by Country, Asia-Pacific, 2020 – 2030 (3 of 3) |
| Figure 23‑15: Peripheral IVUS Procedures by Country, Africa, 2020 – 2030 |
| Figure 23‑16: Peripheral IVUS Market, Global, 2020 – 2030 |
| Figure 23‑17: Units Sold by Region, Peripheral IVUS Market, Global, 2020 – 2030 |
| Figure 23‑18: Average Selling Price by Region, Peripheral IVUS Market, Global, 2020 – 2030 (US$) |
| Figure 23‑19: Market Value by Region, Peripheral IVUS Market, Global, 2020 – 2030 (US$M) |
| Figure 23‑20: Leading Competitors, Peripheral IVUS Market, Global, 2023 |