| Figure 1‑1: Patient Monitoring Equipment Market Share Ranking by Segment, Global, 2024 (1 of 2) |
| Figure 1‑2: Patient Monitoring Equipment Market Share Ranking by Segment, Global, 2024 (2 of 2) |
| Figure 1‑3: Companies Researched in This Report (1 of 2) |
| Figure 1‑4: Companies Researched in This Report (2 of 2) |
| Figure 1‑5: Recent Events in the Patient Monitoring Equipment Market, Global, 2022 – 2024 (1 of 2) |
| Figure 1‑6: Recent Events in the Patient Monitoring Equipment Market, Global, 2022 – 2024 (2 of 2) |
| Figure 1‑7: Factors Impacting the Patient Monitoring Equipment Market by Segment, Global (1 of 2) |
| Figure 1‑8: Factors Impacting the Patient Monitoring Equipment Market by Segment, Global (2 of 2) |
| Figure 1‑9: Patient Monitoring Equipment Procedure Segmentation |
| Figure 1‑10: Patient Monitoring Equipment Market Segmentation (1 of 2) |
| Figure 1‑11: Patient Monitoring Equipment Market Segmentation (2 of 2) |
| Figure 1‑12: Patient Monitoring Equipment Regions Covered, Global (1 of 2) |
| Figure 1‑13: Patient Monitoring Equipment Regions Covered, Global (2 of 2) |
| Figure 1‑14: Key Report Updates |
| Figure 1‑15: Version History |
| Figure 2‑1: Multi-Parameter Vital Signs Monitoring Products by Company |
| Figure 2‑2: Wireless Ambulatory Telemetry Monitoring Products by Company |
| Figure 2‑3: Remote Patient Monitoring Market by Company (1 of 2) |
| Figure 2‑4: Remote Patient Monitoring Market by Company (2 of 2) |
| Figure 2‑5: Electromyogram Monitoring Products by Company (1 of 2) |
| Figure 2‑6: Electromyogram Monitoring Products by Company (2 of 2) |
| Figure 2‑7: Electroencephalogram Monitoring (EEG) Products by Company (1 of 2) |
| Figure 2‑8: Electroencephalogram Monitoring (EEG) Products by Company (2 of 2) |
| Figure 2‑9: Fetal and Neonatal Monitoring Products by Company |
| Figure 2‑10: Pulse Oximetry Monitoring Products by Company |
| Figure 2‑11: Cardiac Output Monitoring Products by Company |
| Figure 2‑12: Blood Pressure Monitoring Products by Company (1 of 3) |
| Figure 2‑13: Blood Pressure Monitoring Products by Company (2 of 3) |
| Figure 2‑14: Blood Pressure Monitoring Products by Company (3 of 3) |
| Figure 2‑15: Electrocardiogram Monitoring Products by Company |
| Figure 2‑16: Electrocardiogram Monitoring Products by Company |
| Figure 2‑17: Temperature Management Market by Company (1 of 2) |
| Figure 2‑18: Temperature Management Market by Company (2 of 2) |
| Figure 2‑19: Class 2 Device Recall EarlyVue VS30 Vitals Monitor |
| Figure 2‑20: Class 2 Device Recall Welch Allyn Connex Spot Monitor |
| Figure 2‑21: Class 2 Device Recall Philips EARLYVUE VS30 VITAL SIGNS MONITOR |
| Figure 2‑22: Class 2 Device Recall Mindray BeneVision Distributed Monitoring System (DMS) |
| Figure 2‑23: Class 2 Device Recall CARESCAPE ONE |
| Figure 2‑24: Class 2 Device Recall Spacelabs Healthcare Xhibit Central Station (96102) |
| Figure 2‑25: Class 2 Device Recall DIRECT SUPPLY Attendant VITAL SIGNS MONITOR |
| Figure 2‑26: Class 2 Device Recall Expression MR400 MRI Patient Monitoring System |
| Figure 2‑27: Class 2 Device Recall Rosebud Vital Signs Monitor |
| Figure 2‑28: Class 2 Device Recall SureSigns VS3 NBP |
| Figure 2‑29: Class 2 Device Recall Xhibit Telemetry Receiver, Model: 96280 |
| Figure 2‑30: Class 2 Device Recall Drager Infinity CentralStation |
| Figure 2‑31: Class 2 Device Recall WMTS Telemetry Receiver, Multiple Patient Receiver |
| Figure 2‑32: Class 2 Device Recall Infinity M300 |
| Figure 2‑33: Class 2 Device Recall ApexPro Telemetry System |
| Figure 2‑34: Class 2 Device Recall ApexPro Telemetry Server System |
| Figure 2‑35: Class 2 Device Recall IntelliVue MX40 Patient Monitor |
| Figure 2‑36: Class 2 Device Recall Spacelabs Healthcare Xhibit Telemetry Receiver, Model 96280, software version 1.1 |
| Figure 2‑37: Class 2 Device Recall Boston Scientific Emblem |
| Figure 2‑38: Class 2 Device Recall CardioMEMS |
| Figure 2‑39: Class 2 Device Recall LATITUDE" NXT Remote Patient Management System |
| Figure 2‑40: Class 2 Device Recall EMBLEM SICD |
| Figure 2‑41: Class 2 Device Recall CareLink SmartSync Device Manager |
| Figure 2‑42: Class 1 Device Recall Assurity Pacemakers |
| Figure 2‑43: Class 1 Device Recall St. Jude Endurity Pacemakers |
| Figure 2‑44: Class 2 Device Recall EMBLEM |
| Figure 2‑45: Class 2 Device Recall EMBLEM |
| Figure 2‑46: Class 2 Device Recall LATITUDE |
| Figure 2‑47: Class 2 Device Recall LATITUDE Programming System |
| Figure 2‑48: Class 2 Device Recall CareLink 2090 Programmer System |
| Figure 2‑49: Class 2 Device Recall CADWELL |
| Figure 2‑50: Class 2 Device Recall Ultraview SL (UVSL) Command Module |
| Figure 2‑51: Class 2 Device Recall CARESCAPE ONE |
| Figure 2‑52: Class 2 Device Recall IntelliVue MX800 |
| Figure 2‑53: Class 2 Device Recall IntelliVue MX800 |
| Figure 2‑54: Class 2 Device Recall CARESCAPE Patient Data Module |
| Figure 2‑55: Class 2 Device Recall Pacific Medical GE Corometrics Nautilus Toco Transducer |
| Figure 2‑56: Class 2 Device Recall |
| Figure 2‑57: Class 3 Device Recall Starling |
| Figure 2‑58: Class 2 Device Recall Cogent Hemodynamic Monitoring System |
| Figure 2‑59: Class 2 Device Recall Cogent Hemodynamic Monitoring System |
| Figure 2‑60: Class 2 Device Recall Cogent" Hemodynamic Monitoring System |
| Figure 2‑61: Class 2 Device Recall Cogent" Hemodynamic Monitoring System |
| Figure 2‑62: Class 2 Device Recall PulsioFlex Monitor |
| Figure 2‑63: Class 1 Device Recall EV1000 Clinical Platform |
| Figure 2‑64: Class 2 Device Recall ProBP 3400 Digital Blood Pressure Device |
| Figure 2‑65: Class 2 Device Recall Ambulatory Blood Pressure Monitor |
| Figure 2‑66: Class 2 Device Recall Blood Pressure Cuffs Disposable, Neonate |
| Figure 2‑67: Class 2 Device Recall Baxter Epiphany |
| Figure 2‑68: Class 2 Device Recall Draeger Infinity M300 |
| Figure 2‑69: Class 2 Device Recall 3M Red Dot |
| Figure 2‑70: Class 2 Device Recall ELI, Burdick and McKesson brand 280 Resting Electrocardiographs |
| Figure 2‑71: Class 2 Device Recall MAC VU360, Electrocardiograph |
| Figure 2‑72: Class 2 Device Recall Novaplus |
| Figure 2‑73: Class 2 Device Recall ELI 10, ELI 350, ELI 150c, ELI 250c, ELI 230, ELI 280, |
| Figure 2‑74: Class 1 Device Recall NORMOFLO |
| Figure 2‑75: Class 2 Device Recall CritiCool |
| Figure 2‑76: Class 2 Device Recall NormOTemp Hyperthermia System |
| Figure 2‑77: Class 2 Device Recall Blanketrol II Model 233 HyperHypothermia System and CoolBlue Model 2501 HyperHypothermia System |
| Figure 2‑78: Class 2 Device Recall Blanketrol II HyperHypothermia System, 222S |
| Figure 2‑79: Image-based Remote Monitoring in Cardiac Surgery Patients (FORSEE-3) |
| Figure 2‑80: Validation of a Vital Signs Monitoring Wristband (MULTI-VITAL) |
| Figure 2‑81: A Single Center Study to Demonstrate the Safety and Performance of Lifelight® First Software Application |
| Figure 2‑82: The COSMOS Trial. A Pilot Study A Pilot Study |
| Figure 2‑83: NIBP Validation Study |
| Figure 2‑84: Dexcom CGM in Long-term Care |
| Figure 2‑85: Detection of Atrial Fibrillation after Cardiac Surgery |
| Figure 2‑86: Feasibility and Success Trial of Remote Patient Monitoring in Heart Failure |
| Figure 2‑87: FreeStyle Libre 2 Discharge Trial |
| Figure 2‑88: Enhanced Pulmonary Rehabilitation with Digital Remote Home Monitoring |
| Figure 2‑89: Remote Monitoring of Multiple Indicators of Heart Failure |
| Figure 2‑90: Impact of the CareLink Express Remote Monitoring System on Early Detection of Atrial Fibrillation |
| Figure 2‑91: Remote Patient Monitoring in Pediatric Obesity |
| Figure 2‑92: A Pilot Study of Hypertension Management Using Remote Patient Monitoring |
| Figure 2‑93: Informative of Surface Electromyography and Prognostic Factors in Assessing the Recovery of Balance and Gait after Stroke |
| Figure 2‑94: Association of Perioperative Electroencephalography Spectral Analysis with Postoperative Complications |
| Figure 2‑95: 48-Hour Ambulatory EEG Monitoring in Early Onset Alzheimer's Disease |
| Figure 2‑96: Bispectral-Electroencephalography (EEG) in First Time Hemodialysis |
| Figure 2‑97: Wearable Sensor for Responsive DBS for ET |
| Figure 2‑98: Continuous Vital Sign Monitoring in Newborns |
| Figure 2‑99: Continuous Glucose Monitoring in At-Risk Newborns |
| Figure 2‑100: Preliminary Study to the Conception of a Non-invasive Neonatal Monitoring System with Development of a Database |
| Figure 2‑101: Transcutaneous Carbon Dioxide Monitoring in Neonates Receiving Therapeutic Hypothermia for Neonatal Encephalopathy |
| Figure 2‑102: U-TruSignal SpO2 Testing in Neonates |
| Figure 2‑103: Pulse Oximetry Accuracy by Skin Color |
| Figure 2‑104: Neonatal Pulse Oximetry Disparities due to Skin Pigmentation |
| Figure 2‑105: Philps FAST2022 picoSAT Pulse Oximetry Desaturation Study |
| Figure 2‑106: Oxygen Saturation Measurement with Pulse Oximetry and with Smart Phones and Smart Wearable |
| Figure 2‑107: SpO2 Accuracy Validation of the OxySoft Sensor via Reference CO-Oximetry Motion Study |
| Figure 2‑108: Home Pulse Oximeter Use in Patients with COVID-19 |
| Figure 2‑109: Feasibility and Performance Evaluation of INVSENSOR00024 |
| Figure 2‑110: BiOSENCY BORA Band SpO2 Validation Study |
| Figure 2‑111: Feasibility and Performance Evaluation for INVSENSOR00024 |
| Figure 2‑112: Validation of CardioQ Versus PiCCO in Children |
| Figure 2‑113: Pediatric Cardiac Output Monitoring Observational Study (POGO) |
| Figure 2‑114: Association between the Use of Pulmonary Artery Catheter and Clinical Outcomes after Liver Transplantation |
| Figure 2‑115: Non-invasive Continuous Cardiac Output Monitoring in Preterm Infants Study |
| Figure 2‑116: ClearSight System CHN Study |
| Figure 2‑117: Team-Based Home Blood Pressure Monitoring |
| Figure 2‑118: Comparison of Non-invasive and Invasive Blood Pressure Monitors |
| Figure 2‑119: App-Based Remote Blood Pressure Monitoring |
| Figure 2‑120: A Study of Continuous Blood Pressure Monitoring in Healthy Participants |
| Figure 2‑121: Noninvasive Continuous Blood Pressure Monitoring for Cesarean Delivery |
| Figure 2‑122: A Pilot Study of Hypertension Management Using Remote Patient Monitoring |
| Figure 2‑123: Validation of Wrist Type Oscillometric Blood Pressure Monitorings |
| Figure 2‑124: Hypertension Control and Remote Blood Pressure Monitoring |
| Figure 2‑125: Validation of Noninvasive Blood Pressure Device |
| Figure 2‑126: Clinical Validation of the Electrocardiogram Measurement |
| Figure 2‑127: The Value of Wearable Electrocardiogram in the Diagnosis of Coronary Artery Disease |
| Figure 2‑128: Electrocardiogram Clinical Validation Study |
| Figure 2‑129: Heated Humidification System Breathing Circuit for Maintenance of Body Temperature in Pediatric Patients |
| Figure 2‑130: Determination of Core Body Temperature in Parturient Warmed with Upper or Underbody Forced Air Cover (Bair Hugger) |
| Figure 2‑131: The Effect of Intraoperative Forced Air Warmer Use, on Postoperative Nausea and Vomiting |
| Figure 2‑132: Efficacy of Blanketrol III and Arctic Sun in Cooling Non-shivering Humans |
| Figure 2‑133: Comparison of Electric Heating Pad Versus Forced-Air Warming to Prevent Inadvertent Perioperative Hypothermia |
| Figure 2‑134: Two Warming Methods in Knee Arthroplasty |
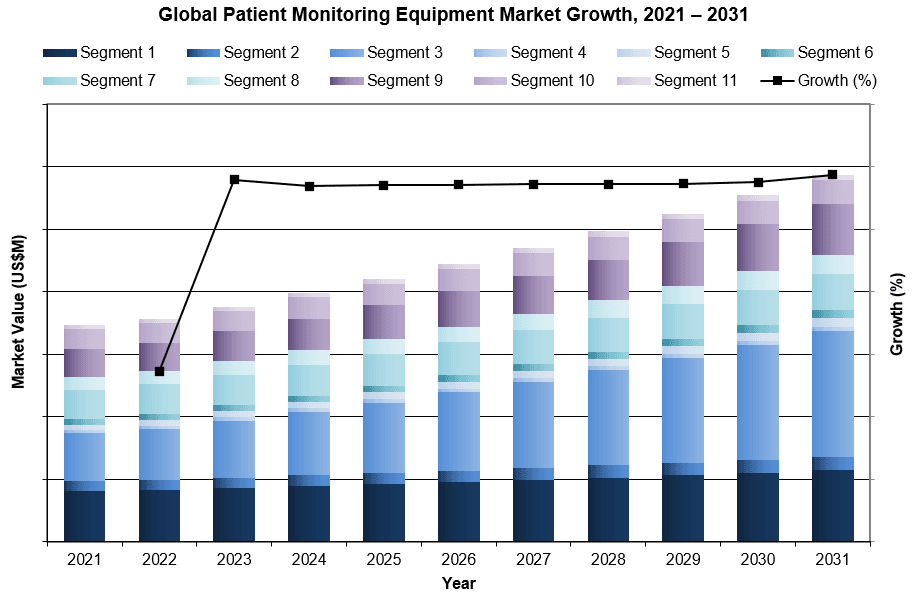
| Figure 3‑1: Patient Monitoring Equipment Market by Segment, Global, 2021 – 2031 (US$M) (1 of 2) |
| Figure 3‑2: Patient Monitoring Equipment Market by Segment, Global, 2021 – 2031 (US$M) (2 of 2) |
| Figure 3‑3: Patient Monitoring Equipment Market by Region, Global, 2021 – 2031 (US$M) |
| Figure 3‑4: Leading Competitors, Patient Monitoring Equipment Market by Segment, Global, 2024 (1 of 3) |
| Figure 3‑5: Leading Competitors, Patient Monitoring Equipment Market by Segment, Global, 2024 (2 of 3) |
| Figure 3‑6: Leading Competitors, Patient Monitoring Equipment Market by Segment, Global, 2024 (3 of 3) |
| Figure 3‑7: SWOT Analysis, Baxter |
| Figure 3‑8: SWOT Analysis, Becton Dickinson |
| Figure 3‑9: SWOT Analysis, Edwards Lifesciences |
| Figure 3‑10: SWOT Analysis, GE HealthCare |
| Figure 3‑11: SWOT Analysis, Honeywell Life Sciences |
| Figure 3‑12: SWOT Analysis, Masimo |
| Figure 3‑13: SWOT Analysis, Medtronic |
| Figure 3‑14: SWOT Analysis, Natus Medical |
| Figure 3‑15: SWOT Analysis, Nihon Kohden |
| Figure 3‑16: SWOT Analysis, Philips Healthcare |
| Figure 4‑1: Multi-Parameter Vital Signs Monitoring Market Segmentation |
| Figure 4‑2: Multi-Parameter Vital Signs Monitoring Regions Covered, Global (1 of 2) |
| Figure 4‑3: Multi-Parameter Vital Signs Monitoring Regions Covered, Global (2 of 2) |
| Figure 4‑4: Multi-Parameter Vital Signs Monitoring Market by Segment, Global, 2021 – 2031 (US$M) |
| Figure 4‑5: Multi-Parameter Vital Signs Monitoring Market by Region, Global, 2021 – 2031 (US$M) |
| Figure 4‑6: High-Acuity Monitor Market, Global, 2021 – 2031 |
| Figure 4‑7: Units Sold by Region, High-Acuity Monitor Market, Global, 2021 – 2031 |
| Figure 4‑8: Average Selling Price by Region, High-Acuity Monitor Market, Global, 2021 – 2031 (US$) |
| Figure 4‑9: Market Value by Region, High-Acuity Monitor Market, Global, 2021 – 2031 (US$M) |
| Figure 4‑10: Mid-Acuity Monitor Market, Global, 2021 – 2031 |
| Figure 4‑11: Units Sold by Region, Mid-Acuity Monitor Market, Global, 2021 – 2031 |
| Figure 4‑12: Average Selling Price by Region, Mid-Acuity Monitor Market, Global, 2021 – 2031 (US$) |
| Figure 4‑13: Market Value by Region, Mid-Acuity Monitor Market, Global, 2021 – 2031 (US$M) |
| Figure 4‑14: Low-Acuity Monitor Market by Segment, Global, 2021 – 2031 (US$M) |
| Figure 4‑15: Total Low-Acuity Monitor Market, Global, 2021 – 2031 |
| Figure 4‑16: Units Sold by Region, Low-Acuity Monitor Market, Global, 2021 – 2031 |
| Figure 4‑17: Average Selling Price by Region, Low-Acuity Monitor Market, Global, 2021 – 2031 (US$) |
| Figure 4‑18: Market Value by Region, Low-Acuity Monitor Market, Global, 2021 – 2031 (US$M) |
| Figure 4‑19: Low-Acuity Bedside Monitor Market, Global, 2021 – 2031 |
| Figure 4‑20: Units Sold by Region, Low-Acuity Bedside Monitor Market, Global, 2021 – 2031 |
| Figure 4‑21: Average Selling Price by Region, Low-Acuity Bedside Monitor Market, Global, 2021 – 2031 (US$) |
| Figure 4‑22: Market Value by Region, Low-Acuity Bedside Monitor Market, Global, 2021 – 2031 (US$M) |
| Figure 4‑23: Spot-Check Monitor Market, Global, 2021 – 2031 |
| Figure 4‑24: Units Sold by Region, Spot-Check Monitor Market, Global, 2021 – 2031 |
| Figure 4‑25: Average Selling Price by Region, Spot-Check Monitor Market, Global, 2021 – 2031 (US$) |
| Figure 4‑26: Market Value by Region, Spot-Check Monitor Market, Global, 2021 – 2031 (US$M) |
| Figure 4‑27: Central Station Monitor Market, Global, 2021 – 2031 |
| Figure 4‑28: Units Sold by Region, Central Station Monitor Market, Global, 2021 – 2031 |
| Figure 4‑29: Average Selling Price by Region, Central Station Monitor Market, Global, 2021 – 2031 (US$) |
| Figure 4‑30: Market Value by Region, Central Station Monitor Market, Global, 2021 – 2031 (US$M) |
| Figure 4‑31: Leading Competitors, Multi-Parameter Vital Signs Monitoring Market, Global, 2024 |
| Figure 5‑1: Wireless Ambulatory Telemetry Monitoring Market Segmentation |
| Figure 5‑2: Wireless Ambulatory Telemetry Monitoring Regions Covered, Global (1 of 2) |
| Figure 5‑3: Wireless Ambulatory Telemetry Monitoring Regions Covered, Global (2 of 2) |
| Figure 5‑4: Wireless Ambulatory Telemetry Monitoring Market by Segment, Global, 2021 – 2031 (US$M) |
| Figure 5‑5: Wireless Ambulatory Telemetry Monitoring Market by Region, Global, 2021 – 2031 (US$M) |
| Figure 5‑6: Market Value by Region, Wireless Ambulatory Telemetry Monitoring Market, Global, 2021 – 2031 (US$M) |
| Figure 5‑7: Patient-Worn Monitoring Market, Global, 2021 – 2031 |
| Figure 5‑8: Units Sold by Region, Patient-Worn Monitoring Market, Global, 2021 – 2031 |
| Figure 5‑9: Average Selling Price by Region, Patient-Worn Monitoring Market, Global, 2021 – 2031 (US$) |
| Figure 5‑10: Market Value by Region, Patient-Worn Monitoring Market, Global, 2021 – 2031 (US$M) |
| Figure 5‑11: Central Station Monitor Market, Global, 2021 – 2031 |
| Figure 5‑12: Units Sold by Region, Central Station Monitor Market, Global, 2021 – 2031 |
| Figure 5‑13: Average Selling Price by Region, Central Station Monitor Market, Global, 2021 – 2031 (US$) |
| Figure 5‑14: Market Value by Region, Central Station Monitor Market, Global, 2021 – 2031 (US$M) |
| Figure 5‑15: Leading Competitors, Wireless Ambulatory Telemetry Monitoring Market, Global, 2024 |
| Figure 6‑1: Remote Patient Monitoring Market Segmentation |
| Figure 6‑2: Remote Patient Monitoring Regions Covered, Global (1 of 2) |
| Figure 6‑3: Remote Patient Monitoring Regions Covered, Global (2 of 2) |
| Figure 6‑4: Remote Patient Monitoring Market by Segment, Global, 2021 – 2031 (US$M) |
| Figure 6‑5: Remote Patient Monitoring Market by Region, Global, 2021 – 2031 (US$M) |
| Figure 6‑6: Remote Patient Monitoring Market, Global, 2021 – 2031 |
| Figure 6‑7: Units Sold by Region, Remote Patient Monitoring Market, Global, 2021 – 2031 |
| Figure 6‑8: Average Selling Price by Region, Remote Patient Monitoring Market, Global, 2021 – 2031 (US$) |
| Figure 6‑9: Market Value by Region, Remote Patient Monitoring Market, Global, 2021 – 2031 (US$M) |
| Figure 6‑10: Total Disease Conditions Management Market, Global, 2021 – 2031 |
| Figure 6‑11: Units Sold by Region, Disease Conditions Management Market, Global, 2021 – 2031 |
| Figure 6‑12: Average Selling Price by Region, Disease Conditions Management Market, Global, 2021 – 2031 (US$) |
| Figure 6‑13: Market Value by Region, Disease Conditions Management Market, Global, 2021 – 2031 (US$M) |
| Figure 6‑14: Cardiac Implantable Electronic Device Market, Global, 2021 – 2031 |
| Figure 6‑15: Units Sold by Region, Cardiac Implantable Electronic Device Market, Global, 2021 – 2031 |
| Figure 6‑16: Average Selling Price by Region, Cardiac Implantable Electronic Device Market, Global, 2021 – 2031 (US$) |
| Figure 6‑17: Market Value by Region, Cardiac Implantable Electronic Device Market, Global, 2021 – 2031 (US$M) |
| Figure 6‑18: Leading Competitors, Remote Patient Monitoring Market, Global, 2024 |
| Figure 7‑1: Electromyogram Monitoring Market Segmentation |
| Figure 7‑2: Electromyogram Monitoring Regions Covered, Global (1 of 2) |
| Figure 7‑3: Electromyogram Monitoring Regions Covered, Global (2 of 2) |
| Figure 7‑4: Electromyogram Procedures by Region, Global, 2021 – 2031 |
| Figure 7‑5: Electromyogram Monitoring Market by Segment, Global, 2021 – 2031 (US$M) |
| Figure 7‑6: Electromyogram Monitoring Market by Region, Global, 2021 – 2031 (US$M) |
| Figure 7‑7: Electromyogram Monitor Market, Global, 2021 – 2031 |
| Figure 7‑8: Units Sold by Region, Electromyogram Monitor Market, Global, 2021 – 2031 |
| Figure 7‑9: Average Selling Price by Region, Electromyogram Monitor Market, Global, 2021 – 2031 (US$) |
| Figure 7‑10: Market Value by Region, Electromyogram Monitor Market, Global, 2021 – 2031 (US$M) |
| Figure 7‑11: Electromyogram Consumables Market by Segment, Global, 2021 – 2031 (US$M) |
| Figure 7‑12: Total Electromyogram Consumables Market, Global, 2021 – 2031 |
| Figure 7‑13: Units Sold by Region, Electromyogram Consumables Market, Global, 2021 – 2031 |
| Figure 7‑14: Average Selling Price by Region, Electromyogram Consumables Market, Global, 2021 – 2031 (US$) |
| Figure 7‑15: Market Value by Region, Electromyogram Consumables Market, Global, 2021 – 2031 (US$M) |
| Figure 7‑16: Electromyogram Concentric Needle Market, Global, 2021 – 2031 |
| Figure 7‑17: Units Sold by Region, Electromyogram Concentric Needle Market, Global, 2021 – 2031 |
| Figure 7‑18: Average Selling Price by Region, Electromyogram Concentric Needle Market, Global, 2021 – 2031 (US$) |
| Figure 7‑19: Market Value by Region, Electromyogram Concentric Needle Market, Global, 2021 – 2031 (US$M) |
| Figure 7‑20: Electromyogram Monopolar Needle Market, Global, 2021 – 2031 |
| Figure 7‑21: Units Sold by Region, Electromyogram Monopolar Needle Market, Global, 2021 – 2031 |
| Figure 7‑22: Average Selling Price by Region, Electromyogram Monopolar Needle Market, Global, 2021 – 2031 (US$) |
| Figure 7‑23: Market Value by Region, Electromyogram Monopolar Needle Market, Global, 2021 – 2031 (US$M) |
| Figure 7‑24: Electromyogram Surface Electrode Market, Global, 2021 – 2031 |
| Figure 7‑25: Units Sold by Region, Electromyogram Surface Electrode Market, Global, 2021 – 2031 |
| Figure 7‑26: Average Selling Price by Region, Electromyogram Surface Electrode Market, Global, 2021 – 2031 (US$) |
| Figure 7‑27: Market Value by Region, Electromyogram Surface Electrode Market, Global, 2021 – 2031 (US$M) |
| Figure 7‑28: Leading Competitors, Electromyogram Monitoring Market, Global, 2024 |
| Figure 8‑1: Electroencephalogram Monitoring Market Segmentation |
| Figure 8‑2: Electroencephalogram Monitoring Regions Covered, Global (1 of 2) |
| Figure 8‑3: Electroencephalogram Monitoring Regions Covered, Global (2 of 2) |
| Figure 8‑4: EEG Wave Indicators of Physiological State |
| Figure 8‑5: Electroencephalogram Procedures by Region, Global, 2021 – 2031 |
| Figure 8‑6: Electroencephalogram Monitoring Market by Segment, Global, 2021 – 2031 (US$M) |
| Figure 8‑7: Electroencephalogram Monitoring Market by Region, Global, 2021 – 2031 (US$M) |
| Figure 8‑8: EEG Monitor Market by Segment, Global, 2021 – 2031 (US$M) |
| Figure 8‑9: Total EEG Monitor Market, Global, 2021 – 2031 |
| Figure 8‑10: Units Sold by Region, EEG Monitor Market, Global, 2021 – 2031 |
| Figure 8‑11: Average Selling Price by Region, EEG Monitor Market, Global, 2021 – 2031 (US$) |
| Figure 8‑12: Market Value by Region, EEG Monitor Market, Global, 2021 – 2031 (US$M) |
| Figure 8‑13: Total Clinical EEG Monitor Market, Global, 2021 – 2031 |
| Figure 8‑14: Units Sold by Region, Clinical EEG Monitor Market, Global, 2021 – 2031 |
| Figure 8‑15: Average Selling Price by Region, Clinical EEG Monitor Market, Global, 2021 – 2031 (US$) |
| Figure 8‑16: Market Value by Region, Clinical EEG Monitor Market, Global, 2021 – 2031 (US$M) |
| Figure 8‑17: Long-Term EEG Monitor Market, Global, 2021 – 2031 |
| Figure 8‑18: Units Sold by Region, Long-Term EEG Monitor Market, Global, 2021 – 2031 |
| Figure 8‑19: Average Selling Price by Region, Long-Term EEG Monitor Market, Global, 2021 – 2031 (US$) |
| Figure 8‑20: Market Value by Region, Long-Term EEG Monitor Market, Global, 2021 – 2031 (US$M) |
| Figure 8‑21: ICU EEG Monitor Market, Global, 2021 – 2031 |
| Figure 8‑22: Units Sold by Region, ICU EEG Monitor Market, Global, 2021 – 2031 |
| Figure 8‑23: Average Selling Price by Region, ICU EEG Monitor Market, Global, 2021 – 2031 (US$) |
| Figure 8‑24: Market Value by Region, ICU EEG Monitor Market, Global, 2021 – 2031 (US$M) |
| Figure 8‑25: Electroencephalogram Electrode Market by Segment, Global, 2021 – 2031 (US$M) |
| Figure 8‑26: Total Electroencephalogram Electrode Market, Global, 2021 – 2031 |
| Figure 8‑27: Units Sold by Region, Electroencephalogram Electrode Market, Global, 2021 – 2031 |
| Figure 8‑28: Average Selling Price by Region, Electroencephalogram Electrode Market, Global, 2021 – 2031 (US$) |
| Figure 8‑29: Market Value by Region, Electroencephalogram Electrode Market, Global, 2021 – 2031 (US$M) |
| Figure 8‑30: Disposable EEG Electrode Market, Global, 2021 – 2031 |
| Figure 8‑31: Units Sold by Region, Disposable EEG Electrode Market, Global, 2021 – 2031 |
| Figure 8‑32: Average Selling Price by Region, Disposable EEG Electrode Market, Global, 2021 – 2031 (US$) |
| Figure 8‑33: Market Value by Region, Disposable EEG Electrode Market, Global, 2021 – 2031 (US$M) |
| Figure 8‑34: Reusable EEG Electrode Market, Global, 2021 – 2031 |
| Figure 8‑35: Units Sold by Region, Reusable EEG Electrode Market, Global, 2021 – 2031 |
| Figure 8‑36: Average Selling Price by Region, Reusable EEG Electrode Market, Global, 2021 – 2031 (US$) |
| Figure 8‑37: Market Value by Region, Reusable EEG Electrode Market, Global, 2021 – 2031 (US$M) |
| Figure 8‑38: Leading Competitors, Electroencephalogram Monitoring Market, Global, 2024 |
| Figure 9‑1: Fetal and Neonatal Monitoring Market Segmentation |
| Figure 9‑2: Fetal and Neonatal Monitoring Regions Covered, Global (1 of 2) |
| Figure 9‑3: Fetal and Neonatal Monitoring Regions Covered, Global (2 of 2) |
| Figure 9‑4: Fetal and Neonatal Monitoring Market by Segment, Global, 2021 – 2031 (US$M) |
| Figure 9‑5: Fetal and Neonatal Monitoring Market by Region, Global, 2021 – 2031 (US$M) |
| Figure 9‑6: Fetal and Neonatal Monitoring Market, Global, 2021 – 2031 |
| Figure 9‑7: Units Sold by Region, Fetal and Neonatal Monitoring Market, Global, 2021 – 2031 |
| Figure 9‑8: Average Selling Price by Region, Fetal and Neonatal Monitoring Market, Global, 2021 – 2031 (US$) |
| Figure 9‑9: Market Value by Region, Fetal and Neonatal Monitoring Market, Global, 2021 – 2031 (US$M) |
| Figure 9‑10: Total Fetal Monitor Market, Global, 2021 – 2031 |
| Figure 9‑11: Units Sold by Region, Fetal Monitor Market, Global, 2021 – 2031 |
| Figure 9‑12: Average Selling Price by Region, Fetal Monitor Market, Global, 2021 – 2031 (US$) |
| Figure 9‑13: Market Value by Region, Fetal Monitor Market, Global, 2021 – 2031 (US$M) |
| Figure 9‑14: Neonatal Monitor Market, Global, 2021 – 2031 |
| Figure 9‑15: Units Sold by Region, Neonatal Monitor Market, Global, 2021 – 2031 |
| Figure 9‑16: Average Selling Price by Region, Neonatal Monitor Market, Global, 2021 – 2031 (US$) |
| Figure 9‑17: Market Value by Region, Neonatal Monitor Market, Global, 2021 – 2031 (US$M) |
| Figure 9‑18: Leading Competitors, Fetal and Neonatal Monitoring Market, Global, 2024 |
| Figure 10‑1: Pulse Oximetry Monitoring Market Segmentation |
| Figure 10‑2: Pulse Oximetry Monitoring Regions Covered, Global (1 of 2) |
| Figure 10‑3: Pulse Oximetry Monitoring Regions Covered, Global (2 of 2) |
| Figure 10‑4: Pulse Oximetry Monitoring Market by Segment, Global, 2021 – 2031 (US$M) |
| Figure 10‑5: Pulse Oximetry Monitoring Market by Region, Global, 2021 – 2031 (US$M) |
| Figure 10‑6: Pulse Oximetry Monitor Market by Segment, Global, 2021 – 2031 (US$M) |
| Figure 10‑7: Total Pulse Oximetry Monitor Market, Global, 2021 – 2031 |
| Figure 10‑8: Units Sold by Region, Pulse Oximetry Monitor Market, Global, 2021 – 2031 |
| Figure 10‑9: Average Selling Price by Region, Pulse Oximetry Monitor Market, Global, 2021 – 2031 (US$) |
| Figure 10‑10: Market Value by Region, Pulse Oximetry Monitor Market, Global, 2021 – 2031 (US$M) |
| Figure 10‑11: Bedside Monitor Market, Global, 2021 – 2031 |
| Figure 10‑12: Units Sold by Region, Bedside Monitor Market, Global, 2021 – 2031 |
| Figure 10‑13: Average Selling Price by Region, Bedside Monitor Market, Global, 2021 – 2031 (US$) |
| Figure 10‑14: Market Value by Region, Bedside Monitor Market, Global, 2021 – 2031 (US$M) |
| Figure 10‑15: Handheld Monitor Market, Global, 2021 – 2031 |
| Figure 10‑16: Units Sold by Region, Handheld Monitor Market, Global, 2021 – 2031 |
| Figure 10‑17: Average Selling Price by Region, Handheld Monitor Market, Global, 2021 – 2031 (US$) |
| Figure 10‑18: Market Value by Region, Handheld Monitor Market, Global, 2021 – 2031 (US$M) |
| Figure 10‑19: Fingertip Monitor Market, Global, 2021 – 2031 |
| Figure 10‑20: Units Sold by Region, Fingertip Monitor Market, Global, 2021 – 2031 |
| Figure 10‑21: Average Selling Price by Region, Fingertip Monitor Market, Global, 2021 – 2031 (US$) |
| Figure 10‑22: Market Value by Region, Fingertip Monitor Market, Global, 2021 – 2031 (US$M) |
| Figure 10‑23: Pulse Oximetry Sensor Market by Segment, Global, 2021 – 2031 (US$M) |
| Figure 10‑24: Total Pulse Oximetry Sensor Market, Global, 2021 – 2031 |
| Figure 10‑25: Units Sold by Region, Pulse Oximetry Sensor Market, Global, 2021 – 2031 |
| Figure 10‑26: Average Selling Price by Region, Pulse Oximetry Sensor Market, Global, 2021 – 2031 (US$) |
| Figure 10‑27: Market Value by Region, Pulse Oximetry Sensor Market, Global, 2021 – 2031 (US$M) |
| Figure 10‑28: Disposable Pulse Oximetry Sensor Market, Global, 2021 – 2031 |
| Figure 10‑29: Units Sold by Region, Disposable Pulse Oximetry Sensor Market, Global, 2021 – 2031 |
| Figure 10‑30: Average Selling Price by Region, Disposable Pulse Oximetry Sensor Market, Global, 2021 – 2031 (US$) |
| Figure 10‑31: Market Value by Region, Disposable Pulse Oximetry Sensor Market, Global, 2021 – 2031 (US$M) |
| Figure 10‑32: Reusable Pulse Oximetry Sensor Market, Global, 2021 – 2031 |
| Figure 10‑33: Units Sold by Region, Reusable Pulse Oximetry Sensor Market, Global, 2021 – 2031 |
| Figure 10‑34: Average Selling Price by Region, Reusable Pulse Oximetry Sensor Market, Global, 2021 – 2031 (US$) |
| Figure 10‑35: Market Value by Region, Reusable Pulse Oximetry Sensor Market, Global, 2021 – 2031 (US$M) |
| Figure 10‑36: OEM Circuit Board Market, Global, 2021 – 2031 |
| Figure 10‑37: Units Sold by Region, OEM Circuit Board Market, Global, 2021 – 2031 |
| Figure 10‑38: Average Selling Price by Region, OEM Circuit Board Market, Global, 2021 – 2031 (US$) |
| Figure 10‑39: Market Value by Region, OEM Circuit Board Market, Global, 2021 – 2031 (US$M) |
| Figure 10‑40: Leading Competitors, Pulse Oximetry Monitoring Market, Global, 2024 |
| Figure 11‑1: Cardiac Output Monitor Market Segmentation |
| Figure 11‑2: Cardiac Output Monitor Regions Covered, Global (1 of 2) |
| Figure 11‑3: Cardiac Output Monitor Regions Covered, Global (2 of 2) |
| Figure 11‑4: Cardiac Output Monitoring Market by Segment, Global, 2021 – 2031 (US$M) |
| Figure 11‑5: Cardiac Output Monitor Market by Region, Global, 2021 – 2031 (US$M) |
| Figure 11‑6: Cardiac Output Monitor Market, Global, 2021 – 2031 |
| Figure 11‑7: Units Sold by Region, Cardiac Output Monitor Market, Global, 2021 – 2031 |
| Figure 11‑8: Average Selling Price by Region, Cardiac Output Monitor Market, Global, 2021 – 2031 (US$) |
| Figure 11‑9: Market Value by Region, Cardiac Output Monitor Market, Global, 2021 – 2031 (US$M) |
| Figure 11‑10: Cardiac Output Sensor Market, Global, 2021 – 2031 |
| Figure 11‑11: Units Sold by Region, Cardiac Output Sensor Market, Global, 2021 – 2031 |
| Figure 11‑12: Average Selling Price by Region, Cardiac Output Sensor Market, Global, 2021 – 2031 (US$) |
| Figure 11‑13: Market Value by Region, Cardiac Output Sensor Market, Global, 2021 – 2031 (US$M) |
| Figure 11‑14: Pulmonary Artery Catheter Market, Global, 2021 – 2031 |
| Figure 11‑15: Units Sold by Region, Pulmonary Artery Catheter Market, Global, 2021 – 2031 |
| Figure 11‑16: Average Selling Price by Region, Pulmonary Artery Catheter Market, Global, 2021 – 2031 (US$) |
| Figure 11‑17: Market Value by Region, Pulmonary Artery Catheter Market, Global, 2021 – 2031 (US$M) |
| Figure 11‑18: Leading Competitors, Cardiac Output Monitor Market, Global, 2024 |
| Figure 12‑1: Blood Pressure Monitoring Market Segmentation |
| Figure 12‑2: Blood Pressure Monitoring Regions Covered, Global (1 of 2) |
| Figure 12‑3: Blood Pressure Monitoring Regions Covered, Global (2 of 2) |
| Figure 12‑4: Blood Pressure Monitoring Market by Segment, Global, 2021 – 2031 (US$M) |
| Figure 12‑5: Blood Pressure Monitoring Market by Region, Global, 2021 – 2031 (US$M) |
| Figure 12‑6: Personal Blood Pressure Monitor Market by Segment, Global, 2021 – 2031 (US$M) |
| Figure 12‑7: Total Personal Blood Pressure Monitor Market, Global, 2021 – 2031 |
| Figure 12‑8: Units Sold by Region, Personal Blood Pressure Monitor Market, Global, 2021 – 2031 |
| Figure 12‑9: Average Selling Price by Region, Personal Blood Pressure Monitor Market, Global, 2021 – 2031 (US$) |
| Figure 12‑10: Market Value by Region, Personal Blood Pressure Monitor Market, Global, 2021 – 2031 (US$M) |
| Figure 12‑11: Personal Digital Blood Pressure Monitor Market, Global, 2021 – 2031 |
| Figure 12‑12: Units Sold by Region, Personal Digital Blood Pressure Monitor Market, Global, 2021 – 2031 |
| Figure 12‑13: Average Selling Price by Region, Personal Digital Blood Pressure Monitor Market, Global, 2021 – 2031 (US$) |
| Figure 12‑14: Market Value by Region, Personal Digital Blood Pressure Monitor Market, Global, 2021 – 2031 (US$M) |
| Figure 12‑15: Personal Aneroid Blood Pressure Monitor Market, Global, 2021 – 2031 |
| Figure 12‑16: Units Sold by Region, Personal Aneroid Blood Pressure Monitor Market, Global, 2021 – 2031 |
| Figure 12‑17: Average Selling Price by Region, Personal Aneroid Blood Pressure Monitor Market, Global, 2021 – 2031 (US$) |
| Figure 12‑18: Market Value by Region, Personal Aneroid Blood Pressure Monitor Market, Global, 2021 – 2031 (US$M) |
| Figure 12‑19: Professional Blood Pressure Monitor Market by Segment, Global, 2021 – 2031 (US$M) |
| Figure 12‑20: Total Professional Blood Pressure Monitor Market, Global, 2021 – 2031 |
| Figure 12‑21: Units Sold by Region, Professional Blood Pressure Monitor Market, Global, 2021 – 2031 |
| Figure 12‑22: Average Selling Price by Region, Professional Blood Pressure Monitor Market, Global, 2021 – 2031 (US$) |
| Figure 12‑23: Market Value by Region, Professional Blood Pressure Monitor Market, Global, 2021 – 2031 (US$M) |
| Figure 12‑24: Professional Digital Blood Pressure Monitor Market, Global, 2021 – 2031 |
| Figure 12‑25: Units Sold by Region, Professional Digital Blood Pressure Monitor Market, Global, 2021 – 2031 |
| Figure 12‑26: Average Selling Price by Region, Professional Digital Blood Pressure Monitor Market, Global, 2021 – 2031 (US$) |
| Figure 12‑27: Market Value by Region, Professional Digital Blood Pressure Monitor Market, Global, 2021 – 2031 (US$M) |
| Figure 12‑28: Professional Aneroid Blood Pressure Monitor Market, Global, 2021 – 2031 |
| Figure 12‑29: Units Sold by Region, Professional Aneroid Blood Pressure Monitor Market, Global, 2021 – 2031 |
| Figure 12‑30: Average Selling Price by Region, Professional Aneroid Blood Pressure Monitor Market, Global, 2021 – 2031 (US$) |
| Figure 12‑31: Market Value by Region, Professional Aneroid Blood Pressure Monitor Market, Global, 2021 – 2031 (US$M) |
| Figure 12‑32: Blood Pressure Cuff Market by Segment, Global, 2021 – 2031 (US$M) |
| Figure 12‑33: Total Blood Pressure Cuff Market, Global, 2021 – 2031 |
| Figure 12‑34: Units Sold by Region, Blood Pressure Cuff Market, Global, 2021 – 2031 |
| Figure 12‑35: Average Selling Price by Region, Blood Pressure Cuff Market, Global, 2021 – 2031 (US$) |
| Figure 12‑36: Market Value by Region, Blood Pressure Cuff Market, Global, 2021 – 2031 (US$M) |
| Figure 12‑37: Reusable Blood Pressure Cuff Market, Global, 2021 – 2031 |
| Figure 12‑38: Units Sold by Region, Reusable Blood Pressure Cuff Market, Global, 2021 – 2031 |
| Figure 12‑39: Average Selling Price by Region, Reusable Blood Pressure Cuff Market, Global, 2021 – 2031 (US$) |
| Figure 12‑40: Market Value by Region, Reusable Blood Pressure Cuff Market, Global, 2021 – 2031 (US$M) |
| Figure 12‑41: Disposable Blood Pressure Cuff Market, Global, 2021 – 2031 |
| Figure 12‑42: Units Sold by Region, Disposable Blood Pressure Cuff Market, Global, 2021 – 2031 |
| Figure 12‑43: Average Selling Price by Region, Disposable Blood Pressure Cuff Market, Global, 2021 – 2031 (US$) |
| Figure 12‑44: Market Value by Region, Disposable Blood Pressure Cuff Market, Global, 2021 – 2031 (US$M) |
| Figure 12‑45: Leading Competitors, Blood Pressure Monitoring Market, Global, 2024 |
| Figure 13‑1: Electrocardiogram Monitoring Market Segmentation |
| Figure 13‑2: Electrocardiogram Monitoring Regions Covered, Global (1 of 2) |
| Figure 13‑3: Electrocardiogram Monitoring Regions Covered, Global (2 of 2) |
| Figure 13‑4: Electrocardiogram Procedures by Region, Global, 2021 – 2031 |
| Figure 13‑5: Electrocardiogram Monitoring Market by Segment, Global, 2021 – 2031 (US$M) |
| Figure 13‑6: Electrocardiogram Monitoring Market by Region, Global, 2021 – 2031 (US$M) |
| Figure 13‑7: ECG Monitor Market by Segment, Global, 2021 – 2031 (US$M) |
| Figure 13‑8: Total ECG Monitor Market, Global, 2021 – 2031 |
| Figure 13‑9: Units Sold by Region, ECG Monitor Market, Global, 2021 – 2031 |
| Figure 13‑10: Average Selling Price by Region, ECG Monitor Market, Global, 2021 – 2031 (US$) |
| Figure 13‑11: Market Value by Region, ECG Monitor Market, Global, 2021 – 2031 (US$M) |
| Figure 13‑12: Resting ECG Monitor Market, Global, 2021 – 2031 |
| Figure 13‑13: Units Sold by Region, Resting ECG Monitor Market, Global, 2021 – 2031 |
| Figure 13‑14: Average Selling Price by Region, Resting ECG Monitor Market, Global, 2021 – 2031 (US$) |
| Figure 13‑15: Market Value by Region, Resting ECG Monitor Market, Global, 2021 – 2031 (US$M) |
| Figure 13‑16: Stress Testing ECG Monitor Market, Global, 2021 – 2031 |
| Figure 13‑17: Units Sold by Region, Stress Testing ECG Monitor Market, Global, 2021 – 2031 |
| Figure 13‑18: Average Selling Price by Region, Stress Testing ECG Monitor Market, Global, 2021 – 2031 (US$) |
| Figure 13‑19: Market Value by Region, Stress Testing ECG Monitor Market, Global, 2021 – 2031 (US$M) |
| Figure 13‑20: Holter Monitoring Recorder ECG Market, Global, 2021 – 2031 |
| Figure 13‑21: Units Sold by Region, Holter Monitoring Recorder ECG Market, Global, 2021 – 2031 |
| Figure 13‑22: Average Selling Price by Region, Holter Monitoring Recorder ECG Market, Global, 2021 – 2031 (US$) |
| Figure 13‑23: Market Value by Region, Holter Monitoring Recorder ECG Market, Global, 2021 – 2031 (US$M) |
| Figure 13‑24: Total ECG Electrode Market, Global, 2021 – 2031 |
| Figure 13‑25: Units Sold by Region, ECG Electrode Market, Global, 2021 – 2031 |
| Figure 13‑26: Average Selling Price by Region, ECG Electrode Market, Global, 2021 – 2031 (US$) |
| Figure 13‑27: Market Value by Region, ECG Electrode Market, Global, 2021 – 2031 (US$M) |
| Figure 13‑28: Leading Competitors, Electrocardiogram Monitoring Market, Global, 2024 |
| Figure 14‑1: Temperature Management Market Segmentation |
| Figure 14‑2: Temperature Management Regions Covered, Global (1 of 2) |
| Figure 14‑3: Temperature Management Regions Covered, Global (2 of 2) |
| Figure 14‑4: Temperature Management Market by Segment, Global, 2021 – 2031 (US$M) |
| Figure 14‑5: Temperature Management Market by Region, Global, 2021 – 2031 (US$M) |
| Figure 14‑6: Surface Pad Temperature Management Market by Segment, Global, 2021 – 2031 (US$M) |
| Figure 14‑7: Market Value by Region, Surface Pad Temperature Management Market, Global, 2021 – 2031 (US$M) |
| Figure 14‑8: Surface Pad Temperature Management Machine Market, Global, 2021 – 2031 |
| Figure 14‑9: Units Sold by Region, Surface Pad Temperature Management Machine Market, Global, 2021 – 2031 |
| Figure 14‑10: Average Selling Price by Region, Surface Pad Temperature Management Machine Market, Global, 2021 – 2031 (US$) |
| Figure 14‑11: Market Value by Region, Surface Pad Temperature Management Machine Market, Global, 2021 – 2031 (US$M) |
| Figure 14‑12: Surface Pad Temperature Management Accessory Market, Global, 2021 – 2031 |
| Figure 14‑13: Units Sold by Region, Surface Pad Temperature Management Accessory Market, Global, 2021 – 2031 |
| Figure 14‑14: Average Selling Price by Region, Surface Pad Temperature Management Accessory Market, Global, 2021 – 2031 (US$) |
| Figure 14‑15: Market Value by Region, Surface Pad Temperature Management Accessory Market, Global, 2021 – 2031 (US$M) |
| Figure 14‑16: Intravascular Temperature Management Market by Segment, Global, 2021 – 2031 (US$M) |
| Figure 14‑17: Market Value by Region, Intravascular Temperature Management Market, Global, 2021 – 2031 (US$M) |
| Figure 14‑18: Intravascular Temperature Management Machine Market, Global, 2021 – 2031 |
| Figure 14‑19: Units Sold by Region, Intravascular Temperature Management Machine Market, Global, 2021 – 2031 |
| Figure 14‑20: Average Selling Price by Region, Intravascular Temperature Management Machine Market, Global, 2021 – 2031 (US$) |
| Figure 14‑21: Market Value by Region, Intravascular Temperature Management Machine Market, Global, 2021 – 2031 (US$M) |
| Figure 14‑22: Intravascular Temperature Management Accessory Market, Global, 2021 – 2031 |
| Figure 14‑23: Units Sold by Region, Intravascular Temperature Management Accessory Market, Global, 2021 – 2031 |
| Figure 14‑24: Average Selling Price by Region, Intravascular Temperature Management Accessory Market, Global, 2021 – 2031 (US$) |
| Figure 14‑25: Market Value by Region, Intravascular Temperature Management Accessory Market, Global, 2021 – 2031 (US$M) |
| Figure 14‑26: Leading Competitors, Temperature Management Market, Global, 2024 |

 Globally, there is an increased awareness among both physicians and patients as to the benefits of monitoring in a wide array of areas, including continual monitoring both in hospital as well as in the home. This is not only driving demand for existing devices, but also motivating innovation in the market across multiple segments. As devices continue to improve their array of features and lower their costs, the healthcare population will be more motivated to act on this awareness to purchase new devices.