| Figure 1‑1: Laparoscopic Device Market Share Ranking by Segment, Global, 2025 (1 of 2) |
| Figure 1‑2: Laparoscopic Device Market Share Ranking by Segment, Global, 2025 (2 of 2) |
| Figure 1‑3: Companies Researched in This Report (1 of 2) |
| Figure 1‑4: Companies Researched in This Report (2 of 2) |
| Figure 1‑5: Factors Impacting the Laparoscopic Device Market by Segment, Global (1 of 2) |
| Figure 1‑6: Factors Impacting the Laparoscopic Device Market by Segment, Europe (2 of 2) |
| Figure 1‑7: Recent Events in the Laparoscopic Device Market, Global, 2022 – 2026 (1 of 3) |
| Figure 1‑8: Recent Events in the Laparoscopic Device Market, Global, 2022 – 2026 (2 of 3) |
| Figure 1‑9: Recent Events in the Laparoscopic Device Market, Global, 2022 – 2026 (3 of 3) |
| Figure 1‑10: Laparoscopic Device Procedures Covered, Global, 2025 |
| Figure 1‑11: Laparoscopic Device Markets Covered, Europe, 2023 (1 of 2) |
| Figure 1‑12: Laparoscopic Device Market Regions Covered, Global (1 of 2) |
| Figure 1‑13: Laparoscopic Device Market Regions Covered, Global (2 of 2) |
| Figure 1‑14: Key Analysis Updates |
| Figure 1‑15: Key Report Updates |
| Figure 1‑16: Version History |
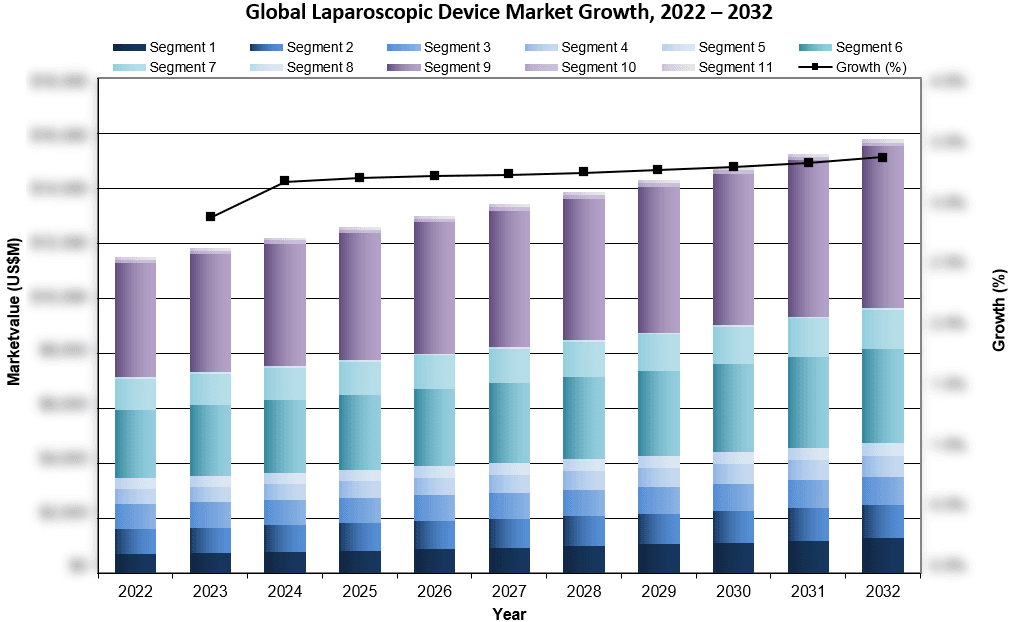
| Figure 3‑1: Laparoscopic device Market by Segment, Global, 2022 – 2032 (US$M) (1 of 2) |
| Figure 3‑2: Laparoscopic Device Market by Segment, Global, 2022 – 2032 (US$M) (2 of 2) |
| Figure 3‑3: Laparoscopic Device Market by Region, Global, 2022 – 2032 (US$M) |
| Figure 3‑4: Leading Competitors, Laparoscopic Device Market by Segment, Global, 2025 (1 of 3) |
| Figure 3‑5: Leading Competitors, Laparoscopic Device Market by Segment, Global, 2025 (2 of 3) |
| Figure 3‑6: Leading Competitors, Laparoscopic Device Market by Segment, Global, 2025 (3 of 3) |
| Figure 4‑1: Laparoscopic Procedures by Indication, Global, 2022 – 2032 (1 of 2) |
| Figure 4‑2: Laparoscopic Procedures by Indication, Global, 2022 – 2032 (2 of 2) |
| Figure 4‑3: Laparoscopic Procedures by Region, Global, 2022 – 2032 |
| Figure 4‑4: Laparoscopic Procedures by Country, North America, 2022 – 2032 |
| Figure 4‑5: Laparoscopic Procedures by Country, Latin America, 2022 – 2032 (1 of 2) |
| Figure 4‑6: Laparoscopic Procedures by Country, Latin America, 2022 – 2032 (2 of 2) |
| Figure 4‑7: Laparoscopic Procedures by Country, Western Europe, 2022 – 2032 |
| Figure 4‑8: Laparoscopic Procedures by Country, Central & Eastern Europe, 2022 – 2032 (1 of 2) |
| Figure 4‑9: Laparoscopic Procedures by Country, Central & Eastern Europe, 2022 – 2032 (2 of 2) |
| Figure 4‑10: Laparoscopic Procedures by Country, Middle East, 2022 – 2032 |
| Figure 4‑11: Laparoscopic Procedures by Country, Asia-Pacific, 2022 – 2032 (1 of 3) |
| Figure 4‑12: Laparoscopic Procedures by Country, Asia-Pacific, 2022 – 2032 (2 of 3) |
| Figure 4‑13: Laparoscopic Procedures by Country, Asia-Pacific, 2022 – 2032 (3 of 3) |
| Figure 4‑14: Laparoscopic Procedures by Country, Africa, 2022 – 2032 |
| Figure 4‑15: Cholecystectomy Procedures by Region, Global, 2022 – 2032 |
| Figure 4‑16: Cholecystectomy Procedures by Country, North America, 2022 – 2032 |
| Figure 4‑17: Cholecystectomy Procedures by Country, Latin America, 2022 – 2032 (1 of 2) |
| Figure 4‑18: Cholecystectomy Procedures by Country, Latin America, 2022 – 2032 (2 of 2) |
| Figure 4‑19: Cholecystectomy Procedures by Country, Western Europe, 2022 – 2032 |
| Figure 4‑20: Cholecystectomy Procedures by Country, Central & Eastern Europe, 2022 – 2032 (1 of 2) |
| Figure 4‑21: Cholecystectomy Procedures by Country, Central & Eastern Europe, 2022 – 2032 (2 of 2) |
| Figure 4‑22: Cholecystectomy Procedures by Country, Middle East, 2022 – 2032 |
| Figure 4‑23: Cholecystectomy Procedures by Country, Asia-Pacific, 2022 – 2032 (1 of 3) |
| Figure 4‑24: Cholecystectomy Procedures by Country, Asia-Pacific, 2022 – 2032 (2 of 3) |
| Figure 4‑25: Cholecystectomy Procedures by Country, Asia-Pacific, 2022 – 2032 (3 of 3) |
| Figure 4‑26: Cholecystectomy Procedures by Country, Africa, 2022 – 2032 |
| Figure 4‑27: Nephrectomy Procedures by Region, Global, 2022 – 2032 |
| Figure 4‑28: Nephrectomy Procedures by Country, North America, 2022 – 2032 |
| Figure 4‑29: Nephrectomy Procedures by Country, Latin America, 2022 – 2032 (1 of 2) |
| Figure 4‑30: Nephrectomy Procedures by Country, Latin America, 2022 – 2032 (2 of 2) |
| Figure 4‑31: Nephrectomy Procedures by Country, Western Europe, 2022 – 2032 |
| Figure 4‑32: Nephrectomy Procedures by Country, Central & Eastern Europe, 2022 – 2032 (1 of 2) |
| Figure 4‑33: Nephrectomy Procedures by Country, Central & Eastern Europe, 2022 – 2032 (2 of 2) |
| Figure 4‑34: Nephrectomy Procedures by Country, Middle East, 2022 – 2032 |
| Figure 4‑35: Nephrectomy Procedures by Country, Asia-Pacific, 2022 – 2032 (1 of 3) |
| Figure 4‑36: Nephrectomy Procedures by Country, Asia-Pacific, 2022 – 2032 (2 of 3) |
| Figure 4‑37: Nephrectomy Procedures by Country, Asia-Pacific, 2022 – 2032 (3 of 3) |
| Figure 4‑38: Nephrectomy Procedures by Country, Africa, 2022 – 2032 |
| Figure 4‑39: Partial Nephrectomy Procedures by Country, North America, 2022 – 2032 |
| Figure 4‑40: Partial Nephrectomy Procedures by Country, Latin America, 2022 – 2032 (1 of 2) |
| Figure 4‑41: Partial Nephrectomy Procedures by Country, Latin America, 2022 – 2032 (2 of 2) |
| Figure 4‑42: Partial Nephrectomy Procedures by Country, Western Europe, 2022 – 2032 |
| Figure 4‑43: Partial Nephrectomy Procedures by Country, Central & Eastern Europe, 2022 – 2032 (1 of 2) |
| Figure 4‑44: Partial Nephrectomy Procedures by Country, Central & Eastern Europe, 2022 – 2032 (2 of 2) |
| Figure 4‑45: Partial Nephrectomy Procedures by Country, Middle East, 2022 – 2032 |
| Figure 4‑46: Partial Nephrectomy Procedures by Country, Asia-Pacific, 2022 – 2032 (1 of 3) |
| Figure 4‑47: Partial Nephrectomy Procedures by Country, Asia-Pacific, 2022 – 2032 (2 of 3) |
| Figure 4‑48: Partial Nephrectomy Procedures by Country, Asia-Pacific, 2022 – 2032 (3 of 3) |
| Figure 4‑49: Partial Nephrectomy Procedures by Country, Africa, 2022 – 2032 |
| Figure 4‑50: Radical Nephrectomy Procedures by Country, North America, 2022 – 2032 |
| Figure 4‑51: Radical Nephrectomy Procedures by Country, Latin America, 2022 – 2032 (1 of 2) |
| Figure 4‑52: Radical Nephrectomy Procedures by Country, Latin America, 2022 – 2032 (2 of 2) |
| Figure 4‑53: Radical Nephrectomy Procedures by Country, Western Europe, 2022 – 2032 |
| Figure 4‑54: Radical Nephrectomy Procedures by Country, Central & Eastern Europe, 2022 – 2032 (1 of 2) |
| Figure 4‑55: Radical Nephrectomy Procedures by Country, Central & Eastern Europe, 2022 – 2032 (2 of 2) |
| Figure 4‑56: Radical Nephrectomy Procedures by Country, Middle East, 2022 – 2032 |
| Figure 4‑57: Radical Nephrectomy Procedures by Country, Asia-Pacific, 2022 – 2032 (1 of 3) |
| Figure 4‑58: Radical Nephrectomy Procedures by Country, Asia-Pacific, 2022 – 2032 (2 of 3) |
| Figure 4‑59: Radical Nephrectomy Procedures by Country, Asia-Pacific, 2022 – 2032 (3 of 3) |
| Figure 4‑60: Radical Nephrectomy Procedures by Country, Africa, 2022 – 2032 |
| Figure 4‑61: Bariatric Surgery Procedures by Region, Global, 2022 – 2032 |
| Figure 4‑62: Bariatric Surgery Procedures by Country, North America, 2022 – 2032 |
| Figure 4‑63: Bariatric Surgery Procedures by Country, Latin America, 2022 – 2032 (1 of 2) |
| Figure 4‑64: Bariatric Surgery Procedures by Country, Latin America, 2022 – 2032 (2 of 2) |
| Figure 4‑65: Bariatric Surgery Procedures by Country, Western Europe, 2022 – 2032 |
| Figure 4‑66: Bariatric Surgery Procedures by Country, Central & Eastern Europe, 2022 – 2032 (1 of 2) |
| Figure 4‑67: Bariatric Surgery Procedures by Country, Central & Eastern Europe, 2022 – 2032 (2 of 2) |
| Figure 4‑68: Bariatric Surgery Procedures by Country, Middle East, 2022 – 2032 |
| Figure 4‑69: Bariatric Surgery Procedures by Country, Asia-Pacific, 2022 – 2032 (1 of 3) |
| Figure 4‑70: Bariatric Surgery Procedures by Country, Asia-Pacific, 2022 – 2032 (2 of 3) |
| Figure 4‑71: Bariatric Surgery Procedures by Country, Asia-Pacific, 2022 – 2032 (3 of 3) |
| Figure 4‑72: Bariatric Surgery Procedures by Country, Africa, 2022 – 2032 |
| Figure 4‑73: Anti-Reflux Procedures by Region, Global, 2022 – 2032 |
| Figure 4‑74: Anti-Reflux Procedures by Country, North America, 2022 – 2032 |
| Figure 4‑75: Anti-Reflux Procedures by Country, Latin America, 2022 – 2032 (1 of 2) |
| Figure 4‑76: Anti-Reflux Procedures by Country, Latin America, 2022 – 2032 (2 of 2) |
| Figure 4‑77: Anti-Reflux Procedures by Country, Western Europe, 2022 – 2032 |
| Figure 4‑78: Anti-Reflux Procedures by Country, Central & Eastern Europe, 2022 – 2032 (1 of 2) |
| Figure 4‑79: Anti-Reflux Procedures by Country, Central & Eastern Europe, 2022 – 2032 (2 of 2) |
| Figure 4‑80: Anti-Reflux Procedures by Country, Middle East, 2022 – 2032 |
| Figure 4‑81: Anti-Reflux Procedures by Country, Asia-Pacific, 2022 – 2032 (1 of 3) |
| Figure 4‑82: Anti-Reflux Procedures by Country, Asia-Pacific, 2022 – 2032 (2 of 3) |
| Figure 4‑83: Anti-Reflux Procedures by Country, Asia-Pacific, 2022 – 2032 (3 of 3) |
| Figure 4‑84: Anti-Reflux Procedures by Country, Africa, 2022 – 2032 |
| Figure 4‑85: Colectomy Procedures by Region, Global, 2022 – 2032 |
| Figure 4‑86: Colectomy Procedures by Country, North America, 2022 – 2032 |
| Figure 4‑87: Colectomy Procedures by Country, Latin America, 2022 – 2032 (1 of 2) |
| Figure 4‑88: Colectomy Procedures by Country, Latin America, 2022 – 2032 (2 of 2) |
| Figure 4‑89: Colectomy Procedures by Country, Western Europe, 2022 – 2032 |
| Figure 4‑90: Colectomy Procedures by Country, Central & Eastern Europe, 2022 – 2032 (1 of 2) |
| Figure 4‑91: Colectomy Procedures by Country, Central & Eastern Europe, 2022 – 2032 (2 of 2) |
| Figure 4‑92: Colectomy Procedures by Country, Middle East, 2022 – 2032 |
| Figure 4‑93: Colectomy Procedures by Country, Asia-Pacific, 2022 – 2032 (1 of 3) |
| Figure 4‑94: Colectomy Procedures by Country, Asia-Pacific, 2022 – 2032 (2 of 3) |
| Figure 4‑95: Colectomy Procedures by Country, Asia-Pacific, 2022 – 2032 (3 of 3) |
| Figure 4‑96: Colectomy Procedures by Country, Africa, 2022 – 2032 |
| Figure 4‑97: Appendectomy Procedures by Region, Global, 2022 – 2032 |
| Figure 4‑98: Appendectomy Procedures by Country, North America, 2022 – 2032 |
| Figure 4‑99: Appendectomy Procedures by Country, Latin America, 2022 – 2032 (1 of 2) |
| Figure 4‑100: Appendectomy Procedures by Country, Latin America, 2022 – 2032 (2 of 2) |
| Figure 4‑101: Appendectomy Procedures by Country, Western Europe, 2022 – 2032 |
| Figure 4‑102: Appendectomy Procedures by Country, Central & Eastern Europe, 2022 – 2032 (1 of 2) |
| Figure 4‑103: Appendectomy Procedures by Country, Central & Eastern Europe, 2022 – 2032 (2 of 2) |
| Figure 4‑104: Appendectomy Procedures by Country, Middle East, 2022 – 2032 |
| Figure 4‑105: Appendectomy Procedures by Country, Asia-Pacific, 2022 – 2032 (1 of 3) |
| Figure 4‑106: Appendectomy Procedures by Country, Asia-Pacific, 2022 – 2032 (2 of 3) |
| Figure 4‑107: Appendectomy Procedures by Country, Asia-Pacific, 2022 – 2032 (3 of 3) |
| Figure 4‑108: Appendectomy Procedures by Country, Africa, 2022 – 2032 |
| Figure 4‑109: Inguinal Hernia Repair Procedures by Region, Global, 2022 – 2032 |
| Figure 4‑110: Inguinal Hernia Repair Procedures by Country, North America, 2022 – 2032 |
| Figure 4‑111: Inguinal Hernia Repair Procedures by Country, Latin America, 2022 – 2032 (1 of 2) |
| Figure 4‑112: Inguinal Hernia Repair Procedures by Country, Latin America, 2022 – 2032 (2 of 2) |
| Figure 4‑113: Inguinal Hernia Repair Procedures by Country, Western Europe, 2022 – 2032 |
| Figure 4‑114: Inguinal Hernia Repair Procedures by Country, Central & Eastern Europe, 2022 – 2032 (1 of 2) |
| Figure 4‑115: Inguinal Hernia Repair Procedures by Country, Central & Eastern Europe, 2022 – 2032 (2 of 2) |
| Figure 4‑116: Inguinal Hernia Repair Procedures by Country, Middle East, 2022 – 2032 |
| Figure 4‑117: Inguinal Hernia Repair Procedures by Country, Asia-Pacific, 2022 – 2032 (1 of 3) |
| Figure 4‑118: Inguinal Hernia Repair Procedures by Country, Asia-Pacific, 2022 – 2032 (2 of 3) |
| Figure 4‑119: Inguinal Hernia Repair Procedures by Country, Asia-Pacific, 2022 – 2032 (3 of 3) |
| Figure 4‑120: Inguinal Hernia Repair Procedures by Country, Africa, 2022 – 2032 |
| Figure 4‑121: Hysterectomy Procedures by Region, Global, 2022 – 2032 |
| Figure 4‑122: Hysterectomy Procedures by Country, North America, 2022 – 2032 |
| Figure 4‑123: Hysterectomy Repair Procedures by Country, Latin America, 2022 – 2032 (1 of 2) |
| Figure 4‑124: Hysterectomy Procedures by Country, Latin America, 2022 – 2032 (2 of 2) |
| Figure 4‑125: Hysterectomy Procedures by Country, Western Europe, 2022 – 2032 |
| Figure 4‑126: Hysterectomy Procedures by Country, Central & Eastern Europe, 2022 – 2032 (1 of 2) |
| Figure 4‑127: Hysterectomy Procedures by Country, Central & Eastern Europe, 2022 – 2032 (2 of 2) |
| Figure 4‑128: Hysterectomy Procedures by Country, Middle East, 2022 – 2032 |
| Figure 4‑129: Hysterectomy Procedures by Country, Asia-Pacific, 2022 – 2032 (1 of 3) |
| Figure 4‑130: Hysterectomy Procedures by Country, Asia-Pacific, 2022 – 2032 (2 of 3) |
| Figure 4‑131: Hysterectomy Procedures by Country, Asia-Pacific, 2022 – 2032 (3 of 3) |
| Figure 4‑132: Hysterectomy Procedures by Country, Africa, 2022 – 2032 |
| Figure 4‑133: Prostatectomy Procedures by Region, Global, 2022 – 2032 |
| Figure 4‑134: Prostatectomy Procedures by Country, North America, 2022 – 2032 |
| Figure 4‑135: Prostatectomy Procedures by Country, Latin America, 2022 – 2032 (1 of 2) |
| Figure 4‑136: Prostatectomy Procedures by Country, Latin America, 2022 – 2032 (2 of 2) |
| Figure 4‑137: Prostatectomy Procedures by Country, Western Europe, 2022 – 2032 |
| Figure 4‑138: Prostatectomy Procedures by Country, Central & Eastern Europe, 2022 – 2032 (1 of 2) |
| Figure 4‑139: Prostatectomy Procedures by Country, Central & Eastern Europe, 2022 – 2032 (2 of 2) |
| Figure 4‑140: Prostatectomy Procedures by Country, Middle East, 2022 – 2032 |
| Figure 4‑141: Prostatectomy Procedures by Country, Asia-Pacific, 2022 – 2032 (1 of 3) |
| Figure 4‑142: Prostatectomy Procedures by Country, Asia-Pacific, 2022 – 2032 (2 of 3) |
| Figure 4‑143: Prostatectomy Procedures by Country, Asia-Pacific, 2022 – 2032 (3 of 3) |
| Figure 4‑144: Prostatectomy Procedures by Country, Africa, 2022 – 2032 |
| Figure 4‑145: Myomectomy Procedures by Region, Global, 2022 – 2032 |
| Figure 4‑146: Myomectomy Procedures by Country, North America, 2022 – 2032 |
| Figure 4‑147: Myomectomy Procedures by Country, Latin America, 2022 – 2032 (1 of 2) |
| Figure 4‑148: Myomectomy Procedures by Country, Latin America, 2022 – 2032 (2 of 2) |
| Figure 4‑149: Myomectomy Procedures by Country, Western Europe, 2022 – 2032 |
| Figure 4‑150: Myomectomy Procedures by Country, Central & Eastern Europe, 2022 – 2032 (1 of 2) |
| Figure 4‑151: Myomectomy Procedures by Country, Central & Eastern Europe, 2022 – 2032 (2 of 2) |
| Figure 4‑152: Myomectomy Procedures by Country, Middle East, 2022 – 2032 |
| Figure 4‑153: Myomectomy Procedures by Country, Asia-Pacific, 2022 – 2032 (1 of 3) |
| Figure 4‑154: Myomectomy Procedures by Country, Asia-Pacific, 2022 – 2032 (2 of 3) |
| Figure 4‑155: Myomectomy Procedures by Country, Asia-Pacific, 2022 – 2032 (3 of 3) |
| Figure 4‑156: Myomectomy Procedures by Country, Africa, 2022 – 2032 |
| Figure 5‑1: Laparoscope Markets Covered |
| Figure 5‑2: Laparoscope Regions Covered, Global (1 of 2) |
| Figure 5‑3: Laparoscope Regions Covered, Global (2 of 2) |
| Figure 5‑4: Laparoscope Market by Segment, Global, 2022 – 2032 (US$M) |
| Figure 5‑5: Laparoscope Market by Region, Global, 2022 – 2032 (US$M) |
| Figure 5‑6: Total Laparoscope Market, Global, 2022 – 2032 |
| Figure 5‑7: Units Sold by Region, Total Laparoscope Market, Global, 2022 – 2032 |
| Figure 5‑8: Average Selling Price by Region, Total Laparoscope Market, Global, 2022 – 2032 (US$) |
| Figure 5‑9: Market Value by Region, Total Laparoscope Market, Global, 2022 – 2032 (US$M) |
| Figure 5‑10: Rigid Laparoscope Market, Global, 2022 – 2032 |
| Figure 5‑11: Units Sold by Region, Rigid Laparoscope Market, Global, 2022 – 2032 |
| Figure 5‑12: Average Selling Price by Region, Rigid Laparoscope Market, Global, 2022 – 2032 (US$) |
| Figure 5‑13: Market Value by Region, Rigid Laparoscope Market, Global, 2022 – 2032 (US$M) |
| Figure 5‑14: Flexible Laparoscope Market, Global, 2022 – 2032 |
| Figure 5‑15: Units Sold by Region, Flexible Laparoscope Market, Global, 2022 – 2032 |
| Figure 5‑16: Average Selling Price by Region, Flexible Laparoscope Market, Global, 2022 – 2032 (US$) |
| Figure 5‑17: Market Value by Region, Flexible Laparoscope Market, Global, 2022 – 2032 (US$M) |
| Figure 5‑18: Leading Competitors, Laparoscope Market, Global, 2025 |
| Figure 6‑1: Access Device Markets Covered |
| Figure 6‑2: Access Device Regions Covered, Global (1 of 2) |
| Figure 6‑3: Access Device Regions Covered, Global (2 of 2) |
| Figure 6‑4: Access Device Market by Segment, Global, 2022 – 2032 (US$M) |
| Figure 6‑5: Access Device Market by Region, Global, 2022 – 2032 (US$M) |
| Figure 6‑6: Trocar Market by Segment, Global, 2022 – 2032 (US$M) |
| Figure 6‑7: Total Trocar Market, Global, 2022 – 2032 |
| Figure 6‑8: Units Sold by Region, Total Trocar Market, Global, 2022 – 2032 |
| Figure 6‑9: Average Selling Price by Region, Total Trocar Market, Global, 2022 – 2032 (US$) |
| Figure 6‑10: Market Value by Region, Total Trocar Market, Global, 2022 – 2032 (US$M) |
| Figure 6‑11: Disposable Trocar Market, Global, 2022 – 2032 |
| Figure 6‑12: Units Sold by Region, Disposable Trocar Market, Global, 2022 – 2032 |
| Figure 6‑13: Average Selling Price by Region, Disposable Trocar Market, Global, 2022 – 2032 (US$) |
| Figure 6‑14: Market Value by Region, Disposable Trocar Market, Global, 2022 – 2032 (US$M) |
| Figure 6‑15: Reposable Trocar Market, Global, 2022 – 2032 |
| Figure 6‑16: Units Sold by Region, Reposable Trocar Market, Global, 2022 – 2032 |
| Figure 6‑17: Average Selling Price by Region, Reposable Trocar Market, Global, 2022 – 2032 (US$) |
| Figure 6‑18: Market Value by Region, Reposable Trocar Market, Global, 2022 – 2032 (US$M) |
| Figure 6‑19: Reusable Trocar Market, Global, 2022 – 2032 |
| Figure 6‑20: Units Sold by Region, Reusable Trocar Market, Global, 2022 – 2032 |
| Figure 6‑21: Average Selling Price by Region, Reusable Trocar Market, Global, 2022 – 2032 (US$) |
| Figure 6‑22: Market Value by Region, Reusable Trocar Market, Global, 2022 – 2032 (US$M) |
| Figure 6‑23: Single-Port Access Device Market, Global, 2022 – 2032 |
| Figure 6‑24: Units Sold by Region, Single-Port Access Device Market, Global, 2022 – 2032 |
| Figure 6‑25: Average Selling Price by Region, Single-Port Access Device Market, Global, 2022 – 2032 (US$) |
| Figure 6‑26: Market Value by Region, Single-Port Access Device Market, Global, 2022 – 2032 (US$M) |
| Figure 6‑27: Leading Competitors, Access Device Market, Global, 2025 |
| Figure 7‑1: Hand Instrument Markets Covered |
| Figure 7‑2: Hand Instrument Regions Covered, Global (1 of 2) |
| Figure 7‑3: Hand Instrument Regions Covered, Global (2 of 2) |
| Figure 7‑4: Hand Instrument Market by Segment, Global, 2022 – 2032 (US$M) |
| Figure 7‑5: Hand Instrument Market by Region, Global, 2022 – 2032 (US$M) |
| Figure 7‑6: Hand Instrument Market, Global, 2022 – 2032 |
| Figure 7‑7: Units Sold by Region, Hand Instrument Market, Global, 2022 – 2032 |
| Figure 7‑8: Average Selling Price by Region, Hand Instrument Market, Global, 2022 – 2032 (US$) |
| Figure 7‑9: Market Value by Region, Hand Instrument Market, Global, 2022 – 2032 (US$M) |
| Figure 7‑10: Static Hand Instrument Market, Global, 2022 – 2032 |
| Figure 7‑11: Units Sold by Region, Reusable Hand Instrument Market, Global, 2022 – 2032 |
| Figure 7‑12: Average Selling Price by Region, Reusable Hand Instrument Market, Global, 2022 – 2032 (US$) |
| Figure 7‑13: Market Value by Region, Reusable Hand Instrument Market, Global, 2022 – 2032 (US$M) |
| Figure 7‑14: Articulating Hand Instrument Market, Global, 2022 – 2032 |
| Figure 7‑15: Units Sold by Region, Articulating Hand Instrument Market, Global, 2022 – 2032 |
| Figure 7‑16: Average Selling Price by Region, Articulating Hand Instrument Market, Global, 2022 – 2032 (US$) |
| Figure 7‑17: Market Value by Region, Articulating Hand Instrument Market, Global, 2022 – 2032 (US$M) |
| Figure 7‑18: Leading Competitors, Hand Instrument Market, Global, 2025 |
| Figure 8‑1: Insufflation Device Markets Covered |
| Figure 8‑2: Insufflation Regions Covered, Global (1 of 2) |
| Figure 8‑3: Insufflation Regions Covered, Global (2 of 2) |
| Figure 8‑4: Insufflation Device Market by Segment, Global, 2022 – 2032 (US$M) |
| Figure 8‑5: Insufflation Device Market by Region, Global, 2022 – 2032 (US$M) |
| Figure 8‑6: Total Insufflation Device Market, Global, 2022 – 2032 |
| Figure 8‑7: Units Sold by Region, Total Insufflation Device Market, Global, 2022 – 2032 |
| Figure 8‑8: Average Selling Price by Region, Total Insufflation Device Market, Global, 2022 – 2032 (US$) |
| Figure 8‑9: Market Value by Region, Total Insufflation Device Market, Global, 2022 – 2032 (US$M) |
| Figure 8‑10: Insufflator Market, Global, 2022 – 2032 |
| Figure 8‑11: Units Sold by Region, Insufflator Market, Global, 2022 – 2032 |
| Figure 8‑12: Average Selling Price by Region, Insufflator Market, Global, 2022 – 2032 (US$) |
| Figure 8‑13: Market Value by Region, Insufflator Market, Global, 2022 – 2032 (US$M) |
| Figure 8‑14: Insufflator Tubing Market by Segment, Global, 2022 – 2032 (US$M) |
| Figure 8‑15: Total Insufflation Tubing Market, Global, 2022 – 2032 |
| Figure 8‑16: Units Sold by Region, Total Insufflation Tubing Market, Global, 2022 – 2032 |
| Figure 8‑17: Average Selling Price by Region, Total Insufflation Tubing Market, Global, 2022 – 2032 (US$) |
| Figure 8‑18: Market Value by Region, Total Insufflation Tubing Market, Global, 2022 – 2032 (US$M) |
| Figure 8‑19: Standard Insufflator Tubing Market, Global, 2022 – 2032 |
| Figure 8‑20: Units Sold by Region, Standard Insufflator Tubing Market, Global, 2022 – 2032 |
| Figure 8‑21: Average Selling Price by Region, Standard Insufflator Tubing Market, Global, 2022 – 2032 (US$) |
| Figure 8‑22: Market Value by Region, Standard Insufflator Tubing Market, Global, 2022 – 2032 (US$M) |
| Figure 8‑23: Heated Insufflator Tubing Market, Global, 2022 – 2032 |
| Figure 8‑24: Units Sold by Region, Heated Insufflator Tubing Market, Global, 2022 – 2032 |
| Figure 8‑25: Average Selling Price by Region, Heated Insufflator Tubing Market, Global, 2022 – 2032 (US$) |
| Figure 8‑26: Market Value by Region, Heated Insufflator Tubing Market, Global, 2022 – 2032 (US$M) |
| Figure 8‑27: Smoke Evacuation Insufflator Tubing Market, Global, 2022 – 2032 |
| Figure 8‑28: Units Sold by Region, Smoke Evacuation Insufflator Tubing Market, Global, 2022 – 2032 |
| Figure 8‑29: Average Selling Price by Region, Smoke Evacuation Insufflator Tubing, Global, 2022 – 2032 (US$) |
| Figure 8‑30: Market Value by Region, Smoke Evacuation Insufflator Tubing Market, Global, 2022 – 2032 (US$M) |
| Figure 8‑31: Veress Needle Market, Global, 2022 – 2032 |
| Figure 8‑32: Units Sold by Region, Veress Needle Market, Global, 2022 – 2032 |
| Figure 8‑33: Average Selling Price by Region, Veress Needle Market, Global, 2022 – 2032 (US$) |
| Figure 8‑34: Market Value by Region, Veress Needle Market, Global, 2022 – 2032 (US$M) |
| Figure 8‑35: Leading Competitors, Insufflation Device Market, Global, 2025 |
| Figure 9‑1: Suction-Irrigation Device Markets Covered |
| Figure 9‑2: Suction-Irrigation Device Regions Covered, Global (1 of 2) |
| Figure 9‑3: Suction-Irrigation Device Regions Covered, Global (2 of 2) |
| Figure 9‑4: Suction-Irrigation Device Market by Segment, Global, 2022 – 2032 (US$M) |
| Figure 9‑5: Suction-Irrigation Device Market by Region, Global, 2022 – 2032 (US$M) |
| Figure 9‑6: Suction-Irrigation Device Market, Global, 2022 – 2032 |
| Figure 9‑7: Units Sold by Region, Suction-Irrigation Device Market, Global, 2022 – 2032 |
| Figure 9‑8: Average Selling Price by Region, Suction-Irrigation Device Market, Global, 2022 – 2032 (US$) |
| Figure 9‑9: Market Value by Region, Suction-Irrigation Device Market, Global, 2022 – 2032 (US$M) |
| Figure 9‑10: Disposable Kit Market, Global, 2022 – 2032 |
| Figure 9‑11: Units Sold by Region, Disposable Kit Market, Global, 2022 – 2032 |
| Figure 9‑12: Average Selling Price by Region, Disposable Kit Market, Global, 2022 – 2032 (US$) |
| Figure 9‑13: Market Value by Region, Disposable Kit Market, Global, 2022 – 2032 (US$M) |
| Figure 9‑14: Reusable Tip Market, Global, 2022 – 2032 |
| Figure 9‑15: Units Sold by Region, Reusable Tip Market, Global, 2022 – 2032 |
| Figure 9‑16: Average Selling Price by Region, Reusable Tip Market, Global, 2022 – 2032 (US$) |
| Figure 9‑17: Market Value by Region, Reusable Tip Market, Global, 2022 – 2032 (US$M) |
| Figure 9‑18: Suction-Irrigation Pump Market, Global, 2022 – 2032 |
| Figure 9‑19: Units Sold by Region, Suction-Irrigation Pump Market, Global, 2022 – 2032 |
| Figure 9‑20: Average Selling Price by Region, Suction-Irrigation Pump Market, Global, 2022 – 2032 (US$) |
| Figure 9‑21: Market Value by Region, Suction-Irrigation Pump Market, Global, 2022 – 2032 (US$M) |
| Figure 9‑22: Leading Competitors, Suction-Irrigation Device Market, Global, 2025 |
| Figure 10‑1: Direct Energy Device Markets Covered |
| Figure 10‑2: Direct Energy Device Regions Covered, Global (1 of 2) |
| Figure 10‑3: Direct Energy Device Regions Covered, Global (2 of 2) |
| Figure 10‑4: Direct Energy Device Market by Segment, Global, 2022 – 2032 (US$M) |
| Figure 10‑5: Direct Energy Device Market by Region, Global, 2022 – 2032 (US$M) |
| Figure 10‑6: Direct Energy Device Market, Global, 2022 – 2032 |
| Figure 10‑7: Units Sold by Region, Direct Energy Device Market, Global, 2022 – 2032 |
| Figure 10‑8: Average Selling Price by Region, Direct Energy Device Market, Global, 2022 – 2032 (US$) |
| Figure 10‑9: Market Value by Region, Direct Energy Device Market, Global, 2022 – 2032 (US$M) |
| Figure 10‑10: Bipolar Direct Energy Device Market, Global, 2022 – 2032 |
| Figure 10‑11: Units Sold by Region, Bipolar Direct Energy Device Market, Global, 2022 – 2032 |
| Figure 10‑12: Average Selling Price by Region, Bipolar Direct Energy Device Market, Global, 2022 – 2032 (US$) |
| Figure 10‑13: Market Value by Region, Bipolar Direct Energy Device Market, Global, 2022 – 2032 (US$M) |
| Figure 10‑14: Monopolar Electrode Market, Global, 2022 – 2032 |
| Figure 10‑15: Units Sold by Region, Monopolar Electrode Market, Global, 2022 – 2032 |
| Figure 10‑16: Average Selling Price by Region, Monopolar Electrode Market, Global, 2022 – 2032 (US$) |
| Figure 10‑17: Market Value by Region, Monopolar Electrode Market, Global, 2022 – 2032 (US$M) |
| Figure 10‑18: Electrosurgical Generator Market, Global, 2022 – 2032 |
| Figure 10‑19: Units Sold by Region, Electrosurgical Generator Market, Global, 2022 – 2032 |
| Figure 10‑20: Average Selling Price by Region, Electrosurgical Generator Market, Global, 2022 – 2032 (US$) |
| Figure 10‑21: Market Value by Region, Electrosurgical Generator Market, Global, 2022 – 2032 (US$M) |
| Figure 10‑22: Leading Competitors, Direct Energy Device Market, Global, 2025 |
| Figure 11‑1: Ultrasonic Device Markets Covered |
| Figure 11‑2: Ultrasonic Regions Covered, Global (1 of 2) |
| Figure 11‑3: Ultrasonic Regions Covered, Global (2 of 2) |
| Figure 11‑4: Ultrasonic Device Market by Segment, Global, 2022 – 2032 (US$M) |
| Figure 11‑5: Ultrasonic Device Market by Region, Global, 2022 – 2032 (US$M) |
| Figure 11‑6: Total Ultrasonic Device Market, Global, 2022 – 2032 |
| Figure 11‑7: Units Sold by Region, Total Ultrasonic Device Market, Global, 2022 – 2032 |
| Figure 11‑8: Average Selling Price by Region, Total Ultrasonic Device Market, Global, 2022 – 2032 (US$) |
| Figure 11‑9: Market Value by Region, Total Ultrasonic Device Market, Global, 2022 – 2032 (US$M) |
| Figure 11‑10: Total Ultrasonic Instrument Market, Global, 2022 – 2032 |
| Figure 11‑11: Units Sold by Region, Ultrasonic Instrument Market, Global, 2022 – 2032 |
| Figure 11‑12: Average Selling Price by Region, Ultrasonic Instrument Market, Global, 2022 – 2032 (US$) |
| Figure 11‑13: Market Value by Region, Ultrasonic Instrument Market, Global, 2022 – 2032 (US$M) |
| Figure 11‑14: Ultrasonic Generator Market, Global, 2022 – 2032 |
| Figure 11‑15: Units Sold by Region, Ultrasonic Generator Market, Global, 2022 – 2032 |
| Figure 11‑16: Average Selling Price by Region, Ultrasonic Generator Market, Global, 2022 – 2032 (US$) |
| Figure 11‑17: Market Value by Region, Ultrasonic Generator Market, Global, 2022 – 2032 (US$M) |
| Figure 11‑18: Leading Competitors, Ultrasonic Device Market, Global, 2025 |
| Figure 12‑1: Hand-Assisted Laparoscopic Sleeve Regions Covered, Global (1 of 2) |
| Figure 12‑2: Hand-Assisted Laparoscopic Sleeve Regions Covered, Global (2 of 2) |
| Figure 12‑3: Hand-Assisted Laparoscopic Sleeve Market, Global, 2022 – 2032 |
| Figure 12‑4: Units Sold by Region, Hand-Assisted Laparoscopic Sleeve Market, Global, 2022 – 2032 |
| Figure 12‑5: Average Selling Price by Region, Hand-Assisted Laparoscopic Sleeve Market, Global, 2022 – 2032 (US$) |
| Figure 12‑6: Market Value by Region, Hand-Assisted Laparoscopic Sleeve Market, Global, 2022 – 2032 (US$M) |
| Figure 12‑7: Leading Competitors, Hand-Assisted Laparoscopic Sleeve Market, Global, 2025 |
| Figure 13‑1: Closure Device Markets Covered |
| Figure 13‑2: Closure Device Regions Covered, Global (1 of 2) |
| Figure 13‑3: Closure Device Regions Covered, Global (2 of 2) |
| Figure 13‑4: Closure Device Market by Segment, Global, 2022 – 2032 (US$M) |
| Figure 13‑5: Closure Device Market by Region, Global, 2022 – 2032 (US$M) |
| Figure 13‑6: Total Closure Device Market, Global, 2022 – 2032 |
| Figure 13‑7: Units Sold by Region, Total Closure Device Market, Global, 2022 – 2032 |
| Figure 13‑8: Average Selling Price by Region, Total Closure Device Market, Global, 2022 – 2032 (US$) |
| Figure 13‑9: Market Value by Region, Total Closure Device Market, Global, 2022 – 2032 (US$M) |
| Figure 13‑10: Endosuturing Device Market, Global, 2022 – 2032 |
| Figure 13‑11: Units Sold by Region, Endosuturing Device Market, Global, 2022 – 2032 |
| Figure 13‑12: Average Selling Price by Region, Endosuturing Device Market, Global, 2022 – 2032 (US$) |
| Figure 13‑13: Market Value by Region, Endosuturing Device Market, Global, 2022 – 2032 (US$M) |
| Figure 13‑14: Total Stapler Market by Segment, Global, 2022 – 2032 (US$M) |
| Figure 13‑15: Total Stapler Market, Global, 2022 – 2032 |
| Figure 13‑16: Units Sold by Region, Total Stapler Market, Global, 2022 – 2032 |
| Figure 13‑17: Average Selling Price by Region, Total Stapler Market, Global, 2022 – 2032 (US$) |
| Figure 13‑18: Market Value by Region, Total Stapler Market, Global, 2022 – 2032 (US$M) |
| Figure 13‑19: Staple Firing Gun Market, Global, 2022 – 2032 |
| Figure 13‑20: Units Sold by Region, Staple Firing Gun Market, Global, 2022 – 2032 |
| Figure 13‑21: Average Selling Price by Region, Staple Firing Gun Market, Global, 2022 – 2032 (US$) |
| Figure 13‑22: Market Value by Region, Staple Firing Gun Market, Global, 2022 – 2032 (US$M) |
| Figure 13‑23: Staple Cartridge Market, Global, 2022 – 2032 |
| Figure 13‑24: Units Sold by Region, Staple Cartridge Market, Global, 2022 – 2032 |
| Figure 13‑25: Average Selling Price by Region, Staple Cartridge Market, Global, 2022 – 2032 (US$) |
| Figure 13‑26: Market Value by Region, Staple Cartridge Market, Global, 2022 – 2032 (US$M) |
| Figure 13‑27: Clip Applier Market, Global, 2022 – 2032 |
| Figure 13‑28: Units Sold by Region, Clip Applier Market, Global, 2022 – 2032 |
| Figure 13‑29: Average Selling Price by Region, Clip Applier Market, Global, 2022 – 2032 (US$) |
| Figure 13‑30: Market Value by Region, Clip Applier Market, Global, 2022 – 2032 (US$M) |
| Figure 13‑31: Leading Competitors, Closure Device Market, Global, 2025 |
| Figure 14‑1: Gastric Devices Markets Covered |
| Figure 14‑2: Gastric Device Regions Covered, Global (1 of 2) |
| Figure 14‑3: Gastric Device Regions Covered, Global (2 of 2) |
| Figure 14‑4: Gastric Device Market by Segment, Global, 2022 – 2032 (US$M) |
| Figure 14‑5: Gastric Device Market by Region, Global, 2022 – 2032 (US$M) |
| Figure 14‑6: Total Gastric Device Market, Global, 2022 – 2032 |
| Figure 14‑7: Units Sold by Region, Gastric Device Market, Global, 2022 – 2032 |
| Figure 14‑8: Average Selling Price by Region, Gastric Device Market, Global, 2022 – 2032 (US$) |
| Figure 14‑9: Market Value by Region, Gastric Device Market, Global, 2022 – 2032 (US$M) |
| Figure 14‑10: Gastric Band Market, Global, 2022 – 2032 |
| Figure 14‑11: Units Sold by Region, Gastric Band Market, Global, 2022 – 2032 |
| Figure 14‑12: Average Selling Price by Region, Gastric Band Market, Global, 2022 – 2032 (US$) |
| Figure 14‑13: Market Value by Region, Gastric Band Market, Global, 2022 – 2032 (US$M) |
| Figure 14‑14: Gastric Balloon Market, Global, 2022 – 2032 |
| Figure 14‑15: Units Sold by Region, Gastric Balloon Market, Global, 2022 – 2032 |
| Figure 14‑16: Average Selling Price by Region, Gastric Balloon Market, Global, 2022 – 2032 (US$) |
| Figure 14‑17: Market Value by Region, Gastric Balloon Market, Global, 2022 – 2032 (US$M) |
| Figure 14‑18: Leading Competitors, Gastric Device Market, Global, 2025 |
| Figure 15‑1: Powered Morcellator Markets Covered |
| Figure 15‑2: Powered Morcellator Regions Covered, Global (1 of 2) |
| Figure 15‑3: Powered Morcellator Regions Covered, Global (2 of 2) |
| Figure 15‑4: Powered Morcellator Market by Segment, Global, 2022 – 2032 (US$M) |
| Figure 15‑5: Powered Morcellator Market by Region, Global, 2022 – 2032 (US$M) |
| Figure 15‑6: Powered Morcellator Market, Global, 2022 – 2032 |
| Figure 15‑7: Units Sold by Region, Powered Morcellator Market, Global, 2022 – 2032 |
| Figure 15‑8: Average Selling Price by Region, Powered Morcellator Market, Global, 2022 – 2032 (US$) |
| Figure 15‑9: Market Value by Region, Powered Morcellator Market, Global, 2022 – 2032 (US$M) |
| Figure 15‑10: Disposable Powered Morcellator Market, Global, 2022 – 2032 |
| Figure 15‑11: Units Sold by Region, Disposable Powered Morcellator Market, Global, 2022 – 2032 |
| Figure 15‑12: Average Selling Price by Region, Disposable Powered Morcellator Market, Global, 2022 – 2032 (US$) |
| Figure 15‑13: Market Value by Region, Disposable Powered Morcellator Market, Global, 2022 – 2032 (US$M) |
| Figure 15‑14: Reposable Powered Morcellator Market, Global, 2022 – 2032 |
| Figure 15‑15: Units Sold by Region, Reposable Powered Morcellator Market, Global, 2022 – 2032 |
| Figure 15‑16: Average Selling Price by Region, Reposable Powered Morcellator Market, Global, 2022 – 2032 (US$) |
| Figure 15‑17: Market Value by Region, Reposable Powered Morcellator Market, Global, 2022 – 2032 (US$M) |
| Figure 15‑18: Leading Competitors, Powered Morcellator Market, Global, 2025 |