
Implantable Port Market Size, Share, & Trends Analysis | Global | 2026-2032 | MedCore | Includes: Power-Injectable and Non-Power-Injectable Ports

  • Year: 2026
  • Scope: 10 Years
  • Region: Global
  • Published Date: 12/31/2025
  • Type: MedCore

Product Description

The global implantable port market was valued slightly above $430 million in 2025. This is expected to increase over the forecast period at a CAGR of 3% to reach approximately $530 million by 2032.

The full report suite on the global market for implantable ports includes non-power-injectable and power-injectable implantable ports. Power-injectable implantable ports are capable of withstanding higher pressures than non-power-injectable implantable ports in order to facilitate the injection of contrast dye for computed tomography (CT) scan procedures. If a patient has a conventional implantable port and requires a medical scan, the port must be removed and replaced with a power-injectable port.

The report includes data for 65 countries across 7 different regions which include North America, Latin America, Western Europe, Central & Eastern Europe, Middle East, Asia-Pacific, and Africa.

Data Types Included

  • Unit SalesAverage Selling PricesMarket Size & Growth Trends
  • Market Drivers & Limiters
  • Procedure Numbers
  • Market Forecasts Until 2032, and Historical Data to 2022
  • Recent Mergers & Acquisitions
  • Company Profiles and Product Portfolios
  • Leading Competitors

Global Implantable Port Market Trends
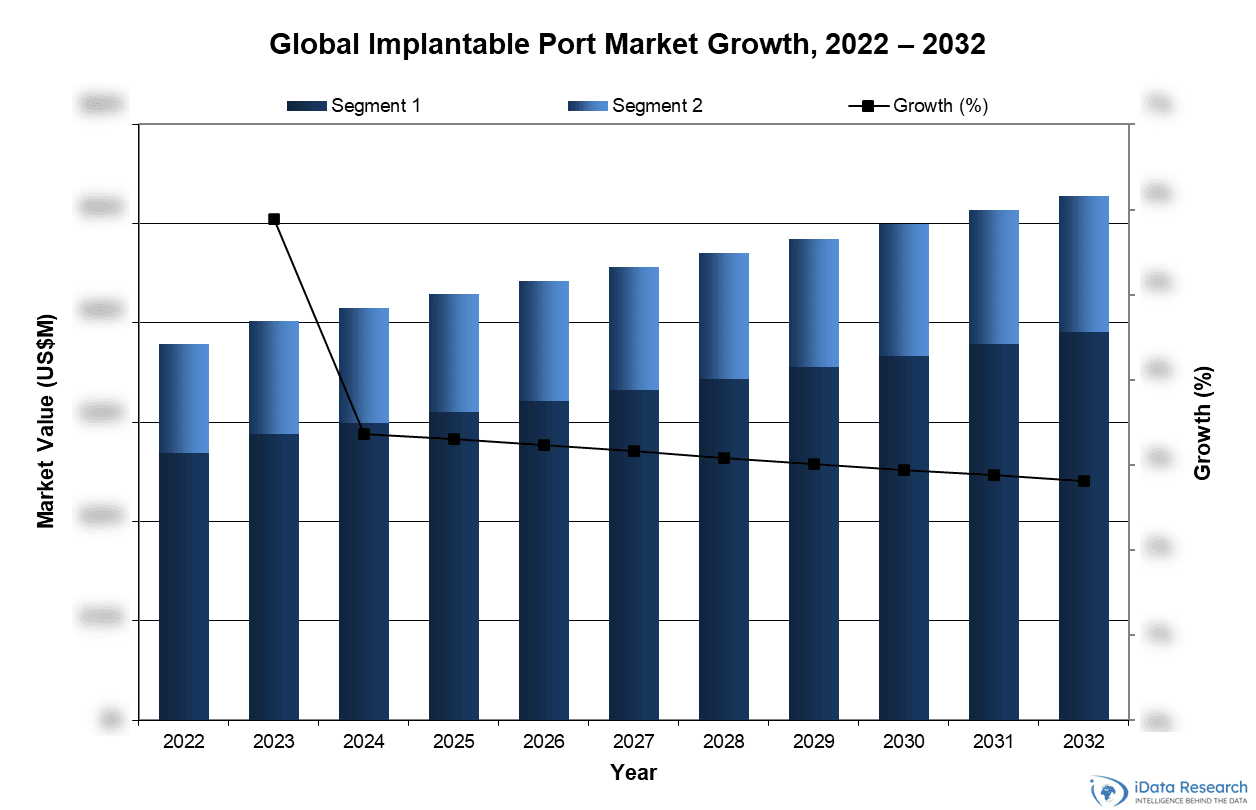
Global Implantable Port Market Growth, 2022-2032

The global market for implantable ports has expanded its segmentation to include valved and non-valved ports. Valved ports incorporate a built-in mechanism designed to minimize blood reflux and reduce the risk of occlusion, which can improve patient safety and device longevity. These ports are particularly advantageous for patients requiring long-term venous access, as the valve mechanism can lower the incidence of catheter-related complications. Non-valved ports, on the other hand, remain widely used due to their lower cost and simpler design, though they generally require additional flushing protocols and carry a higher risk of clot formation. Over the forecast period, growth in the adoption of valved ports is anticipated, driven by their clinical benefits, despite continued utilization of non-valved devices in cost-sensitive healthcare settings.

Global Implantable Port Market Share Insights

Top Global Implantable Port Market Leaders

  • Becton Dickinson (BD) maintained its leadership in the implantable port market in 2025 through its PowerPort® line, including the compact titanium PowerPort® Slim and the PowerPort® MRI®, designed to reduce imaging interference. The portfolio also covers non-power-injectable solutions such as the SlimPort™ Dual-Lumen Rosenblatt™ for multi-medication infusion and the X-Port™ for smaller patients. BD further differentiates its products with valved systems such as AirGuard™ and Groshong™, which reduce blood reflux and complications, while still offering non-valved options for cost-sensitive markets. From a device properties perspective, BD’s ports remain largely conventional, without dedicated antithrombogenic coatings, though the company emphasizes antimicrobial innovations. This broad range spanning power versus non-power, valved versus non-valved and single versus dual-lumen options positions BD as the most comprehensive provider of implantable ports globally.
  • AngioDynamics captured a significant share of the global implantable port market in 2025, offering products such as Xcela® Plus, BioFlo®, Smart Port®, Vortex®, LifePort®, TitanPort® and Triumph-1®. It introduced the innovative Smart Port CT™ with integrated Vortex® technology to enhance drainage and minimize catheter occlusion and infection risk. While the BioFlo® technology was successful in preventing thrombus formation, the discontinuation of Morpheus® PICC impacted its PICC sales more than its port sales. Also, The BioFlo Port with Endexo Technology, providing a catheter material more resistant to the in-vitro accumulation of blood components compared with non-coated port catheters
  • ICU Medical held the third-largest position among competitors in the implantable port market in 2025. Its PORT-A-CATH® brand is widely recognized, featuring a hybrid polysulfone/titanium construction in the newer PORT-A-CATH II® model, making it MRI-safe and durable. Additionally, ICU Medical offers a hybrid A. S. PORT® arm series and power-injectable ports for chest or arm placement. However, arm ports have not gained as much popularity as initially anticipated due to the risk of catheter pinching based on patient movement and positioning. In 2025, ICU Medical announced that certain models of ProPort should not be used immediately and were recalled due to the potential separation of the plastic housing from the port reservoir. The Food and Drug Administration (FDA) also confirmed this recall, noting that the issue had resulted in patient injuries and posed a significant safety risk.

Global Implantable Port Market Segmentation Summary

  • Implantable Port Market – Further Segmented Into:
    • Device Type: Power-Injectable and Non-Power-Injectable.
    • Care Setting: Valved and Non-Valved.
    • Device Properties: Antithrombogenic and Conventional.

Research Scope Summary

Report Attribute Details
Regions North America  (Canada, United States)
Latin America  (Argentina, Bolivia, Brazil, Chile, Colombia, Costa Rica, Dominican Republic, Ecuador, Guatemala, Mexico, Panama, Paraguay, Peru, Puerto Rico, Uruguay, Venezuela)
Western Europe  (Austria, Benelux, France, Germany, Italy, Portugal, Scandinavia, Spain, Switzerland, United Kingdom)
Central & Eastern Europe  (Azerbaijan, Baltic States, Belarus, Bulgaria, Croatia, Czech Republic, Georgia, Greece, Hungary, Kazakhstan, Poland, Romania, Russia, Serbia, Slovakia, Slovenia, Turkey, Ukraine)
Middle East  (Bahrain, Iran, Israel, Kuwait, Oman, Qatar, Saudi Arabia, United Arab Emirates)
Asia Pacific  (Australia, Cambodia, China, Hong Kong, India, Indonesia, Japan, Kyrgyzstan, Macao, Malaysia, Mongolia, Myanmar, New Zealand, Pakistan, Philippines, Singapore, South Korea, Sri Lanka, Taiwan, Thailand, Uzbekistan, Vietnam)
Africa  (Algeria, Egypt, Ethiopia, Ghana, Kenya, Libya, Morocco, Nigeria, South Africa, Sudan, Uganda)
Base Year 2025
Forecast 2026-2032
Historical Data 2022-2024
Quantitative Coverage Procedure Numbers, Market Size, Market Shares, Market Forecasts, Market Growth Rates, Units Sold, and Average Selling Prices.
Qualitative Coverage Market Growth Trends, Market Limiters, Competitive Analysis & SWOT for Top Competitors, Mergers & Acquisitions, Company Profiles, Product Portfolios, FDA Recalls, Disruptive Technologies, Disease Overviews.
Data Sources Primary Interviews with Industry Leaders, Government Physician Data, Regulatory Data, Hospital Private Data, Import & Export Data,  iData Research Internal Database.

CONTACT US FOR ADDITIONAL INFORMATION

For full segmentation and any questions regarding research coverage, please contact us for a complimentary demo of the full report.


FREE Sample Report

Table of Contents

List Of Figures
List Of Charts
Research Methodology
Step 1: Project Initiation & Team Selection
Step 2: Prepare Data Systems And Perform Secondary Research
Step 3: Preparation For Interviews & Questionnaire Design
Step 4: Performing Primary Research
Step 5: Research Analysis: Establishing Baseline Estimates
Step 6: Market Forecast And Analysis
Step 7: Identify Strategic Opportunities
Step 8: Final Review And Market Release
Step 9: Customer Feedback And Market Monitoring
Impact Of Global Tariffs
Implantable Port Market
4.1 Executive Summary
4.1.1 Global Implantable Port Market Overview
4.1.2 Competitive Analysis
4.1.3 Procedures Included
4.1.4 Markets Included
4.1.5 Regions Included
4.2 Introduction
4.3 Procedure Numbers
4.3.1 Total Implantable Port Procedures
4.3.1.1 Power-Injectable Procedures
4.3.1.2 Non-Power-Injectable Procedures
4.4 Market Overview
4.4.1 By Segment
4.4.2 By Valve Type
4.4.3 By Device Properties
4.4.4 By Region
4.5 Market Analysis And Forecast
4.5.1 Total Implantable Port Market
4.5.2 Implantable Port Market By Segment
4.5.2.1 Power-Injectable Implantable Port Market
4.5.2.2 Non-Power-Injectable Implantable Port Market
4.5.3 Implantable Port Market By Lumen Count
4.5.3.1 Single-Lumen Implantable Port Market
4.5.3.2 Double-Lumen Implantable Port Market Implantable Port Market
4.5.4 Implantable Port Market By Valve Type
4.5.4.1 Valved Implantable Port Market
4.5.4.2 Non-Valved Implantable Port Market
4.5.5 Implantable Port Market By Device Properties
4.5.5.1 Antithrombogenic Implantable Port Market
4.5.5.2 Conventional Implantable Port Market
4.6 Drivers And Limiters
4.6.1 Market Drivers
4.6.2 Market Limiters
4.7 Competitive Market Share Analysis
Abbreviations

Companies Included

Adhezion Biomedical Medical Plastic Devices Inc.
Applied Medical Technology Medcomp
AngioDynamics Medicina
Argon Medical Medikit
B. Braun Medline
Baxter International MedSource
Becton Dickinson Medtronic
BioLife Menarini
Bionic Merit Medical
Cambridge Sensors Mermaid Medical
Cardinal Health
Micsafe Med
Catheter Connections MPS Medical
Centurion Medical Multimedical
Codan NeedleBay
Cook Medical Neo Medical
Deltamed Neon Diagnostics
DeRoyal
Nipro Medical
Districlass Medical Nova Medical
Exel International Novico
Fannin Owen Mumford Inc.
Fresenius
Pentaferte
GlucoRx PFM Medical
Greiner Bio-One Polimed
Health Line Medical Products Prosum Medical
HEKA Healthcare
Rays
Hollister Incorporated Retractable Technologies
HTL-STREFA
Roche
ICU Medical Sentra Medical
IME-DC SFM
Interrad Medical Smith & Nephew
Johnson & Johnson
Solventum
Joline Spectrum Vascular
Kawasumi
SPRINT MOTO
Kimal
Trinity Sterile
Klinion Troge
Marvao Medical V-Tech
Matz Medical Vortex
M.C. Johnson Vygon
Marvao Medical Ypsomed
Matz Medical


Chart List

Chart 4-1: Implantable Port Market, Global, 2025 & 2032
Chart 4-2: Implantable Port Procedures, Global, 2025
Chart 4-3: Implantable Port Procedures By Region, Global, 2022 – 2032
Chart 4-4: Implantable Port Market By Segment, Global, 2022 – 2032
Chart 4-5: Implantable Port Market By Region, Global, 2022 – 2032
Chart 4-6: Leading Competitors, Implantable Port Market, Global, 2025

Figure List

Figure 4-1: Implantable Port Procedures Covered
Figure 4-2: Implantable Port Markets Covered
Figure 4-3: Implantable Port Regions Covered, Global (1 Of 2)
Figure 4-4: Implantable Port Regions Covered, Global (2 Of 2)
Figure 4-5: Implantable Port Procedures By Region, Global, 2022 – 2032
Figure 4-6: Implantable Port Procedures By Country, North America, 2022 – 2032
Figure 4-7: Implantable Port Procedures By Country, Latin America, 2022 – 2032 (1 Of 2)
Figure 4-8: Implantable Port Procedures By Country, Latin America, 2022 – 2032 (2 Of 2)
Figure 4-9: Implantable Port Procedures By Country, Western Europe, 2022 – 2032
Figure 4-10: Implantable Port Procedures By Country, Central & Eastern Europe, 2022 – 2032 (1 Of 2)
Figure 4-11: Implantable Port Procedures By Country, Central & Eastern Europe, 2022 – 2032 (2 Of 2)
Figure 4-12: Implantable Port Procedures By Country, Middle East, 2022 – 2032
Figure 4-13: Implantable Port Procedures By Country, Asia-Pacific, 2022 – 2032 (1 Of 3)
Figure 4-14: Implantable Port Procedures By Country, Asia-Pacific, 2022 – 2032 (2 Of 3)
Figure 4-15: Implantable Port Procedures By Country, Asia-Pacific, 2022 – 2032 (3 Of 3)
Figure 4-16: Implantable Port Procedures By Country, Africa, 2022 – 2032
Figure 4-17: Power-Injectable Procedures By Region, Global, 2022 – 2032
Figure 4-18: Power-Injectable Procedures By Country, North America, 2022 – 2032
Figure 4-19: Power-Injectable Procedures By Country, Latin America, 2022 – 2032 (1 Of 2)
Figure 4-20: Power-Injectable Procedures By Country, Latin America, 2022 – 2032 (2 Of 2)
Figure 4-21: Power-Injectable Procedures By Country, Western Europe, 2022 – 2032
Figure 4-22: Power-Injectable Procedures By Country, Central & Eastern Europe, 2022 – 2032 (1 Of 2)
Figure 4-23: Power-Injectable Procedures By Country, Central & Eastern Europe, 2022 – 2032 (2 Of 2)
Figure 4-24: Power-Injectable Procedures By Country, Middle East, 2022 – 2032
Figure 4-25: Power-Injectable Procedures By Country, Asia-Pacific, 2022 – 2032 (1 Of 3)
Figure 4-26: Power-Injectable Procedures By Country, Asia-Pacific, 2022 – 2032 (2 Of 3)
Figure 4-27: Power-Injectable Procedures By Country, Asia-Pacific, 2022 – 2032 (3 Of 3)
Figure 4-28: Power-Injectable Procedures By Country, Africa, 2022 – 2032
Figure 4-29: Non-Power-Injectable Procedures By Region, Global, 2022 – 2032
Figure 4-30: Non-Power-Injectable Procedures By Country, North America, 2022 – 2032
Figure 4-31: Non-Power-Injectable Procedures By Country, Latin America, 2022 – 2032 (1 Of 2)
Figure 4-32: Non-Power-Injectable Procedures By Country, Latin America, 2022 – 2032 (2 Of 2)
Figure 4-33: Non-Power-Injectable Procedures By Country, Western Europe, 2022 – 2032
Figure 4-34: Non-Power-Injectable Procedures By Country, Central & Eastern Europe, 2022 – 2032 (1 Of 2)
Figure 4-35: Non-Power-Injectable Procedures By Country, Central & Eastern Europe, 2022 – 2032 (2 Of 2)
Figure 4-36: Non-Power-Injectable Procedures By Country, Middle East, 2022 – 2032
Figure 4-37: Non-Power-Injectable Procedures By Country, Asia-Pacific, 2022 – 2032 (1 Of 3)
Figure 4-38: Non-Power-Injectable Procedures By Country, Asia-Pacific, 2022 – 2032 (2 Of 3)
Figure 4-39: Non-Power-Injectable Procedures By Country, Asia-Pacific, 2022 – 2032 (3 Of 3)
Figure 4-40: Non-Power-Injectable Procedures By Country, Africa, 2022 – 2032
Figure 4-41: Implantable Port Market By Segment, Global, 2022 – 2032 (US$M)
Figure 4-42: Implantable Port Market By Valve Type, Global, 2022 – 2032 (US$M)
Figure 4-43: Implantable Port Market By Device Properties, Global, 2022 – 2032 (US$M)
Figure 4-44: Implantable Port Market By Region, Global, 2022 – 2032 (US$M)
Figure 4-45: Implantable Port Maret, Global, 2022 – 2032
Figure 4-46: Units Sold By Region, Implantable Port Market, Global, 2022 – 2032
Figure 4-47: Average Selling Price By Region, Implantable Port Market, Global, 2022 – 2032 (US$)
Figure 4-48: Market Value By Region, Implantable Port Market, Global, 2022 – 2032 (US$M)
Figure 4-49: Units Sold By Region, Power-Injectable Implantable Port Market, Global, 2022 – 2032
Figure 4-50: Average Selling Price By Region, Power-Injectable Implantable Port Market, Global, 2022 – 2032 (US$)
Figure 4-51: Market Value By Region, Power-Injectable Implantable Port Market, Global, 2022 – 2032 (US$M)
Figure 4-52: Power Injectable Implantable Port Market, Global, 2022 – 2032
Figure 4-53: Units Sold By Region, Power-Injectable Implantable Port Market, Global, 2022 – 2032
Figure 4-54: Average Selling Price By Region, Power-Injectable Implantable Port Market, Global, 2022 – 2032 (US$)
Figure 4-55: Market Value By Region, Power-Injectable Implantable Port Market, Global, 2022 – 2032 (US$M)
Figure 4-56: Total Non-Power Injectable Implantable Port Market, Global, 2022 – 2032
Figure 4-57: Units Sold By Region, Non-Power-Injectable Implantable Port Market, Global, 2022 – 2032
Figure 4-58: Average Selling Price By Region, Non-Power-Injectable Implantable Port Market, Global, 2022 – 2032 (US$)
Figure 4-59: Market Value By Region, Non-Power-Injectable Implantable Port Market, Global, 2022 – 2032 (US$M)
Figure 4-60: Total Single-Lumen Implantable Port Market, Global, 2022 – 2032
Figure 4-61: Units Sold By Region, Single-Lumen Implantable Port Market, Global, 2022 – 2032
Figure 4-62: Average Selling Price By Region, Single-Lumen Implantable Port Market, Global, 2022 – 2032 (US$)
Figure 4-63: Market Value By Region, Single-Lumen Implantable Port Market, Global, 2022 – 2032 (US$M)
Figure 4-64: Total Double-Lumen Implantable Port Market, Global, 2022 – 2032
Figure 4-65: Units Sold By Region, Double-Lumen Implantable Port Market, Global, 2022 – 2032
Figure 4-66: Average Selling Price By Region, Double-Lumen Implantable Port Market, Global, 2022 – 2032 (US$)
Figure 4-67: Market Value By Region, Double-Lumen Implantable Port Market, Global, 2022 – 2032 (US$M)
Figure 4-68: Total Implantable Port By Valved Type Market, Global, 2022 – 2032
Figure 4-69: Units Sold By Region, Implantable Port By Valved Type Market, Global, 2022 – 2032
Figure 4-70: Average Selling Price By Region, Implantable Port By Valved Type Market, Global, 2022 – 2032 (US$)
Figure 4-71: Market Value By Region, Implantable Port By Valved Type Market, Global, 2022 – 2032 (US$M)
Figure 4-72: Total Non-Valved Implantable Port Market, Global, 2022 – 2032
Figure 4-73: Units Sold By Region, Non-Valved Implantable Port Market, Global, 2022 – 2032
Figure 4-74: Average Selling Price By Region, Non-Valved Implantable Port Market, Global, 2022 – 2032 (US$)
Figure 4-75: Market Value By Region, Non-Valved Implantable Port Market, Global, 2022 – 2032 (US$M)
Figure 4-76: Total Antithrombogenic Implantable Port Market, Global, 2022 – 2032
Figure 4-77: Units Sold By Region, Antithrombogenic Implantable Port Market, Global, 2022 – 2032
Figure 4-78: Average Selling Price By Region, Antithrombogenic Implantable Port Market, Global, 2022 – 2032 (US$)
Figure 4-79: Market Value By Region, Antithrombogenic Implantable Port Market, Global, 2022 – 2032 (US$M)
Figure 4-80: Total Conventional Implantable Port Market, Global, 2022 – 2032
Figure 4-81: Units Sold By Region, Conventional Implantable Port Market, Global, 2022 – 2032
Figure 4-82: Average Selling Price By Region, Conventional Implantable Port Market, Global, 2022 – 2032 (US$)
Figure 4-83: Market Value By Region, Conventional Implantable Port Market, Global, 2022 – 2032 (US$M)
Figure 4-84: Leading Competitors, Implantable Port Market, Global, 2025

iData’s 9-Step Research Methodology

Our reports follow an in-depth 9-step methodology which focuses on the following research systems:

  • Original primary research that consists of the most up-to-date market data
  • Strong foundation of quantitative and qualitative research
  • Focused on the needs and strategic challenges of the industry participants

Step 1: Project Initiation & Team Selection During this preliminary investigation, all staff members involved in the industry discusses the topic in detail.

Step 2: Prepare Data Systems and Perform Secondary Research The first task of the research team is to prepare for the data collection process: Filing systems and relational databases are developed as needed.

Step 3: Preparation for Interviews & Questionnaire Design The core of all iData research reports is primary market research. Interviews with industry insiders represent the single most reliable way to obtain accurate, current data about market conditions, trends, threats and opportunities.

Step 4: Performing Primary Research At this stage, interviews are performed using contacts and information acquired in the secondary research phase.

Step 5: Research Analysis: Establishing Baseline Estimates Following the completion of the primary research phase, the collected information must be synthesized into an accurate view of the market status. The most important question is the current state of the market.

Step 6: Market Forecast and Analysis iData Research uses a proprietary method to combine statistical data and opinions of industry experts to forecast future market values.

Step 7: Identify Strategic Opportunities iData analysts identify in broad terms why some companies are gaining or losing share within a given market segment.

Step 8: Final Review and Market Release An integral part of the iData research methodology is a built-in philosophy of quality control and continuing improvement is integral to the iData philosophy.

Step 9: Customer Feedback and Market Monitoring iData philosophy of continuous improvement requires that reports and consulting projects be monitored after release for customer feedback and market accuracy.

Click Here to Read More About Our Methodology

Explore Report Options

Report Summary

FREE

Select License Type

Overall, the global implantable port market was valued slightly over $370 million in 2023. This is expected to increase over the forecast period at a CAGR of 2.8% to reach about $450 million.

  • 2026
  • 10 Years
  • Global
  • MedCore
  • 12/31/2025