| Figure 1‑1: ENT Endoscopic and Bronchoscopic Device Market Share Ranking by Segment, Global, 2022 (1 of 2) |
| Figure 1‑2: ENT Endoscopic and Bronchoscopic Device Market Share Ranking by Segment, Global, 2022 (2 of 2) |
| Figure 1‑3: Companies Researched in This Report |
| Figure 1‑4: Factors Impacting the ENT Endoscopic and Bronchoscopic Device Market by Segment, Global (1 of 2) |
| Figure 1‑5: Factors Impacting the ENT Endoscopic and Bronchoscopic Device Market by Segment, Global (2 of 2) |
| Figure 1‑6: Recent Events in the ENT Endoscopic and Bronchoscopic Device Market, Global, 2019 – 2022 |
| Figure 1‑7: ENT Endoscopic and Bronchoscopic Device Procedures Covered |
| Figure 1‑8: ENT Endoscopic and Bronchoscopic Device Markets Covered (1 of 3) |
| Figure 1‑9: ENT Endoscopic and Bronchoscopic Device Markets Covered (2 of 3) |
| Figure 1‑10: ENT Endoscopic and Bronchoscopic Device Markets Covered (3 of 3) |
| Figure 1‑11: ENT Endoscopic and Bronchoscopic Device Regions Covered, Global (1 of 2) |
| Figure 1‑12: ENT Endoscopic and Bronchoscopic Device Regions Covered, Global (2 of 2) |
| Figure 1‑13: Version History |
| Figure 2‑1: ENT Endoscopic and Bronchoscopic Device Market by Segment, Worst Case Scenario, Global, 2019 – 2029 (US$M) (1 of 2) |
| Figure 2‑2: ENT Endoscopic and Bronchoscopic Device Market by Segment, Worst Case Scenario, Global, 2019 – 2029 (US$M) (2 of 2) |
| Figure 2‑3: ENT Endoscopic and Bronchoscopic Device Market by Segment, Base Case Scenario, Global, 2019 – 2029 (US$M) (1 of 2) |
| Figure 2‑4: ENT Endoscopic and Bronchoscopic Device Market by Segment, Base Case Scenario, Global, 2019 – 2029 (US$M) (2 of 2) |
| Figure 2‑5: ENT Endoscopic and Bronchoscopic Device Market by Segment, Best Case Scenario, Global, 2019 – 2029 (US$M) (1 of 2) |
| Figure 2‑6: ENT Endoscopic and Bronchoscopic Device Market by Segment, Best Case Scenario, Global, 2019 – 2029 (US$M) (2 of 2) |
| Figure 4‑1: Single-Use Endoscope Devices by Company |
| Figure 4‑2: Rigid Laryngoscope Devices by Company (1 of 2) |
| Figure 4‑3: Rigid Laryngoscope Devices by Company (2 of 2) |
| Figure 4‑4: Flexible Laryngoscope Devices by Company |
| Figure 4‑5: Direct Laryngoscope Devices by Company |
| Figure 4‑6: Reusable Rhinoscopes/Sinuscopes by company |
| Figure 4‑7: Reusable Otoscopes by Company |
| Figure 4‑8: Powered Instruments, Capital Equipment Devices by Company |
| Figure 4‑9: Powered Instruments, Disposables Devices by Company |
| Figure 4‑10: Hand Instrument Devices by Company |
| Figure 4‑11: Surgical Energy Devices by Company |
| Figure 4‑12: Balloon Sinus Dilation Devices by Company |
| Figure 4‑13: Drug Eluting Stent Devices by Company |
| Figure 4‑14: Rigid Bronchoscope Devices by Company |
| Figure 4‑15: Flexible Bronchoscope Devices by Company |
| Figure 4‑16: Ultrasound Bronchoscope Devices by Company |
| Figure 4‑17: Single Use Bronchoscope Devices by Company |
| Figure 4‑18: Bronchoscopic Hand Instrument Devices by Company |
| Figure 4‑19: Metal Stent Devices by Company |
| Figure 4‑20: Silicone Stent Devices by Company |
| Figure 4‑21: Bronchial Biopsy Forceps Devices by Company |
| Figure 4‑22: Transbronchial Needle Aspiration Devices by Company |
| Figure 4‑23: Foreign Body Removal Devices by Company |
| Figure 4‑24: Class 2 Device Recall Ambu VivaSight 2 DLT |
| Figure 4‑25: Class 1 Device Recall King Vision Video Adapter Size 1/2 |
| Figure 4‑26: Class 2 Device Recall Nasopharyngolaryngoscope |
| Figure 4‑27: Class 2 Device Recall KARL STORZ |
| Figure 4‑28: Class 2 Device Recall KARL STORZ |
| Figure 4‑29: Class 2 Device Recall Video Laryngoscope |
| Figure 4‑30: Class 2 Device Recall McGrath |
| Figure 4‑31: Class 2 Device Recall Olympus ENDOEYE HD II Video Telescopes |
| Figure 4‑32: Class 2 Device Recall Pentax Rigid Laryngostroboscopes |
| Figure 4‑33: Class 2 Device Recall Rusch Greenlite Single Use Metal Laryngoscope Blade for Fiber Optic System |
| Figure 4‑34: Class 2 Device Recall Rusch |
| Figure 4‑35: Class 2 Device Recall RUSCH POLARIS Laryngoscope |
| Figure 4‑36: Class 1 Device Recall GlideScope Core OneTouch Smart Cable |
| Figure 4‑37: Class 2 Device Recall GlideScope Video Laryngoscope |
| Figure 4‑38: Class 2 Device Recall Medtronic |
| Figure 4‑39: Class 2 Device Recall Entellus Medical Shaver System |
| Figure 4‑40: Class 2 Device Recall Stryker Instruments S2 Mini Foot Pedal |
| Figure 4‑41: Class 2 Device Recall Stryker Sustainability Solutions (SSS) |
| Figure 4‑42: Class 2 Device Recall Olympus |
| Figure 4‑43: Class 2 Device Recall Bronchoscope Tubes |
| Figure 4‑44: Class 2 Device Recall Reprocessed Coronary Sinus Diagnostic EP Catheter |
| Figure 4‑45: Class 2 Device Recall Stryker PROFESS |
| Figure 4‑46: Class 2 Device Recall Ethicon |
| Figure 4‑47: Class 2 Device Recall Ethicon |
| Figure 4‑48: Class 2 Device Recall Covidien Emprint Ablation Catheter with Thermosphere Technology Bronchoscopic Ablation |
| Figure 4‑49: Class 2 Device Recall Covidien Sonicision Battery Charger |
| Figure 4‑50: Class 2 Device Recall Covidien |
| Figure 4‑51: Class 2 Device Recall Flexible Bronchoscope |
| Figure 4‑52: Class 2 Device Recall Intubation Fiberscope |
| Figure 4‑53: Class 2 Device Recall LYMOL Medical Elite X Class Rigid Bronchoscope System |
| Figure 4‑54: Class 2 Device Recall EVIS EXERA III |
| Figure 4‑55: Class 2 Device Recall Olympus |
| Figure 4‑56: Class 2 Device Recall Bronchofiberscopes |
| Figure 4‑57: Class 2 Device Recall EVIS EXERA Bronchovideoscopes |
| Figure 4‑58: Class 2 Device Recall Olympus BFQ180 Bronchoscope |
| Figure 4‑59: Class 2 Device Recall Olympus MAJ209 Single Use Suction Valve (MAJ209) |
| Figure 4‑60: Class 1 Device Recall Atrium |
| Figure 4‑61: WARNING LETTER LYMOL Medical Corporation |
| Figure 4‑62: Class 2 Device Recall Captura Serrated Forceps with Spike |
| Figure 4‑63: Class 2 Device Recall ASPIRATION NEEDLE VIZISHOT |
| Figure 4‑64: Class 2 Device Recall ASPIRATION NEEDLE |
| Figure 4‑65: Class 2 Device Recall Hobbs |
| Figure 4‑66: Class 2 Device Recall Hobbs Bronchial Cytology Brushes |
| Figure 4‑67: Class 2 Device Recall Hobbs |
| Figure 4‑68: Class 2 Device Recall Olympus |
| Figure 4‑69: Study of Cost-effectiveness of the Airway Management in Thoracic Surgery |
| Figure 4‑70: Direct Versus Video Laryngoscope Trial (device) |
| Figure 4‑71: C-MAC Video Stylet vs. Video Endoscope |
| Figure 4‑72: Procedural Efficiency and Organisational Impact of Rhino Laryngoscopes Procedures in Consults |
| Figure 4‑73: GlideScope Videolaryngoscopy in Patients with Reduced Mouth Opening |
| Figure 4‑74: VivaSight-SL Versus Videolaryngoscopy in Expected Difficult Airway (VivaOP) |
| Figure 4‑75: Comparison of Videolaryngoscopy and Direct Laryngoscopy in Pediatric Airway Management |
| Figure 4‑76: Conventional Intubation Versus VivaSight™-SL (VivaITN) |
| Figure 4‑77: Comparison of Endotracheal Intubation Using Flexible Fiberoptic Bronchoscopy Versus Flexible Intubation Video Endoscope (FIVE) in Obese Patients Undergoing Elective Surgeries Under General Anesthesia: A Randomized Controlled Trial |
| Figure 4‑78: A Study of the ENSEAL® X1 Curved Jaw Tissue Sealer and Generator G11 in Thoracic, Urologic, and Ear, Nose, and Throat (ENT) Procedures |
| Figure 4‑79: A Prospective, Multi-Center Evaluation of the ENSEAL X1 Large Jaw Tissue Sealer |
| Figure 4‑80: Balloon Sinuplasty Efficiency in Maxillary Rhinosinusitis |
| Figure 4‑81: A Clinical Evaluation of PROPEL® Contour Sinus Implant (EXPAND) |
| Figure 4‑82: Treatment of Chronic Frontal Sinusitis by a Simple Technique Using Dilation Balloons (SIBA) |
| Figure 4‑83: Video-Laryngoscope Alone or With Bronchoscope for Predicted Difficult Intubation (COMBO) |
| Figure 4‑84: Pilot Study to Evaluate the Role of EBUS in the Diagnosis of Acute PE in Critically Ill Patients (VEBUS) |
| Figure 4‑85: Evaluation of a Disposable Flexible Bronchoscope, aScope IV (EVAL) |
| Figure 4‑86: TRAcheostomy with Single Use Bronchoscopes vs. Conventional Bronchoscopes |
| Figure 4‑87: Reusable Flexible Bronchoscopes Versus Single Use Bronchoscopes: A Satisfaction Survey |
| Figure 4‑88: Prospective Non-interventional Evaluation of Intubation and Intensive Care Use of the New aScope™ 4 Broncho and aView |
| Figure 4‑89: Airway Stents for Excessive Dynamic Airway Collapse |
| Figure 4‑90: Evaluating the Clinical Effectiveness of a Patient-Specific Silicone Stent |
| Figure 4‑91: Biodegradable Airway Stent Post Lung Transplant |
| Figure 4‑92: Central Malignant Airway Obstructions: Medical Treatment Alone Versus Endoscopic and Medical Treatment (EVERMORE) |
| Figure 4‑93: Stent Versus Balloon Dilatation in Patients with Tracheal Benign Stenosis (STROBE) |
| Figure 4‑94: Evaluating the Clinical Effectiveness of 3D Printing for a Patient-Specific Silicone Stent Airway Implant |
| Figure 4‑95: Evaluation of the Synergistic Impact of Needle and Forceps Biopsy with Electromagnetic Navigation Bronchoscopy |
| Figure 4‑96: Needle-Based Confocal Laser Endomicroscopy with Fluorescein and Endobronchial Ultrasound-Guided Transbronchial Needle Aspiration for the Diagnosis of Lung Cancer in Patients with Peripheral Pulmonary Nodules |
| Figure 4‑97: Thin and Ultrathin Bronchoscopy with Transbronchial Needle Aspiration and Radial Probe Endobronchial Ultrasound for Peripheral Pulmonary Lesions |
| Figure 4‑98: EBUS TBNA After PET/CT in Diagnosing Patients with Stage I-IIA Non-Small Cell Lung Cancer Evaluated for Stereotactic Body Radiation Therapy |
| Figure 4‑99: Effect of Needle Size in Diagnostic Yield of EBUS-TBNA in Sarcoidosis and Lymphoma |
| Figure 4‑100: Endobronchial Ultrasound-Guided Transbronchial Needle Aspiration Using a 22 vs 25-Gauge Needle |
| Figure 4‑101: Foreign Body Ingestion During COVID-19 Lockdown |
| Figure 4‑102: Comparison of Patients With and Without Foreign Body Aspiration After Bronchoscopy. |
| Figure 4‑103: High Flow Nasal Cannula in Comparison to Apneic Oxygenation During Foreign Body Removal by Rigid Bronchoscope |
| Figure 5‑1: ENT Endoscopic Device Market by Segment, Global, 2019 – 2029 (US$M) |
| Figure 5‑2: ENT Endoscopic Device Market by Region, Global, 2019 – 2029 (US$M) |
| Figure 5‑3: Leading Competitors, ENT Endoscopic Device Market by Segment, Global, 2022 |
| Figure 5‑4: SWOT Analysis, Acclarent |
| Figure 5‑5: SWOT Analysis, Ambu |
| Figure 5‑6: SWOT Analysis, Karl Storz |
| Figure 5‑7: SWOT Analysis, Medtronic |
| Figure 5‑8: SWOT Analysis, Olympus |
| Figure 5‑9: SWOT Analysis, Pentax |
| Figure 5‑10: SWOT Analysis, Smith & Nephew |
| Figure 5‑11: SWOT Analysis, Stryker |
| Figure 6‑1: ENT Endoscope Procedures Covered |
| Figure 6‑2: ENT Endoscope Markets Covered |
| Figure 6‑3: ENT Endoscope Regions Covered, Global (1 of 2) |
| Figure 6‑4: ENT Endoscope Regions Covered, Global (2 of 2) |
| Figure 6‑5: Total ENT Endoscope Procedures by Anatomy, Global, 2019 – 2029 |
| Figure 6‑6: Total ENT Endoscope Procedures by Region, Global, 2019 – 2029 |
| Figure 6‑7: Total Otological Procedures by Type, Global, 2019 – 2029 |
| Figure 6‑8: Total Otological Procedures by Region, Global, 2019 – 2029 |
| Figure 6‑9: Total Otological Procedures by Country, North America, 2019 – 2029 |
| Figure 6‑10: Total Otological Procedures by Country, Latin America, 2019 – 2029 (1 of 2) |
| Figure 6‑11: Total Otological Procedures by Country, Latin America, 2019 – 2029 (2 of 2) |
| Figure 6‑12: Total Otological Procedures by Country, Western Europe, 2019 – 2029 |
| Figure 6‑13: Total Otological Procedures by Country, Central & Eastern Europe, 2019 – 2029 (1 of 2) |
| Figure 6‑14: Total Otological Procedures by Country, Central & Eastern Europe, 2019 – 2029 (2 of 2) |
| Figure 6‑15: Total Otological Procedures by Country, Middle East, 2019 – 2029 |
| Figure 6‑16: Total Otological Procedures by Country, Asia-Pacific, 2019 – 2029 (1 of 3) |
| Figure 6‑17: Total Otological Procedures by Country, Asia-Pacific, 2019 – 2029 (2 of 3) |
| Figure 6‑18: Total Otological Procedures by Country, Asia-Pacific, 2019 – 2029 (3 of 3) |
| Figure 6‑19: Total Otological Procedures by Country, Africa, 2019 – 2029 |
| Figure 6‑20: Tympanoplasty/Mastoidectomy Procedures by Region, Global, 2019 – 2029 |
| Figure 6‑21: Myringotomy Procedures by Region, Global, 2019 – 2029 |
| Figure 6‑22: Total Nose Procedures by Type, Global, 2019 – 2029 |
| Figure 6‑23: Total Nose Procedures by Region, Global, 2019 – 2029 |
| Figure 6‑24: Total Nose Procedures by Country, North America, 2019 – 2029 |
| Figure 6‑25: Total Nose Procedures by Country, Latin America, 2019 – 2029 (1 of 2) |
| Figure 6‑26: Total Nose Procedures by Country, Latin America, 2019 – 2029 (2 of 2) |
| Figure 6‑27: Total Nose Procedures by Country, Western Europe, 2019 – 2029 |
| Figure 6‑28: Total Nose Procedures by Country, Central & Eastern Europe, 2019 – 2029 (1 of 2) |
| Figure 6‑29: Total Nose Procedures by Country, Central & Eastern Europe, 2019 – 2029 (2 of 2) |
| Figure 6‑30: Total Nose Procedures by Country, Middle East, 2019 – 2029 |
| Figure 6‑31: Total Nose Procedures by Country, Asia-Pacific, 2019 – 2029 (1 of 3) |
| Figure 6‑32: Total Nose Procedures by Country, Asia-Pacific, 2019 – 2029 (2 of 3) |
| Figure 6‑33: Total Nose Procedures by Country, Asia-Pacific, 2019 – 2029 (3 of 3) |
| Figure 6‑34: Total Nose Procedures by Country, Africa, 2019 – 2029 |
| Figure 6‑35: Sinus Procedures by Region, Global, 2019 – 2029 |
| Figure 6‑36: Turbinate Reduction Procedures by Region, Global, 2019 – 2029 |
| Figure 6‑37: Septoplasty Procedures by Region, Global, 2019 – 2029 |
| Figure 6‑38: Total Throat Procedures by Type, Global, 2019 – 2029 |
| Figure 6‑39: Total Throat Procedures by Region, Global, 2019 – 2029 |
| Figure 6‑40: Total Throat Procedures by Country, North America, 2019 – 2029 |
| Figure 6‑41: Total Throat Procedures by Country, Latin America, 2019 – 2029 (1 of 2) |
| Figure 6‑42: Total Throat Procedures by Country, Latin America, 2019 – 2029 (2 of 2) |
| Figure 6‑43: Total Throat Procedures by Country, Western Europe, 2019 – 2029 |
| Figure 6‑44: Total Throat Procedures by Country, Central & Eastern Europe, 2019 – 2029 (1 of 2) |
| Figure 6‑45: Total Throat Procedures by Country, Central & Eastern Europe, 2019 – 2029 (2 of 2) |
| Figure 6‑46: Total Throat Procedures by Country, Middle East, 2019 – 2029 |
| Figure 6‑47: Total Throat Procedures by Country, Asia-Pacific, 2019 – 2029 (1 of 3) |
| Figure 6‑48: Total Throat Procedures by Country, Asia-Pacific, 2019 – 2029 (2 of 3) |
| Figure 6‑49: Total Throat Procedures by Country, Asia-Pacific, 2019 – 2029 (3 of 3) |
| Figure 6‑50: Total Throat Procedures by Country, Africa, 2019 – 2029 |
| Figure 6‑51: Tonsillectomy Procedures by Region, Global, 2019 – 2029 |
| Figure 6‑52: Adenoidectomy Procedures by Region, Global, 2019 – 2029 |
| Figure 6‑53: Combined Procedures by Region, Global, 2019 – 2029 |
| Figure 6‑54: ENT Endoscope Market by Segment, Global, 2019 – 2029 (US$M) |
| Figure 6‑55: ENT Endoscope Market by Region, Global, 2019 – 2029 (US$M) |
| Figure 6‑56: Single-Use ENT Endoscope Market by Segment, Global, 2019 – 2029 (US$M) |
| Figure 6‑57: Total Single-Use ENT Endoscope Market, Global, 2019 – 2029 |
| Figure 6‑58: Units Sold by Region, Single-Use ENT Endoscope Market, Global, 2019 – 2029 |
| Figure 6‑59: Average Selling Price by Region, Single-Use ENT Endoscope Market, Global, 2019 – 2029 (US$) |
| Figure 6‑60: Market Value by Region, Single-Use ENT Endoscope Market, Global, 2019 – 2029 (US$M) |
| Figure 6‑61: Single-Use Rhinolaryngoscope Market, Global, 2019 – 2029 |
| Figure 6‑62: Units Sold by Region, Single-Use Rhinolaryngoscope Market, Global, 2019 – 2029 |
| Figure 6‑63: Average Selling Price by Region, Single-Use Rhinolaryngoscope Market, Global, 2019 – 2029 (US$) |
| Figure 6‑64: Market Value by Region, Single-Use Rhinolaryngoscope Market, Global, 2019 – 2029 (US$M) |
| Figure 6‑65: Single-Use Intubation Endoscope Market by Device Type, Global, 2019 – 2029 |
| Figure 6‑66: Single-Use Intubation Endoscope Market, Global, 2019 – 2029 |
| Figure 6‑67: Units Sold by Region, Single-Use Intubation Endoscope Market, Global, 2019 – 2029 |
| Figure 6‑68: Average Selling Price by Region, Single-Use Intubation Endoscope Market, Global, 2019 – 2029 (US$) |
| Figure 6‑69: Market Value by Region, Single-Use Intubation Endoscope Market, Global, 2019 – 2029 (US$M) |
| Figure 6‑70: Flexible Single-Use Intubation Endoscope Market, Global, 2019 – 2029 |
| Figure 6‑71: Units Sold by Region, Flexible Single-Use Intubation Endoscope Market, Global, 2019 – 2029 |
| Figure 6‑72: Average Selling Price by Region, Flexible Single-Use Intubation Endoscope Market, Global, 2019 – 2029 (US$) |
| Figure 6‑73: Market Value by Region, Flexible Single-Use Intubation Endoscope Market, Global, 2019 – 2029 (US$M) |
| Figure 6‑74: Single-Use Fiber Optic Blade Market, Global, 2019 – 2029 |
| Figure 6‑75: Units Sold by Region, Single-Use Fiber Optic Blade Market, Global, 2019 – 2029 |
| Figure 6‑76: Average Selling Price by Region, Single-Use Fiber Optic Blade Market, Global, 2019 – 2029 (US$) |
| Figure 6‑77: Market Value by Region, Single-Use Fiber Optic Blade Market, Global, 2019 – 2029 (US$M) |
| Figure 6‑78: Single-Use Video Blade Market, Global, 2019 – 2029 |
| Figure 6‑79: Units Sold by Region, Single-Use Video Blade Market, Global, 2019 – 2029 |
| Figure 6‑80: Average Selling Price by Region, Single-Use Video Blade Market, Global, 2019 – 2029 (US$) |
| Figure 6‑81: Market Value by Region, Single-Use Video Blade Market, Global, 2019 – 2029 (US$M) |
| Figure 6‑82: Reusable Laryngoscope Market by Segment, Global, 2019 – 2029 (US$M) |
| Figure 6‑83: Total Reusable Laryngoscope Market, Global, 2019 – 2029 |
| Figure 6‑84: Units Sold by Region, Reusable Laryngoscope Market, Global, 2019 – 2029 |
| Figure 6‑85: Average Selling Price by Region, Reusable Laryngoscope Market, Global, 2019 – 2029 (US$) |
| Figure 6‑86: Market Value by Region, Reusable Laryngoscope Market, Global, 2019 – 2029 (US$M) |
| Figure 6‑87: Rigid Laryngoscope Market, Global, 2019 – 2029 |
| Figure 6‑88: Units Sold by Region, Rigid Laryngoscope Market, Global, 2019 – 2029 |
| Figure 6‑89: Average Selling Price by Region, Rigid Laryngoscope Market, Global, 2019 – 2029 (US$) |
| Figure 6‑90: Market Value by Region, Rigid Laryngoscope Market, Global, 2019 – 2029 (US$M) |
| Figure 6‑91: Flexible Laryngoscope Market by Device Type, Global, 2019 – 2029 (US$M) |
| Figure 6‑92: Flexible Laryngoscope Market, Global, 2019 – 2029 |
| Figure 6‑93: Units Sold by Region, Flexible Laryngoscope Market, Global, 2019 – 2029 |
| Figure 6‑94: Average Selling Price by Region, Flexible Laryngoscope Market, Global, 2019 – 2029 (US$) |
| Figure 6‑95: Market Value by Region, Flexible Laryngoscope Market, Global, 2019 – 2029 (US$M) |
| Figure 6‑96: Video Flexible Laryngoscope Market, Global, 2019 – 2029 |
| Figure 6‑97: Units Sold by Region, Video Flexible Laryngoscope Market, Global, 2019 – 2029 |
| Figure 6‑98: Average Selling Price by Region, Video Flexible Laryngoscope Market, Global, 2019 – 2029 (US$) |
| Figure 6‑99: Market Value by Region, Video Flexible Laryngoscope Market, Global, 2019 – 2029 (US$M) |
| Figure 6‑100: Fiber Optic Flexible Laryngoscope Market, Global, 2019 – 2029 |
| Figure 6‑101: Units Sold by Region, Fiber Optic Flexible Laryngoscope Market, Global, 2019 – 2029 |
| Figure 6‑102: Average Selling Price by Region, Fiber Optic Flexible Laryngoscope Market, Global, 2019 – 2029 (US$) |
| Figure 6‑103: Market Value by Region, Fiber Optic Flexible Laryngoscope Market, Global, 2019 – 2029 (US$M) |
| Figure 6‑104: Direct Laryngoscope Market by Device Type, Global, 2019 – 2029 (US$M) |
| Figure 6‑105: Direct Laryngoscope Market, Global, 2019 – 2029 |
| Figure 6‑106: Units Sold by Region, Direct Laryngoscope Market, Global, 2019 – 2029 |
| Figure 6‑107: Average Selling Price by Region, Direct Laryngoscope Market, Global, 2019 – 2029 (US$) |
| Figure 6‑108: Market Value by Region, Direct Laryngoscope Market, Global, 2019 – 2029 (US$M) |
| Figure 6‑109: Direct Laryngoscope Blade Market, Global, 2019 – 2029 |
| Figure 6‑110: Units Sold by Region, Direct Laryngoscope Blade Market, Global, 2019 – 2029 |
| Figure 6‑111: Average Selling Price by Region, Direct Laryngoscope Blade Market, Global, 2019 – 2029 (US$) |
| Figure 6‑112: Market Value by Region, Direct Laryngoscope Blade Market, Global, 2019 – 2029 (US$M) |
| Figure 6‑113: Direct Laryngoscope Handle Market, Global, 2019 – 2029 |
| Figure 6‑114: Units Sold by Region, Direct Laryngoscope Handle Market, Global, 2019 – 2029 |
| Figure 6‑115: Average Selling Price by Region, Direct Laryngoscope Handle Market, Global, 2019 – 2029 (US$) |
| Figure 6‑116: Market Value by Region, Direct Laryngoscope Handle Market, Global, 2019 – 2029 (US$M) |
| Figure 6‑117: Reusable Rhinoscope/Sinuscope Market, Global, 2019 – 2029 |
| Figure 6‑118: Units Sold by Region, Reusable Rhinoscope/Sinuscope Market, Global, 2019 – 2029 |
| Figure 6‑119: Average Selling Price by Region, Reusable Rhinoscope/Sinuscope Market, Global, 2019 – 2029 (US$) |
| Figure 6‑120: Market Value by Region, Reusable Rhinoscope/Sinuscope Market, Global, 2019 – 2029 (US$M) |
| Figure 6‑121: Reusable Otoscope Market, Global, 2019 – 2029 |
| Figure 6‑122: Units Sold by Region, Reusable Otoscope Market, Global, 2019 – 2029 |
| Figure 6‑123: Average Selling Price by Region, Reusable Otoscope Market, Global, 2019 – 2029 (US$) |
| Figure 6‑124: Market Value by Region, Reusable Otoscope Market, Global, 2019 – 2029 (US$M) |
| Figure 6‑125: Leading Competitors, ENT Endoscope Market by Segment, Global, 2022 |
| Figure 6‑126: Leading Competitors, Single-Use ENT Endoscope Market, Global, 2022 |
| Figure 6‑127: Leading Competitors, Reusable Laryngoscope Market, Global, 2022 |
| Figure 6‑128: Leading Competitors, Reusable Rhinoscope/Sinuscope Market, Global, 2022 |
| Figure 6‑129: Leading Competitors, Reusable Otoscope Market, Global, 2022 |
| Figure 7‑1: ENT Powered Instrument Markets Covered |
| Figure 7‑2: ENT Powered Instrument Regions Covered, Global (1 of 2) |
| Figure 7‑3: ENT Powered Instrument Regions Covered, Global (2 of 2) |
| Figure 7‑4: ENT Powered Instrument Market by Segment, Global, 2019 – 2029 (US$M) |
| Figure 7‑5: ENT Powered Instrument Market by Region, Global, 2019 – 2029 (US$M) |
| Figure 7‑6: ENT Powered Instrument Market, Global, 2019 – 2029 |
| Figure 7‑7: Units Sold by Region, ENT Powered Instrument Market, Global, 2019 – 2029 |
| Figure 7‑8: Average Selling Price by Region, ENT Powered Instrument Market, Global, 2019 – 2029 (US$) |
| Figure 7‑9: Market Value by Region, ENT Powered Instrument Market, Global, 2019 – 2029 (US$M) |
| Figure 7‑10: ENT Powered Instrument Capital Equipment Market by Type, Global, 2019 – 2029 (US$M) |
| Figure 7‑11: Total ENT Powered Instrument Capital Equipment Market, Global, 2019 – 2029 |
| Figure 7‑12: Units Sold by Region, ENT Powered Instrument Capital Equipment Market, Global, 2019 – 2029 |
| Figure 7‑13: Average Selling Price by Region, ENT Powered Instrument Capital Equipment Market, Global, 2019 – 2029 (US$) |
| Figure 7‑14: Market Value by Region, ENT Powered Instrument Capital Equipment Market, Global, 2019 – 2029 (US$M) |
| Figure 7‑15: ENT Power Shaver Market, Global, 2019 – 2029 |
| Figure 7‑16: Units Sold by Region, ENT Power Shaver Market, Global, 2019 – 2029 |
| Figure 7‑17: Average Selling Price by Region, ENT Power Shaver Market, Global, 2019 – 2029 (US$) |
| Figure 7‑18: Market Value by Region, ENT Power Shaver Market, Global, 2019 – 2029 (US$M) |
| Figure 7‑19: ENT Power Drill Market, Global, 2019 – 2029 |
| Figure 7‑20: Units Sold by Region, ENT Power Drill Market, Global, 2019 – 2029 |
| Figure 7‑21: Average Selling Price by Region, ENT Power Drill Market, Global, 2019 – 2029 (US$) |
| Figure 7‑22: Market Value by Region, ENT Power Drill Market, Global, 2019 – 2029 (US$M) |
| Figure 7‑23: ENT Powered Instrument Disposable Market by Type, Global, 2019 – 2029 (US$M) |
| Figure 7‑24: Total ENT Powered Instrument Disposable Market, Global, 2019 – 2029 |
| Figure 7‑25: Units Sold by Region, ENT Powered Instrument Disposable Market, Global, 2019 – 2029 |
| Figure 7‑26: Average Selling Price by Region, ENT Powered Instrument Disposable Market, Global, 2019 – 2029 (US$) |
| Figure 7‑27: Market Value by Region, ENT Powered Instrument Disposable Market, Global, 2019 – 2029 (US$M) |
| Figure 7‑28: ENT Shaver Blade Market by Type, Global, 2015 – 2025 (US$M) |
| Figure 7‑29: ENT Shaver Blade Market, Global, 2019 – 2029 |
| Figure 7‑30: Units Sold by Region, ENT Shaver Blade Market, Global, 2019 – 2029 |
| Figure 7‑31: Average Selling Price by Region, ENT Shaver Blade Market, Global, 2019 – 2029 (US$) |
| Figure 7‑32: Market Value by Region, ENT Shaver Blade Market, Global, 2019 – 2029 (US$M) |
| Figure 7‑33: Navigation ENT Shaver Blade Market, Global, 2019 – 2029 |
| Figure 7‑34: Units Sold by Region, Navigation ENT Shaver Blade Market, Global, 2019 – 2029 |
| Figure 7‑35: Average Selling Price by Region, Navigation ENT Shaver Blade Market, Global, 2019 – 2029 (US$) |
| Figure 7‑36: Market Value by Region, Navigation ENT Shaver Blade Market, Global, 2019 – 2029 (US$M) |
| Figure 7‑37: Regular ENT Shaver Blade Market, Global, 2019 – 2029 |
| Figure 7‑38: Units Sold by Region, Regular ENT Shaver Blade Market, Global, 2019 – 2029 |
| Figure 7‑39: Average Selling Price by Region, Regular ENT Shaver Blade Market, Global, 2019 – 2029 (US$) |
| Figure 7‑40: Market Value by Region, Regular ENT Shaver Blade Market, Global, 2019 – 2029 (US$M) |
| Figure 7‑41: ENT Drill Burr Market, Global, 2019 – 2029 |
| Figure 7‑42: Units Sold by Region, ENT Drill Burr Market, Global, 2019 – 2029 |
| Figure 7‑43: Average Selling Price by Region, ENT Drill Burr Market, Global, 2019 – 2029 (US$) |
| Figure 7‑44: Market Value by Region, ENT Drill Burr Market, Global, 2019 – 2029 (US$M) |
| Figure 7‑45: Leading Competitors, ENT Powered Instrument Market, Global, 2022 |
| Figure 8‑1: ENT Hand Instrument Markets Covered |
| Figure 8‑2: ENT Hand Instrument Regions Covered, Global (1 of 2) |
| Figure 8‑3: ENT Hand Instrument Regions Covered, Global (2 of 2) |
| Figure 8‑4: ENT Hand Instrument Market by Segment, Global, 2019 – 2029 (US$M) |
| Figure 8‑5: ENT Hand Instrument Market by Region, Global, 2019 – 2029 (US$M) |
| Figure 8‑6: ENT Hand Instrument Market, Global, 2019 – 2029 |
| Figure 8‑7: Units Sold by Region, ENT Hand Instrument Market, Global, 2019 – 2029 |
| Figure 8‑8: Average Selling Price by Region, ENT Hand Instrument Market, Global, 2019 – 2029 (US$) |
| Figure 8‑9: Market Value by Region, ENT Hand Instrument Market, Global, 2019 – 2029 (US$M) |
| Figure 8‑10: Sinus Hand Instrument Market, Global, 2019 – 2029 |
| Figure 8‑11: Units Sold by Region, Sinus Hand Instrument Market, Global, 2019 – 2029 |
| Figure 8‑12: Average Selling Price by Region, Sinus Hand Instrument Market, Global, 2019 – 2029 (US$) |
| Figure 8‑13: Market Value by Region, Sinus Hand Instrument Market, Global, 2019 – 2029 (US$M) |
| Figure 8‑14: Laryngeal Hand Instrument Market, Global, 2019 – 2029 |
| Figure 8‑15: Units Sold by Region, Laryngeal Hand Instrument Market, Global, 2019 – 2029 |
| Figure 8‑16: Average Selling Price by Region, Laryngeal Hand Instrument Market, Global, 2019 – 2029 (US$) |
| Figure 8‑17: Market Value by Region, Laryngeal Hand Instrument Market, Global, 2019 – 2029 (US$M) |
| Figure 8‑18: Otological Hand Instrument Market, Global, 2019 – 2029 |
| Figure 8‑19: Units Sold by Region, Otological Hand Instrument Market, Global, 2019 – 2029 |
| Figure 8‑20: Average Selling Price by Region, Otological Hand Instrument Market, Global, 2019 – 2029 (US$) |
| Figure 8‑21: Market Value by Region, Otological Hand Instrument Market, Global, 2019 – 2029 (US$M) |
| Figure 8‑22: Leading Competitors, ENT Hand Instrument Market, Global, 2022 |
| Figure 9‑1: ENT Surgical Energy Device Markets Covered |
| Figure 9‑2: ENT Surgical Energy Device Regions Covered, Global (1 of 2) |
| Figure 9‑3: ENT Surgical Energy Device Regions Covered, Global (2 of 2) |
| Figure 9‑4: ENT Surgical Energy Device Market by Segment, Global, 2019 – 2029 (US$M) |
| Figure 9‑5: ENT Surgical Energy Device Market by Region, Global, 2019 – 2029 (US$M) |
| Figure 9‑6: Capital Equipment Market, Global, 2019 – 2029 |
| Figure 9‑7: Units Sold by Region, Capital Equipment Market, Global, 2019 – 2029 |
| Figure 9‑8: Average Selling Price by Region, Capital Equipment Market, Global, 2019 – 2029 (US$) |
| Figure 9‑9: Market Value by Region, Capital Equipment Market, Global, 2019 – 2029 (US$M) |
| Figure 9‑10: RF & Ultrasonic Probe Market, Global, 2019 – 2029 |
| Figure 9‑11: Units Sold by Region, RF & Ultrasonic Probe Market, Global, 2019 – 2029 |
| Figure 9‑12: Average Selling Price by Region, RF & Ultrasonic Probe Market, Global, 2019 – 2029 (US$) |
| Figure 9‑13: Market Value by Region, RF & Ultrasonic Probe Market, Global, 2019 – 2029 (US$M) |
| Figure 9‑14: Leading Competitors, ENT Surgical Energy Device Market, Global, 2022 |
| Figure 10‑1: Balloon Dilation Device Regions Covered, Global (1 of 2) |
| Figure 10‑2: Balloon Dilation Device Regions Covered, Global (2 of 2) |
| Figure 10‑3: Balloon Dilation Device Market, Global, 2019 – 2029 |
| Figure 10‑4: Units Sold by Region, Balloon Dilation Device Market, Global, 2019 – 2029 |
| Figure 10‑5: Average Selling Price by Region, Balloon Dilation Device Market, Global, 2019 – 2029 (US$) |
| Figure 10‑6: Market Value by Region, Balloon Dilation Device Market, Global, 2019 – 2029 (US$M) |
| Figure 10‑7: Leading Competitors, Balloon Dilation Device Market, Global, 2022 |
| Figure 11‑1: Drug-Eluting Stent Regions Covered, Global (1 of 2) |
| Figure 11‑2: Drug-Eluting Stent Regions Covered, Global (2 of 2) |
| Figure 11‑3: Drug-Eluting Stent Market, Global, 2019 – 2029 |
| Figure 11‑4: Units Sold by Region, Drug-Eluting Stent Market, Global, 2019 – 2029 |
| Figure 11‑5: Average Selling Price by Region, Drug-Eluting Stent Market, Global, 2019 – 2029 (US$) |
| Figure 11‑6: Market Value by Region, Drug-Eluting Stent Market, Global, 2019 – 2029 (US$M) |
| Figure 11‑7: Leading Competitors, Drug-Eluting Stent Market, Global, 2022 |
| Figure 12‑1: Bronchoscopic Device Market by Segment, Global, 2019 – 2029 (US$M) |
| Figure 12‑2: Bronchoscopic Device Market by Region, Global, 2019 – 2029 (US$M) |
| Figure 12‑3: Leading Competitors, Bronchoscopic Device Market by Segment, Global, 2022 |
| Figure 12‑4: SWOT Analysis, Ambu |
| Figure 12‑5: SWOT Analysis, Boston Scientific |
| Figure 12‑6: SWOT Analysis, Getinge |
| Figure 12‑7: SWOT Analysis, Karl Storz |
| Figure 12‑8: SWOT Analysis, Olympus |
| Figure 12‑9: SWOT Analysis, Pentax |
| Figure 13‑1: Bronchoscope Procedures Covered |
| Figure 13‑2: Bronchoscope Markets Covered |
| Figure 13‑3: Bronchoscope Regions Covered, Global (1 of 2) |
| Figure 13‑4: Bronchoscope Regions Covered, Global (2 of 2) |
| Figure 13‑5: Bronchoscopic Procedures by Type, Global, 2019 – 2029 |
| Figure 13‑6: Bronchoscopic Procedures by Region, Global, 2019 – 2029 |
| Figure 13‑7: Bronchoscopic Procedures by Country, North America, 2019 – 2029 |
| Figure 13‑8: Bronchoscopic Procedures by Country, Latin America, 2019 – 2029 (1 of 2) |
| Figure 13‑9: Bronchoscopic Procedures by Country, Latin America, 2019 – 2029 (2 of 2) |
| Figure 13‑10: Bronchoscopic Procedures by Country, Western Europe, 2019 – 2029 |
| Figure 13‑11: Bronchoscopic Procedures by Country, Central & Eastern Europe, 2019 – 2029 (1 of 2) |
| Figure 13‑12: Bronchoscopic Procedures by Country, Central & Eastern Europe, 2019 – 2029 (2 of 2) |
| Figure 13‑13: Bronchoscopic Procedures by Country, Middle East, 2019 – 2029 |
| Figure 13‑14: Bronchoscopic Procedures by Country, Asia-Pacific, 2019 – 2029 (1 of 3) |
| Figure 13‑15: Bronchoscopic Procedures by Country, Asia-Pacific, 2019 – 2029 (2 of 3) |
| Figure 13‑16: Bronchoscopic Procedures by Country, Asia-Pacific, 2019 – 2029 (3 of 3) |
| Figure 13‑17: Bronchoscopic Procedures by Country, Africa, 2019 – 2029 |
| Figure 13‑18: Tracheobronchial Procedures by Segment, Global, 2019 – 2029 |
| Figure 13‑19: Tracheobronchial Procedures by Region, Global, 2019 – 2029 |
| Figure 13‑20: Pulmonary Sampling Procedures by Type, Global, 2019 – 2029 |
| Figure 13‑21: Pulmonary Sampling Procedures by Region, Global, 2019 – 2029 |
| Figure 13‑22: Pulmonary Sampling Procedures by Country, North America, 2019 – 2029 |
| Figure 13‑23: Pulmonary Sampling Procedures by Country, Latin America, 2019 – 2029 (1 of 2) |
| Figure 13‑24: Pulmonary Sampling Procedures by Country, Latin America, 2019 – 2029 (2 of 2) |
| Figure 13‑25: Pulmonary Sampling Procedures by Country, Western Europe, 2019 – 2029 |
| Figure 13‑26: Pulmonary Sampling Procedures by Country, Central & Eastern Europe, 2019 – 2029 (1 of 2) |
| Figure 13‑27: Pulmonary Sampling Procedures by Country, Central & Eastern Europe, 2019 – 2029 (2 of 2) |
| Figure 13‑28: Pulmonary Sampling Procedures by Country, Middle East, 2019 – 2029 |
| Figure 13‑29: Pulmonary Sampling Procedures by Country, Asia-Pacific, 2019 – 2029 (1 of 3) |
| Figure 13‑30: Pulmonary Sampling Procedures by Country, Asia-Pacific, 2019 – 2029 (2 of 3) |
| Figure 13‑31: Pulmonary Sampling Procedures by Country, Asia-Pacific, 2019 – 2029 (3 of 3) |
| Figure 13‑32: Pulmonary Sampling Procedures by Country, Africa, 2019 – 2029 |
| Figure 13‑33: Pulmonary Biopsy Procedures by Region, Global, 2019 – 2029 |
| Figure 13‑34: Non-Biopsy Pulmonary Sampling Procedures by Region, Global, 2019 – 2029 |
| Figure 13‑35: Foreign Body Removal Procedures by Region, Global, 2019 – 2029 |
| Figure 13‑36: Foreign Body Removal Procedures by Country, North America, 2019 – 2029 |
| Figure 13‑37: Foreign Body Removal Procedures by Country, Latin America, 2019 – 2029 (1 of 2) |
| Figure 13‑38: Foreign Body Removal Procedures by Country, Latin America, 2019 – 2029 (2 of 2) |
| Figure 13‑39: Foreign Body Removal Procedures by Country, Western Europe, 2019 – 2029 |
| Figure 13‑40: Foreign Body Removal Procedures by Country, Central & Eastern Europe, 2019 – 2029 (1 of 2) |
| Figure 13‑41: Foreign Body Removal Procedures by Country, Central & Eastern Europe, 2019 – 2029 (2 of 2) |
| Figure 13‑42: Foreign Body Removal Procedures by Country, Middle East, 2019 – 2029 |
| Figure 13‑43: Foreign Body Removal Procedures by Country, Asia-Pacific, 2019 – 2029 (1 of 3) |
| Figure 13‑44: Foreign Body Removal Procedures by Country, Asia-Pacific, 2019 – 2029 (2 of 3) |
| Figure 13‑45: Foreign Body Removal Procedures by Country, Asia-Pacific, 2019 – 2029 (3 of 3) |
| Figure 13‑46: Foreign Body Removal Procedures by Country, Africa, 2019 – 2029 |
| Figure 13‑47: Bronchoscope Market by Segment, Global, 2019 – 2029 (US$M) |
| Figure 13‑48: Bronchoscope Market by Region, Global, 2019 – 2029 (US$M) |
| Figure 13‑49: Bronchoscope Market, Global, 2019 – 2029 |
| Figure 13‑50: Units Sold by Region, Bronchoscope Market, Global, 2019 – 2029 |
| Figure 13‑51: Average Selling Price by Region, Bronchoscope Market, Global, 2019 – 2029 (US$) |
| Figure 13‑52: Market Value by Region, Bronchoscope Market, Global, 2019 – 2029 (US$M) |
| Figure 13‑53: Rigid Bronchoscope Market by Segment, Global, 2019 – 2029 (US$M) |
| Figure 13‑54: Total Rigid Bronchoscope Market, Global, 2019 – 2029 |
| Figure 13‑55: Units Sold by Region, Rigid Bronchoscope Market, Global, 2019 – 2029 |
| Figure 13‑56: Average Selling Price by Region, Rigid Bronchoscope Market, Global, 2019 – 2029 (US$) |
| Figure 13‑57: Market Value by Region, Rigid Bronchoscope Market, Global, 2019 – 2029 (US$M) |
| Figure 13‑58: Rigid Bronchoscope Device Market, Global, 2019 – 2029 |
| Figure 13‑59: Units Sold by Region, Rigid Bronchoscope Device Market, Global, 2019 – 2029 |
| Figure 13‑60: Average Selling Price by Region, Rigid Bronchoscope Device Market, Global, 2019 – 2029 (US$) |
| Figure 13‑61: Market Value by Region, Rigid Bronchoscope Device Market, Global, 2019 – 2029 (US$M) |
| Figure 13‑62: Rigid Bronchoscopic Tube Market, Global, 2019 – 2029 |
| Figure 13‑63: Units Sold by Region, Rigid Bronchoscopic Tube Market, Global, 2019 – 2029 |
| Figure 13‑64: Average Selling Price by Region, Rigid Bronchoscopic Tube Market, Global, 2019 – 2029 (US$) |
| Figure 13‑65: Market Value by Region, Rigid Bronchoscopic Tube Market, Global, 2019 – 2029 (US$M) |
| Figure 13‑66: Flexible Bronchoscope Market by Segment, Global, 2019 – 2029 (US$M) |
| Figure 13‑67: Total Flexible Bronchoscope Market, Global, 2019 – 2029 |
| Figure 13‑68: Units Sold by Region, Flexible Bronchoscope Market, Global, 2019 – 2029 |
| Figure 13‑69: Average Selling Price by Region, Flexible Bronchoscope Market, Global, 2019 – 2029 (US$) |
| Figure 13‑70: Market Value by Region, Flexible Bronchoscope Market, Global, 2019 – 2029 (US$M) |
| Figure 13‑71: Fiber Flexible Bronchoscope Market, Global, 2019 – 2029 |
| Figure 13‑72: Units Sold by Region, Fiber Flexible Bronchoscope Market, Global, 2019 – 2029 |
| Figure 13‑73: Average Selling Price by Region, Fiber Flexible Bronchoscope Market, Global, 2019 – 2029 (US$) |
| Figure 13‑74: Market Value by Region, Fiber Flexible Bronchoscope Market, Global, 2019 – 2029 (US$M) |
| Figure 13‑75: Video Flexible Bronchoscope Market, Global, 2019 – 2029 |
| Figure 13‑76: Units Sold by Region, Video Flexible Bronchoscope Market, Global, 2019 – 2029 |
| Figure 13‑77: Average Selling Price by Region, Video Flexible Bronchoscope Market, Global, 2019 – 2029 (US$) |
| Figure 13‑78: Market Value by Region, Video Flexible Bronchoscope Market, Global, 2019 – 2029 (US$M) |
| Figure 13‑79: Ultrasound Bronchoscope Market, Global, 2019 – 2029 |
| Figure 13‑80: Units Sold by Region, Ultrasound Bronchoscope Market, Global, 2019 – 2029 |
| Figure 13‑81: Average Selling Price by Region, Ultrasound Bronchoscope Market, Global, 2019 – 2029 (US$) |
| Figure 13‑82: Market Value by Region, Ultrasound Bronchoscope Market, Global, 2019 – 2029 (US$M) |
| Figure 13‑83: Single-Use Bronchoscope Market, Global, 2019 – 2029 |
| Figure 13‑84: Units Sold by Region, Single-Use Bronchoscope Market, Global, 2019 – 2029 |
| Figure 13‑85: Average Selling Price by Region, Single-Use Bronchoscope Market, Global, 2019 – 2029 (US$) |
| Figure 13‑86: Market Value by Region, Single-Use Bronchoscope Market, Global, 2019 – 2029 (US$M) |
| Figure 13‑87: Leading Competitors, Bronchoscope Market, Global, 2022 |
| Figure 14‑1: Bronchoscopic Hand Instrument Regions Covered, Global (1 of 2) |
| Figure 14‑2: Bronchoscopic Hand Instrument Regions Covered, Global (2 of 2) |
| Figure 14‑3: Bronchoscopic Hand Instrument Market, Global, 2019 – 2029 |
| Figure 14‑4: Units Sold by Region, Bronchoscopic Hand Instrument Market, Global, 2019 – 2029 |
| Figure 14‑5: Average Selling Price by Region, Bronchoscopic Hand Instrument Market, Global, 2019 – 2029 (US$) |
| Figure 14‑6: Market Value by Region, Bronchoscopic Hand Instrument Market, Global, 2019 – 2029 (US$M) |
| Figure 14‑7: Leading Competitors, Bronchoscopic Hand Instrument Market, Global, 2022 |
| Figure 15‑1: Tracheobronchial Stent Markets Covered |
| Figure 15‑2: Tracheobronchial Stent Regions Covered, Global (1 of 2) |
| Figure 15‑3: Tracheobronchial Stent Regions Covered, Global (2 of 2) |
| Figure 15‑4: Tracheobronchial Stent Market by Segment, Global, 2019 – 2029 (US$M) |
| Figure 15‑5: Tracheobronchial Stent Market by Region, Global, 2019 – 2029 (US$M) |
| Figure 15‑6: Tracheobronchial Stent Market, Global, 2019 – 2029 |
| Figure 15‑7: Units Sold by Region, Tracheobronchial Stent Market, Global, 2019 – 2029 |
| Figure 15‑8: Average Selling Price by Region, Tracheobronchial Stent Market, Global, 2019 – 2029 (US$) |
| Figure 15‑9: Market Value by Region, Tracheobronchial Stent Market, Global, 2019 – 2029 (US$M) |
| Figure 15‑10: Metal Tracheobronchial Stent Market, Global, 2019 – 2029 |
| Figure 15‑11: Units Sold by Region, Metal Tracheobronchial Stent Market, Global, 2019 – 2029 |
| Figure 15‑12: Average Selling Price by Region, Metal Tracheobronchial Stent Market, Global, 2019 – 2029 (US$) |
| Figure 15‑13: Market Value by Region, Metal Tracheobronchial Stent Market, Global, 2019 – 2029 (US$M) |
| Figure 15‑14: Silicone Tracheobronchial Stent Market, Global, 2019 – 2029 |
| Figure 15‑15: Units Sold by Region, Silicone Tracheobronchial Stent Market, Global, 2019 – 2029 |
| Figure 15‑16: Average Selling Price by Region, Silicone Tracheobronchial Stent Market, Global, 2019 – 2029 (US$) |
| Figure 15‑17: Market Value by Region, Silicone Tracheobronchial Stent Market, Global, 2019 – 2029 (US$M) |
| Figure 15‑18: Leading Competitors, Tracheobronchial Stent Market, Global, 2022 |
| Figure 16‑1: Bronchoscopic Biopsy Device Markets Covered |
| Figure 16‑2: Bronchoscopic Biopsy Device Regions Covered, Global (1 of 2) |
| Figure 16‑3: Bronchoscopic Biopsy Device Regions Covered, Global (2 of 2) |
| Figure 16‑4: Bronchoscopic Biopsy Device Market by Segment, Global, 2019 – 2029 (US$M) |
| Figure 16‑5: Bronchoscopic Biopsy Device Market by Region, Global, 2019 – 2029 (US$M) |
| Figure 16‑6: Bronchoscopic Biopsy Device Market, Global, 2019 – 2029 |
| Figure 16‑7: Units Sold by Region, Bronchoscopic Biopsy Device Market, Global, 2019 – 2029 |
| Figure 16‑8: Average Selling Price by Region, Bronchoscopic Biopsy Device Market, Global, 2019 – 2029 (US$) |
| Figure 16‑9: Market Value by Region, Bronchoscopic Biopsy Device Market, Global, 2019 – 2029 (US$M) |
| Figure 16‑10: Bronchial Forceps Market by Type, Global, 2019 – 2029 (US$M) |
| Figure 16‑11: Total Bronchial Forceps Market, Global, 2019 – 2029 |
| Figure 16‑12: Units Sold by Region, Bronchial Forceps Market, Global, 2019 – 2029 |
| Figure 16‑13: Average Selling Price by Region, Bronchial Forceps Market, Global, 2019 – 2029 (US$) |
| Figure 16‑14: Market Value by Region, Bronchial Forceps Market, Global, 2019 – 2029 (US$M) |
| Figure 16‑15: Disposable Bronchial Forceps Market, Global, 2019 – 2029 |
| Figure 16‑16: Units Sold by Region, Disposable Bronchial Forceps Market, Global, 2019 – 2029 |
| Figure 16‑17: Average Selling Price by Region, Disposable Bronchial Forceps Market, Global, 2019 – 2029 (US$) |
| Figure 16‑18: Market Value by Region, Disposable Bronchial Forceps Market, Global, 2019 – 2029 (US$M) |
| Figure 16‑19: Reusable Bronchial Forceps Market, Global, 2019 – 2029 |
| Figure 16‑20: Units Sold by Region, Reusable Bronchial Forceps Market, Global, 2019 – 2029 |
| Figure 16‑21: Average Selling Price by Region, Reusable Bronchial Forceps Market, Global, 2019 – 2029 (US$) |
| Figure 16‑22: Market Value by Region, Reusable Bronchial Forceps Market, Global, 2019 – 2029 (US$M) |
| Figure 16‑23: Transbronchial Aspiration Needle Market by Segment, Global, 2019 – 2029 (US$M) |
| Figure 16‑24: Total Transbronchial Aspiration Needle Market, Global, 2019 – 2029 |
| Figure 16‑25: Units Sold by Region, Transbronchial Aspiration Needle Market, Global, 2019 – 2029 |
| Figure 16‑26: Average Selling Price by Region, Transbronchial Aspiration Needle Market, Global, 2019 – 2029 (US$) |
| Figure 16‑27: Market Value by Region, Transbronchial Aspiration Needle Market, Global, 2019 – 2029 (US$M) |
| Figure 16‑28: Conventional TBNA Market, Global, 2019 – 2029 |
| Figure 16‑29: Units Sold by Region, Conventional TBNA Market, Global, 2019 – 2029 |
| Figure 16‑30: Average Selling Price by Region, Conventional TBNA Market, Global, 2019 – 2029 (US$) |
| Figure 16‑31: Market Value by Region, Conventional TBNA Market, Global, 2019 – 2029 (US$M) |
| Figure 16‑32: EBUS-TBNA Market, Global, 2019 – 2029 |
| Figure 16‑33: Units Sold by Region, EBUS-TBNA Market, Global, 2019 – 2029 |
| Figure 16‑34: Average Selling Price by Region, EBUS-TBNA Market, Global, 2019 – 2029 (US$) |
| Figure 16‑35: Market Value by Region, EBUS-TBNA Market, Global, 2019 – 2029 (US$M) |
| Figure 16‑36: Leading Competitors, Bronchoscopic Biopsy Device Market, Global, 2022 |
| Figure 17‑1: Foreign Body Removal Device Markets Covered |
| Figure 17‑2: Foreign Body Removal Device Regions Covered, Global (1 of 2) |
| Figure 17‑3: Foreign Body Removal Device Regions Covered, Global (2 of 2) |
| Figure 17‑4: Foreign Body Removal Device Market by Segment, Global, 2019 – 2029 (US$M) |
| Figure 17‑5: Foreign Body Removal Device Market by Region, Global, 2019 – 2029 (US$M) |
| Figure 17‑6: Foreign Body Removal Device Market, Global, 2019 – 2029 |
| Figure 17‑7: Units Sold by Region, Foreign Body Removal Device Market, Global, 2019 – 2029 |
| Figure 17‑8: Average Selling Price by Region, Foreign Body Removal Device Market, Global, 2019 – 2029 (US$) |
| Figure 17‑9: Market Value by Region, Foreign Body Removal Device Market, Global, 2019 – 2029 (US$M) |
| Figure 17‑10: Disposable Foreign Body Removal Device Market, Global, 2019 – 2029 |
| Figure 17‑11: Units Sold by Region, Disposable Foreign Body Removal Device Market, Global, 2019 – 2029 |
| Figure 17‑12: Average Selling Price by Region, Disposable Foreign Body Removal Device Market, Global, 2019 – 2029 (US$) |
| Figure 17‑13: Market Value by Region, Disposable Foreign Body Removal Device Market, Global, 2019 – 2029 (US$M) |
| Figure 17‑14: Reusable Foreign Body Removal Device Market, Global, 2019 – 2029 |
| Figure 17‑15: Units Sold by Region, Reusable Foreign Body Removal Device Market, Global, 2019 – 2029 |
| Figure 17‑16: Average Selling Price by Region, Reusable Foreign Body Removal Device Market, Global, 2019 – 2029 (US$) |
| Figure 17‑17: Market Value by Region, Reusable Foreign Body Removal Device Market, Global, 2019 – 2029 (US$M) |
| Figure 17‑18: Leading Competitors, Foreign Body Removal Device Market, Global, 2022 |

 The market for ENT endoscopes is expected to remain the largest segment in terms of market value during the forecast period due to the rise of single-use endoscopes. The ENT endoscope market has the highest growth rate among the segments in the ENT endoscopic device market, and it is expected to stay as the fastest-growing market in the ENT endoscopic device market by the end of the forecast period.
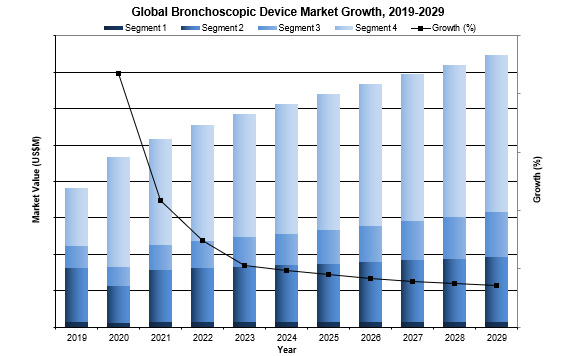 In 2022, the bronchoscope segment represented the majority of the total bronchoscopic device market and is expected to maintain this leading share throughout the forecast period. This segment is driven by the unit sales of ultrasound and single-use bronchoscopes.
 The top competitor in the ENT endoscopic and bronchoscopic device market in 2022 was Olympus. Olympus participated in both the ENT and bronchoscopy device markets. Within the ENT endoscopic device market, Olympus held notable shares in the ENT endoscope, powered instrument, hand instrument and surgical energy device segments.