
Product Description
The global dental CBU material market was valued at approximately $260 million in 2025. This is expected to increase over the forecast period at a CAGR of 2.4% to reach nearly $310 million.
The full report suite on the global market for dental core build-up (CBU) materials is further segmented into the composite resin, the glass ionomer (GI) and resin-modified GI (RMGI) and the residual segment for other CBU materials used in core procedures. The residual category of other CBU materials combines amalgam, universal cement and silver-reinforced GI. The units sold in the dental CBU material market are defined in millions of grams, while the ASP represents the cost of one gram of a product.
The report includes data for 65 countries across 7 different regions which include North America, Latin America, Western Europe, Central & Eastern Europe, Middle East, Asia-Pacific, and Africa.
Data Types Included
- Unit Sales, Average Selling Prices, Market Size & Growth Trends
- Procedure Numbers
- Market Drivers & Limiters
- Market Forecasts Until 2032, and Historical Data to 2022
- Recent Mergers & Acquisitions
- Company Profiles and Product Portfolios
- Leading Competitors
Dental Core Build-Up Material Market Trends
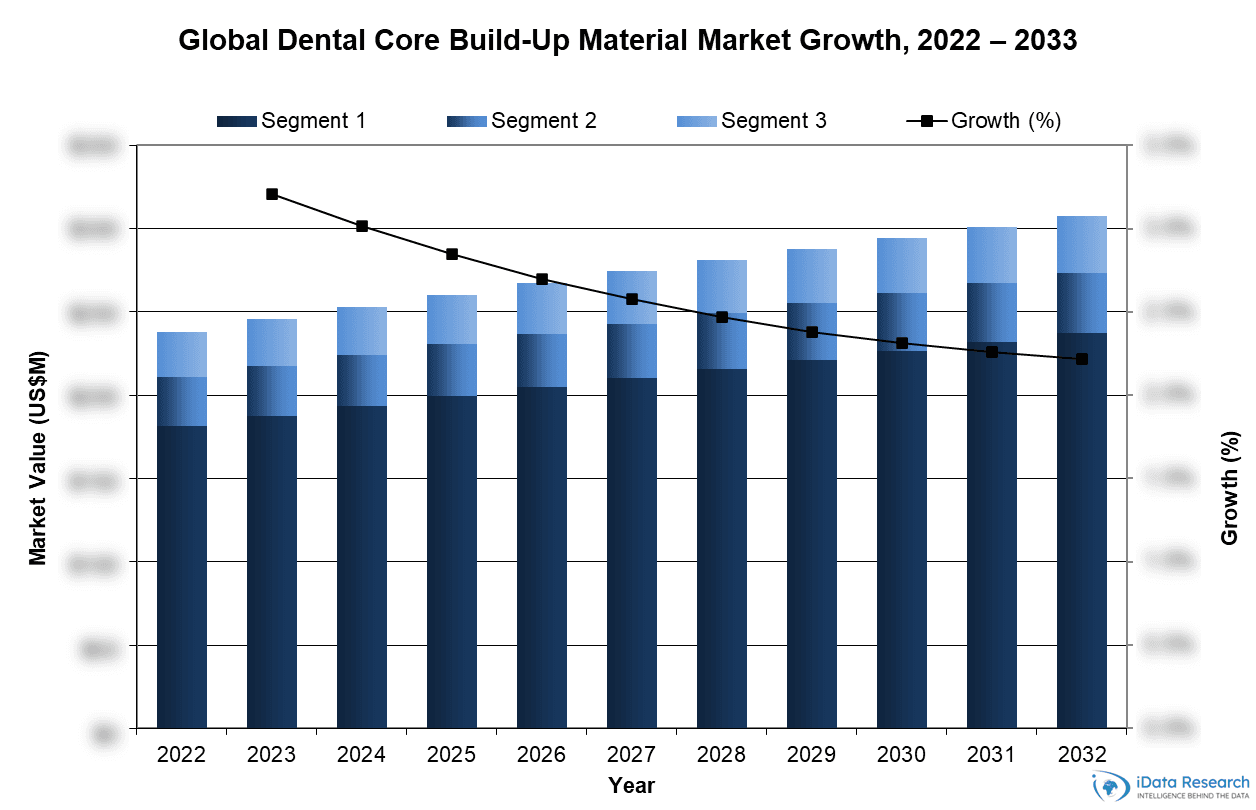
The dental core build-up materials market exhibits steady but moderate growth, reflecting its mature position within restorative dentistry. Market expansion is primarily volume driven, with limited ASP upside, as core build-up materials remain a functional necessity rather than a discretionary or premium-focused product category. Asia-Pacific represents the largest regional share of the market, supported by higher procedure volumes, while North America and Western Europe contribute stable revenues through consistent restorative activity rather than accelerated growth.
Dental Core Build-Up Material Market Share Insights

- Solventum inherited 3M’s Oral Care portfolio following the 2024 spin-off and has maintained its position in the global core build-up (CBU) material market, supported primarily by the versatility of the Filtek™ restorative family. Filtek™ Supreme Ultra Universal Restorative, although not a dedicated core material, is frequently selected by clinicians for small core build-ups due to its excellent handling characteristics, mechanical strength and broad indications. Its multi-purpose use also helps simplify inventory management in dental offices. Paradigm™ Nano Hybrid Universal Restorative continues to be available in both capsule and syringe presentations; however, its market presence is modest compared with the Filtek™ line. The product remains positioned as a light-cured, radiopaque restorative composite suitable for anterior and posterior applications, with occasional use in minor core build-up procedures.
- GC was the second-leading competitor in the CBU material market, primarily driven by its recognized leadership in the GI space. GC captured its market share through the sales of its GRADIA® CORE dual-cured radiopaque composite, GC Fuji II® resin-reinforced GI and silver-reinforced GI Miracle Mix®. The company’s latest addition, GC’s EverX® Flow, is a short-fiber-reinforced flowable composite, indicated for dentin replacement in bulk-filling and CBU
- DMG competed in the global CBU material market with its LuxaCore® product line of composite resin materials. LuxaCore® Z-Dual is a premium offering in the composite CBU market. This product has high compressive strength, nanotechnology to prevent particle agglomeration and enhanced flow characteristics for excellent handling. LuxaCore® Z-Dual is both a CBU material and post cement simplifying the process.
Dental Core Build-Up Material Market Segmentation Summary
- Dental Core Build-Up– Further Segmented Into:
- Product Type: Composite Resin, Glass Ionomer (GI)/Resin-Modified Glass Ionomer (RMGI)
- Delivery Type: Auto-Mix Syringe, Hand-Mix, Pre-Mix
- Curing Method: Light-Cure, Self-Cure, Dual- Cure
Research Scope Summary
| Report Attribute | Details |
|---|---|
| Regions | North America (Canada, United States) Latin America (Argentina, Bolivia, Brazil, Chile, Colombia, Costa Rica, Dominican Republic, Ecuador, Guatemala, Mexico, Panama, Paraguay, Peru, Puerto Rico, Uruguay, Venezuela) Western Europe (Austria, Benelux, France, Germany, Italy, Portugal, Scandinavia, Spain, Switzerland, United Kingdom) Central & Eastern Europe (Azerbaijan, Baltic States, Belarus, Bulgaria, Croatia, Czech Republic, Georgia, Greece, Hungary, Kazakhstan, Poland, Romania, Russia, Serbia, Slovakia, Slovenia, Turkey, Ukraine) Middle East (Bahrain, Iran, Israel, Kuwait, Oman, Qatar, Saudi Arabia, United Arab Emirates) Asia Pacific (Australia, Cambodia, China, Hong Kong, India, Indonesia, Japan, Kyrgyzstan, Macao, Malaysia, Mongolia, Myanmar, New Zealand, Pakistan, Philippines, Singapore, South Korea, Sri Lanka, Taiwan, Thailand, Uzbekistan, Vietnam) Africa (Algeria, Egypt, Ethiopia, Ghana, Kenya, Libya, Morocco, Nigeria, South Africa, Sudan, Uganda) |
| Base Year | 2025 |
| Forecast | 2026-2032 |
| Historical Data | 2022-2024 |
| Quantitative Coverage | Procedure Numbers, Market Size, Market Shares, Market Forecasts, Market Growth Rates, Units Sold, and Average Selling Prices. |
| Qualitative Coverage | Market Growth Trends, Market Limiters, Competitive Analysis & SWOT for Top Competitors, Mergers & Acquisitions, Company Profiles, Product Portfolios, FDA Recalls, Disruptive Technologies, Disease Overviews. |
| Data Sources | Primary Interviews with Industry Leaders, Government Physician Data, Regulatory Data, Hospital Private Data, Import & Export Data, iData Research Internal Database. |
CONTACT US FOR ADDITIONAL INFORMATION
For full segmentation and any questions regarding research coverage, please contact us for a complimentary demo of the full report.