| Figure 1‑1: Digital Dentistry Market Share Ranking by Segment, Europe, 2023 |
| Figure 1‑2: Companies Researched in This Report (1 of 2) |
| Figure 1‑3: Companies Researched in This Report (2 of 2) |
| Figure 1‑4: Factors Impacting the Digital Dentistry Market by Segment, Europe (1 of 2) |
| Figure 1‑5: Factors Impacting the Digital Dentistry Market by Segment, Europe (2 of 2) |
| Figure 1‑6: Recent Events in the Digital Dentistry Market, Europe, 2021 – 2023 (1 of 2) |
| Figure 1‑7: Recent Events in the Digital Dentistry Market, Europe, 2021 – 2023 (2 of 3) |
| Figure 1‑8: Recent Events in the Digital Dentistry Market, Europe, 2021– 2023 (3 of 3) |
| Figure 1‑9: Digital Dentistry Markets Covered, Europe (1 of 2) |
| Figure 1‑10: Digital Dentistry Markets Covered, Europe (2 of 2) |
| Figure 1‑11: Key Report Updates |
| Figure 1‑12: Version History |
| Figure 2‑1: Digital Dentistry Market by Segment, Worst Case Scenario, Europe, 2020 – 2030 (€M) |
| Figure 2‑2: Digital Dentistry Market by Segment, Base Case Scenario, Europe, 2020 – 2030 (€M) |
| Figure 2‑3: Digital Dentistry Market by Segment, Best Case Scenario, Europe, 2020 – 2030 (€M) |
| Figure 4‑1: CAD/CAM Systems by Company (1 of 2) |
| Figure 4‑2: CAD/CAM Systems by Company (2 of 2) |
| Figure 4‑3: CAD/CAM Materials by Company (1 of 2) |
| Figure 4‑4: CAD/CAM Materials by Company (2 of 2) |
| Figure 4‑5: Dental 3D Printers by Company (1 of 2) |
| Figure 4‑6: Dental 3D Printers by Company (2 of 2) |
| Figure 4‑7: Dental 3D Printer Material by Company (1 of 2) |
| Figure 4‑8: Dental 3D Printer Material by Company (2 of 2) |
| Figure 4‑9: CAD/CAM Software Market by Company |
| Figure 4‑10: Class 2 Device Recall DEXIS Titanium Intraoral Sensor |
| Figure 4‑11: Class 2 Device Recall Powder, Porcelain, Porcelain Powder Blanks for Dental Restorations |
| Figure 4‑12: Class 2 Device Recall Ivoclar Vivadent |
| Figure 4‑13: Class 2 Device Recall FLEXCERA SMILE |
| Figure 4‑14: Class 2 Device Recall FLEXCERA BASE |
| Figure 4‑15: Intraoral Scanners as Periodontal and Dental Pathologies Diagnosis Tools (Odonto3D) |
| Figure 4‑16: Accuracy of CBCT Imaging and Intraoral Scanner in Dental Plaster Casts Digitization: A Validity and Reliability Study |
| Figure 4‑17: Orthodontic Patient Experience of Intraoral Scans Versus Alginate Impressions (OPESI) |
| Figure 4‑18: Tooth Wear Monitoring Using Intraoral Scanner |
| Figure 4‑19: Assessment of the Accuracy of Surgical Guide Designed from Digital Impression, Dental Model Scanning Using CBCT and Desktop Scanner in Computer Guided Implantology |
| Figure 4‑20: Patient Satisfaction & Retention of Milled, 3D Printed and Conventional Complete Dentures |
| Figure 4‑21: TetricCAD Crown Clinical Study |
| Figure 4‑22: Clinical Performance of Chairside CAD/CAM Restorations |
| Figure 4‑23: Clinical Outcomes of CAD/CAM Single-Retainer Monolithic Zirconia Ceramic Resin-Bonded Fixed Dentures Bonded with Two Different Resin Cements |
| Figure 4‑24: Clinical Performance of Milled Resin Composite in Restoration of Endodontically Treated Posterior Teeth Over One Year |
| Figure 4‑25: Clinical Performance of CAD/CAM Splint Materials |
| Figure 4‑26: Color Stability of Two Different Resin Matrix Ceramics |
| Figure 4‑27: Clinical Performance of Ceramic Laminate Veneers Made with Celtra Duo Press and IPS e.Max Press Ceramic |
| Figure 4‑28: Clinical Assessment of Indirect Restoration Fabricated from Nano Hybrid Composite Blocks Versus Ceramic Blocks in Badly Broken Teeth One Year Follow up |
| Figure 4‑29: Occlusal Contact Trueness Affected by Six Chairside CAD/CAM Ceramic Materials |
| Figure 4‑30: Survival of Endocrowns Made from Different Ceramics |
| Figure 4‑31: 3 Years Clinical Evaluation of 3D Printed Resin Composite Fixed Dental Prosthesis |
| Figure 4‑32: Conventional Versus Digital 3D Printed Complete Removable Dentures (CRD) |
| Figure 4‑33: Comparison of Bracket Bonding Variables Using 3D Printed Bonding Guide Versus Digital Indirect Bonding |
| Figure 4‑34: Permanent Resin Restorations Fabricated by Three Dimension Printer |
| Figure 4‑35: Complete Denture Tooth Movement in Digital Light Processing Versus Conventional Fabrication Techniques |
| Figure 5‑1: Currency Exchange Rate, 2023 |
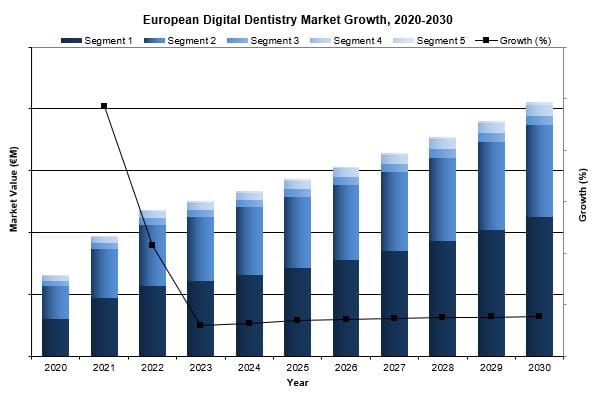
| Figure 5‑2: Digital Dentistry Market by Segment, Europe, 2020 – 2030 (€M) |
| Figure 5‑3: Digital Dentistry Market by Segment, Europe, 2020 – 2030 (US$M) |
| Figure 5‑4: Leading Competitors, Digital Dentistry Market, Europe, 2023 |
| Figure 5‑5: SWOT Analysis, 3D Systems |
| Figure 5‑6: SWOT Analysis, 3Shape |
| Figure 5‑7: SWOT Analysis, Align Technology |
| Figure 5‑8: SWOT Analysis, Carbon |
| Figure 5‑9: SWOT Analysis, Dentsply Sirona (1 of 2) |
| Figure 5‑10: SWOT Analysis, Dentsply Sirona (2 of 2) |
| Figure 5‑11: SWOT Analysis, Glidewell Dental |
| Figure 5‑12: SWOT Analysis, Ivoclar |
| Figure 5‑13: SWOT Analysis, Planmeca |
| Figure 5‑14: SWOT Analysis, VITA North America |
| Figure 7‑1: CAD/CAM Device Market by Segment, Europe, 2020 – 2030 (US$M) |
| Figure 7‑2: CAD/CAM Device Market, Europe, 2020 – 2030 |
| Figure 7‑3: Units Sold by Country, CAD/CAM Device Market, Europe, 2020 – 2030 |
| Figure 7‑4: Average Selling Price by Country, CAD/CAM Device Market, Europe, 2020 – 2030 (€) |
| Figure 7‑5: Average Selling Price by Country, CAD/CAM Device Market, Europe, 2020 – 2030 (US$) |
| Figure 7‑6: Market Value by Country, CAD/CAM Device Market, Europe, 2020 – 2030 (€M) |
| Figure 7‑7: Market Value by Country, CAD/CAM Device Market, Europe, 2020 – 2030 (US$M) |
| Figure 7‑8: CAD/CAM Milling System Market by Configuration, Europe, 2020 – 2030 (€M) |
| Figure 7‑9: CAD/CAM Milling System Market by Configuration, Europe, 2020 – 2030 (US$M) |
| Figure 7‑10: CAD/CAM Milling System Market by Configuration, Europe, 2020 – 2030 |
| Figure 7‑11: Units Sold by Country, CAD/CAM Milling System Market by Configuration, Europe, 2020 – 2030 |
| Figure 7‑12: Average Selling Price by Country, CAD/CAM Milling System Market by Configuration, Europe, 2020 – 2030 (€) |
| Figure 7‑13: Average Selling Price by Country, CAD/CAM Milling System Market by Configuration, Europe, 2020 – 2030 (US$) |
| Figure 7‑14: Market Value by Country, CAD/CAM Milling System Market by Configuration, Europe, 2020 – 2030 (€M) |
| Figure 7‑15: Market Value by Country, CAD/CAM Milling System Market by Configuration, Europe, 2020 – 2030 (US$M) |
| Figure 7‑16: Tabletop CAD/CAM Milling System Market, Europe, 2020 – 2030 |
| Figure 7‑17: Units Sold by Country, Tabletop CAD/CAM Milling System Market, Europe, 2020 – 2030 |
| Figure 7‑18: Average Selling Price by Country, Tabletop CAD/CAM Milling System Market, Europe, 2020 – 2030 (€) |
| Figure 7‑19: Average Selling Price by Country, Tabletop CAD/CAM Milling System Market, Europe, 2020 – 2030 (US$) |
| Figure 7‑20: Market Value by Country, Tabletop CAD/CAM Milling System Market, Europe, 2020 – 2030 (€M) |
| Figure 7‑21: Market Value by Country, Tabletop CAD/CAM Milling System Market, Europe, 2020 – 2030 (US$M) |
| Figure 7‑22: Benchtop CAD/CAM Milling System Market, Europe, 2020 – 2030 |
| Figure 7‑23: Units Sold by Country, Benchtop CAD/CAM Milling System Market, Europe, 2020 – 2030 |
| Figure 7‑24: Average Selling Price by Country, Benchtop CAD/CAM Milling System Market, Europe, 2020 – 2030 (€) |
| Figure 7‑25: Average Selling Price by Country, Benchtop CAD/CAM Milling System Market, Europe, 2020 – 2030 (US$) |
| Figure 7‑26: Market Value by Country, Benchtop CAD/CAM Milling System Market, Europe, 2020 – 2030 (€M) |
| Figure 7‑27: Market Value by Country, Benchtop CAD/CAM Milling System Market, Europe, 2020– 2030 (US$M) |
| Figure 7‑28: Units Sold by Country, Standalone CAD/CAM Milling System Market, Europe, 2020 – 2030 |
| Figure 7‑29: Average Selling Price by Country, Standalone CAD/CAM Milling System Market, Europe, 2020 – 2030 (€) |
| Figure 7‑30: Average Selling Price by Country, Standalone CAD/CAM Milling System Market, Europe, 2020 – 2030 (US$) |
| Figure 7‑31: Market Value by Country, Standalone CAD/CAM Milling System Market, Europe, 2020 – 2030 (€M) |
| Figure 7‑32: Market Value by Country, Standalone CAD/CAM Milling System Market, Europe, 2020– 2030 (US$M) |
| Figure 7‑33: CAD/CAM Milling System Market by Milling Type, Europe, 2020 – 2030 (€M) |
| Figure 7‑34: CAD/CAM Milling System Market by Milling Type, Europe, 2020 – 2030 (US$M) |
| Figure 7‑35: Wet CAD/CAM Milling System Market, Europe, 2020 – 2030 |
| Figure 7‑36: Units Sold by Country, Wet CAD/CAM Milling System Market, Europe, 2020 – 2030 |
| Figure 7‑37: Average Selling Price by Country, Wet CAD/CAM Milling System Market, Europe, 2020 – 2030 (€) |
| Figure 7‑38: Average Selling Price by Country, Wet CAD/CAM Milling System Market, Europe, 2020 – 2030 (US$) |
| Figure 7‑39: Market Value by Country, Wet CAD/CAM Milling System Market, Europe, 2020 – 2030 (€M) |
| Figure 7‑40: Market Value by Country, Wet CAD/CAM Milling System Market, Europe, 2020 – 2030 (US$M) |
| Figure 7‑41: Dry CAD/CAM Milling System Market, Europe, 2020 – 2030 |
| Figure 7‑42: Units Sold by Country, Dry CAD/CAM Milling System Market, Europe, 2020 – 2030 |
| Figure 7‑43: Average Selling Price by Country, Dry CAD/CAM Milling System Market, Europe, 2020 – 2030 (€) |
| Figure 7‑44: Average Selling Price by Country, Dry CAD/CAM Milling System Market, Europe, 2020 – 2030 (US$) |
| Figure 7‑45: Market Value by Country, Dry CAD/CAM Milling System Market, Europe, 2020 – 2030 (€M) |
| Figure 7‑46: Market Value by Country, Dry CAD/CAM Milling System Market, Europe, 2020– 2030 (US$M) |
| Figure 7‑47: Combination Wet/Dry CAD/CAM Milling System Market, Europe, 2020 – 2030 |
| Figure 7‑48: Units Sold by Country, Combination Wet/Dry CAD/CAM Milling System Market, Europe, 2020 – 2030 |
| Figure 7‑49: Average Selling Price by Country, Combination Wet/Dry CAD/CAM Milling System Market, Europe, 2020 – 2030 (€) |
| Figure 7‑50: Average Selling Price by Country, Combination Wet/Dry CAD/CAM Milling System Market, Europe, 2020 – 2030 (US$) |
| Figure 7‑51: Market Value by Country, Combination Wet/Dry CAD/CAM Milling System Market, Europe, 2020 – 2030 (€M) |
| Figure 7‑52: Market Value by Country, Combination Wet/Dry CAD/CAM Milling System Market, Europe, 2020– 2030 (US$M) |
| Figure 7‑53: Standalone CAD/CAM Scanner Market, Europe, 2020 – 2030 |
| Figure 7‑54: Units Sold by Country, Standalone CAD/CAM Scanner Market, Europe, 2020 – 2030 |
| Figure 7‑55: Average Selling Price by Country, Standalone CAD/CAM Scanner Market, Europe, 2020 – 2030 (€) |
| Figure 7‑56: Average Selling Price by Country, Standalone CAD/CAM Scanner Market, Europe, 2020 – 2030 (US$) |
| Figure 7‑57: Market Value by Country, Standalone CAD/CAM Scanner Market, Europe, 2020 – 2030 (€M) |
| Figure 7‑58: Market Value by Country, Standalone CAD/CAM Scanner Market, Europe, 2020 – 2030 (US$M) |
| Figure 7‑59: Chairside CAD/CAM System Market, Europe, 2020 – 2030 |
| Figure 7‑60: Units Sold by Country, Chairside CAD/CAM System Market, Europe, 2020 – 2030 |
| Figure 7‑61: Average Selling Price by Country, Chairside CAD/CAM System Market, Europe, 2020 – 2030 (€) |
| Figure 7‑62: Average Selling Price by Country, Chairside CAD/CAM System Market, Europe, 2020 – 2030 (US$) |
| Figure 7‑63: Market Value by Country, Chairside CAD/CAM System Market, Europe, 2020 – 2030 (€M) |
| Figure 7‑64: Market Value by Country, Chairside CAD/CAM System Market, Europe, 2020 – 2030 (US$M) |
| Figure 7‑65: Intraoral Scanner Market, Europe, 2020 – 2030 |
| Figure 7‑66: Units Sold by Country, Intraoral Scanner Market, Europe, 2020 – 2030 |
| Figure 7‑67: Average Selling Price by Country, Intraoral Scanner Market, Europe, 2020 – 2030 (€) |
| Figure 7‑68: Average Selling Price by Country, Intraoral Scanner Market, Europe, 2020 – 2030 (US$) |
| Figure 7‑69: Market Value by Country, Intraoral Scanner Market, Europe, 2020 – 2030 (€M) |
| Figure 7‑70: Market Value by Country, Intraoral Scanner Market, Europe, 2020 – 2030 (US$M) |
| Figure 7‑71: Leading Competitors, CAD/CAM Device Market, Europe, 2023 |
| Figure 7‑72: Leading Competitors by Country, CAD/CAM Milling System Market, Europe, 2023 |
| Figure 7‑73: Leading Competitors by Country, Standalone CAD/CAM Scanner Market, Europe, 2023 |
| Figure 7‑74: Leading Competitors by Country, Chairside CAD/CAM System Market, Europe, 2023 |
| Figure 7‑75: Leading Competitors by Country, Intraoral CAD/CAM Scanner Market, Europe, 2023 |
| Figure 8‑1: CAD/CAM Material Market by Segment, Europe, 2020 – 2030 (€M) |
| Figure 8‑2: CAD/CAM Material Market by Segment, Europe, 2020 – 2030 (US$M) |
| Figure 8‑3: Total CAD/CAM Material Market, Europe, 2020 – 2030 |
| Figure 8‑4: Units Sold by Country, Total CAD/CAM Material Market, Europe, 2020 – 2030 |
| Figure 8‑5: Average Selling Price by Country, Total CAD/CAM Material Market, Europe, 2020 – 2030 (€) |
| Figure 8‑6: Average Selling Price by Country, Total CAD/CAM Material Market, Europe, 2020 – 2030 (US$) |
| Figure 8‑7: Market Value by Country, Total CAD/CAM Material Market, Europe, 2020 – 2030 (€M) |
| Figure 8‑8: Market Value by Country, Total CAD/CAM Material Market, Europe, 2020 – 2030 (US$M) |
| Figure 8‑9: CAD/CAM Block Market by Product Type, Europe, 2020 – 2030 (€M) |
| Figure 8‑10: CAD/CAM Block Market by Product Type, Europe, 2020 – 2030 (US$M) |
| Figure 8‑11: Total CAD/CAM Block Market, Europe, 2020 – 2030 |
| Figure 8‑12: Units Sold by Country, Total CAD/CAM Block Market, Europe, 2020 – 2030 |
| Figure 8‑13: Average Selling Price by Country, Total CAD/CAM Block Market, Europe, 2020 – 2030 (€) |
| Figure 8‑14: Average Selling Price by Country, Total CAD/CAM Block Market, Europe, 2020 – 2030 (US$) |
| Figure 8‑15: Market Value by Country, Total CAD/CAM Block Market, Europe, 2020 – 2030 (€M) |
| Figure 8‑16: Market Value by Country, Total CAD/CAM Block Market, Europe, 2020 – 2030 (US$M) |
| Figure 8‑17: Temporary CAD/CAM Block Market by Material Type, Europe, 2020 – 2030 (€M) |
| Figure 8‑18: Temporary CAD/CAM Block Market by Material Type, Europe, 2020 – 2030 (US$M) |
| Figure 8‑19: Total Temporary CAD/CAM Block Market, Europe, 2020 – 2030 |
| Figure 8‑20: Units Sold by Country, Total Temporary CAD/CAM Block Market, Europe, 2020 – 2030 |
| Figure 8‑21: Average Selling Price by Country, Total Temporary CAD/CAM Block Market, Europe, 2020 – 2030 (€) |
| Figure 8‑22: Average Selling Price by Country, Total Temporary CAD/CAM Block Market, Europe, 2020 – 2030 (US$) |
| Figure 8‑23: Market Value by Country, Total Temporary CAD/CAM Block Market, Europe, 2020 – 2030 (€M) |
| Figure 8‑24: Market Value by Country, Total Temporary CAD/CAM Block Market, Europe, 2020 – 2030 (US$M) |
| Figure 8‑25: PMMA Temporary CAD/CAM Block Market, Europe, 2020 – 2030 |
| Figure 8‑26: Units Sold by Country, PMMA Temporary CAD/CAM Block Market, Europe, 2020 – 2030 |
| Figure 8‑27: Average Selling Price by Country, PMMA Temporary CAD/CAM Block Market, Europe, 2020 – 2030 (€) |
| Figure 8‑28: Average Selling Price by Country, PMMA Temporary CAD/CAM Block Market, Europe, 2020 – 2030 (US$) |
| Figure 8‑29: Market Value by Country, PMMA Temporary CAD/CAM Block Market, Europe, 2020 – 2030 (€M) |
| Figure 8‑30: Market Value by Country, PMMA Temporary CAD/CAM Block Market, Europe, 2020 – 2030 (US$M) |
| Figure 8‑31: Composite Temporary CAD/CAM Block Market, Europe, 2020 – 2030 |
| Figure 8‑32: Units Sold by Country, Composite Temporary CAD/CAM Block Market, Europe, 2020 – 2030 |
| Figure 8‑33: Average Selling Price by Country, Composite Temporary CAD/CAM Block Market, Europe, 2020 – 2030 (€) |
| Figure 8‑34: Average Selling Price by Country, Composite Temporary CAD/CAM Block Market, Europe, 2020 – 2030 (US$) |
| Figure 8‑35: Market Value by Country, Composite Temporary CAD/CAM Block Market, Europe, 2020 – 2030 (€M) |
| Figure 8‑36: Market Value by Country, Composite Temporary CAD/CAM Block Market, Europe, 2020– 2030 (US$M) |
| Figure 8‑37: Permanent CAD/CAM Block Market by Material Type, Europe, 2020 – 2030 (€M) |
| Figure 8‑38: Permanent CAD/CAM Block Market by Material Type, Europe, 2020 – 2030 (US$M) |
| Figure 8‑39: Total Permanent CAD/CAM Block Market, Europe, 2020 – 2030 |
| Figure 8‑40: Units Sold by Country, Total Permanent CAD/CAM Block Market, Europe, 2020 – 2030 |
| Figure 8‑41: Average Selling Price by Country, Total Permanent CAD/CAM Block Market, Europe, 2020 – 2030 (€) |
| Figure 8‑42: Average Selling Price by Country, Total Permanent CAD/CAM Block Market, Europe, 2020 – 2030 (US$) |
| Figure 8‑43: Market Value by Country, Total Permanent CAD/CAM Block Market, Europe, 2020 – 2030 (€M) |
| Figure 8‑44: Market Value by Country, Total Permanent CAD/CAM Block Market, Europe, 2020 – 2030 (US$M) |
| Figure 8‑45: Zirconia Permanent CAD/CAM Block Market, Europe, 2020 – 2030 |
| Figure 8‑46: Units Sold by Country, Zirconia Permanent CAD/CAM Block Market, Europe, 2020 – 2030 |
| Figure 8‑47: Average Selling Price by Country, Zirconia Permanent CAD/CAM Block Market, Europe, 2020 – 2030 (€) |
| Figure 8‑48: Average Selling Price by Country, Zirconia Permanent CAD/CAM Block Market, Europe, 2020 – 2030 (US$) |
| Figure 8‑49: Market Value by Country, Zirconia Permanent CAD/CAM Block Market, Europe, 2020 – 2030 (€M) |
| Figure 8‑50: Market Value by Country, Zirconia Permanent CAD/CAM Block Market, Europe, 2020 – 2030 (US$M) |
| Figure 8‑51: Lithium Disilicate Permanent CAD/CAM Block Market, Europe, 2020 – 2030 |
| Figure 8‑52: Units Sold by Country, Lithium Disilicate Permanent CAD/CAM Block Market, Europe, 2020 – 2030 |
| Figure 8‑53: Average Selling Price by Country, Lithium Disilicate Permanent CAD/CAM Block Market, Europe, 2020 – 2030 (€) |
| Figure 8‑54: Average Selling Price by Country, Lithium Disilicate Permanent CAD/CAM Block Market, Europe, 2020 – 2030 (US$) |
| Figure 8‑55: Market Value by Country, Lithium Disilicate Permanent CAD/CAM Block Market, Europe, 2020 – 2030 (€M) |
| Figure 8‑56: Market Value by Country, Lithium Disilicate Permanent CAD/CAM Block Market, Europe, 2020– 2030 (US$M) |
| Figure 8‑57: Other Ceramic Permanent CAD/CAM Block Market, Europe, 2020 – 2030 |
| Figure 8‑58: Units Sold by Country, Other Ceramic Permanent CAD/CAM Block Market, Europe, 2020 – 2030 |
| Figure 8‑59: Average Selling Price by Country, Other Ceramic Permanent CAD/CAM Block Market, Europe, 2020 – 2030 (€) |
| Figure 8‑60: Average Selling Price by Country, Other Ceramic Permanent CAD/CAM Block Market, Europe, 2020 – 2030 (US$) |
| Figure 8‑61: Market Value by Country, Other Ceramic Permanent CAD/CAM Block Market, Europe, 2020 – 2030 (€M) |
| Figure 8‑62: Market Value by Country, Other Ceramic Permanent CAD/CAM Block Market, Europe, 2020 – 2030 (US$M) |
| Figure 8‑63: CAD/CAM Disc Market by Product Type, Europe, 2020 – 2030 (€M) |
| Figure 8‑64: CAD/CAM Disc Market by Product Type, Europe, 2020 – 2030 (US$M) |
| Figure 8‑65: Total CAD/CAM Disc Market, Europe, 2020 – 2030 |
| Figure 8‑66: Units Sold by Country, Total CAD/CAM Disc Market, Europe, 2020 – 2030 |
| Figure 8‑67: Average Selling Price by Country, Total CAD/CAM Disc Market, Europe, 2020 – 2030 (€) |
| Figure 8‑68: Average Selling Price by Country, Total CAD/CAM Disc Market, Europe, 2020 – 2030 (US$) |
| Figure 8‑69: Market Value by Country, Total CAD/CAM Disc Market, Europe, 2020 – 2030 (€M) |
| Figure 8‑70: Market Value by Country, Total CAD/CAM Disc Market, Europe, 2020 – 2030 (US$M) |
| Figure 8‑71: Temporary CAD/CAM Disc Market by Material Type, Europe, 2020 – 2030 (€M) |
| Figure 8‑72: Temporary CAD/CAM Disc Market by Material Type, Europe, 2020 – 2030 (US$M) |
| Figure 8‑73: Total Temporary CAD/CAM Disc Market, Europe, 2020 – 2030 |
| Figure 8‑74: Units Sold by Country, Total Temporary CAD/CAM Disc Market, Europe, 2020 – 2030 |
| Figure 8‑75: Average Selling Price by Country, Total Temporary CAD/CAM Disc Market, Europe, 2020 – 2030 (€) |
| Figure 8‑76: Average Selling Price by Country, Total Temporary CAD/CAM Disc Market, Europe, 2020 – 2030 (US$) |
| Figure 8‑77: Market Value by Country, Total Temporary CAD/CAM Disc Market, Europe, 2020 – 2030 (€M) |
| Figure 8‑78: Market Value by Country, Total Temporary CAD/CAM Disc Market, Europe, 2020 – 2030 (US$M) |
| Figure 8‑79: PMMA Temporary CAD/CAM Disc Market, Europe, 2020 – 2030 |
| Figure 8‑80: Units Sold by Country, PMMA Temporary CAD/CAM Disc Market, Europe, 2020 – 2030 |
| Figure 8‑81: Average Selling Price by Country, PMMA Temporary CAD/CAM Disc Market, Europe, 2020 – 2030 (€) |
| Figure 8‑82: Average Selling Price by Country, PMMA Temporary CAD/CAM Disc Market, Europe, 2020 – 2030 (US$) |
| Figure 8‑83: Market Value by Country, PMMA Temporary CAD/CAM Disc Market, Europe, 2020 – 2030 (€M) |
| Figure 8‑84: Market Value by Country, PMMA Temporary CAD/CAM Disc Market, Europe, 2020 – 2030 (US$M) |
| Figure 8‑85: Composite Temporary CAD/CAM Disc Market, Europe, 2020 – 2030 |
| Figure 8‑86: Units Sold by Country, Composite Temporary CAD/CAM Disc Market, Europe, 2020 – 2030 |
| Figure 8‑87: Average Selling Price by Country, Composite Temporary CAD/CAM Disc Market, Europe, 2020 – 2030 (€) |
| Figure 8‑88: Average Selling Price by Country, Composite Temporary CAD/CAM Disc Market, Europe, 2020 – 2030 (US$) |
| Figure 8‑89: Market Value by Country, Composite Temporary CAD/CAM Disc Market, Europe, 2020 – 2030 (€M) |
| Figure 8‑90: Market Value by Country, Composite Temporary CAD/CAM Disc Market, Europe, 2020– 2030 (US$M) |
| Figure 8‑91: Permanent CAD/CAM Disc Market by Material Type, Europe, 2020 – 2030 (€M) |
| Figure 8‑92: Permanent CAD/CAM Disc Market by Material Type, Europe, 2020 – 2030 (US$M) |
| Figure 8‑93: Total Permanent CAD/CAM Disc Market, Europe, 2020 – 2030 |
| Figure 8‑94: Units Sold by Country, Total Permanent CAD/CAM Disc Market, Europe, 2020 – 2030 |
| Figure 8‑95: Average Selling Price by Country, Total Permanent CAD/CAM Disc Market, Europe, 2020 – 2030 (€) |
| Figure 8‑96: Average Selling Price by Country, Total Permanent CAD/CAM Disc Market, Europe, 2020 – 2030 (US$) |
| Figure 8‑97: Market Value by Country, Total Permanent CAD/CAM Disc Market, Europe, 2020 – 2030 (€M) |
| Figure 8‑98: Market Value by Country, Total Permanent CAD/CAM Disc Market, Europe, 2020 – 2030 (US$M) |
| Figure 8‑99: Zirconia Permanent CAD/CAM Disc Market, Europe, 2020 – 2030 |
| Figure 8‑100: Units Sold by Country, Zirconia Permanent CAD/CAM Disc Market, Europe, 2020 – 2030 |
| Figure 8‑101: Average Selling Price by Country, Zirconia Permanent CAD/CAM Disc Market, Europe, 2020 – 2030 (€) |
| Figure 8‑102: Average Selling Price by Country, Zirconia Permanent CAD/CAM Disc Market, Europe, 2020 – 2030 (US$) |
| Figure 8‑103: Market Value by Country, Zirconia Permanent CAD/CAM Disc Market, Europe, 2020 – 2030 (€M) |
| Figure 8‑104: Market Value by Country, Zirconia Permanent CAD/CAM Disc Market, Europe, 2020 – 2030 (US$M) |
| Figure 8‑105: Metal Permanent CAD/CAM Disc Market, Europe, 2020 – 2030 |
| Figure 8‑106: Units Sold by Country, Metal Permanent CAD/CAM Disc Market, Europe, 2020 – 2030 |
| Figure 8‑107: Average Selling Price by Country, Metal Permanent CAD/CAM Disc Market, Europe, 2020 – 2030 (€) |
| Figure 8‑108: Average Selling Price by Country, Metal Permanent CAD/CAM Disc Market, Europe, 2020 – 2030 (US$) |
| Figure 8‑109: Market Value by Country, Metal Permanent CAD/CAM Disc Market, Europe, 2020 – 2030 (€M) |
| Figure 8‑110: Market Value by Country, Metal Permanent CAD/CAM Disc Market, Europe, 2020– 2030 (US$M) |
| Figure 8‑111: Other Ceramic Permanent CAD/CAM Disc Market, Europe, 2020 – 2030 |
| Figure 8‑112: Units Sold by Country, Other Ceramic Permanent CAD/CAM Disc Market, Europe, 2020 – 2030 |
| Figure 8‑113: Average Selling Price by Country, Other Ceramic Permanent CAD/CAM Disc Market, Europe, 2020 – 2030 (€) |
| Figure 8‑114: Average Selling Price by Country, Other Ceramic Permanent CAD/CAM Disc Market, Europe, 2020 – 2030 (US$) |
| Figure 8‑115: Market Value by Country, Other Ceramic Permanent CAD/CAM Disc Market, Europe, 2020 – 2030 (€M) |
| Figure 8‑116: Market Value by Country, Other Ceramic Permanent CAD/CAM Disc Market, Europe, 2020 – 2030 (US$M) |
| Figure 8‑117: Leading Competitors, CAD/CAM Material Market, Europe, 2023 |
| Figure 8‑118: Leading Competitors by Country, CAD/CAM Block Market, Europe, 2023 |
| Figure 8‑119: Leading Competitors by Country, CAD/CAM Disc Market, Europe, 2023 |
| Figure 9‑1: Dental 3D Printer Market by Segment, Europe, 2020 – 2030 (€M) |
| Figure 9‑2: Dental 3D Printer Market by Segment, Europe, 2020 – 2030 (US$M) |
| Figure 9‑3: Dental 3D Printer Market, Europe, 2020 – 2030 |
| Figure 9‑4: Units Sold by Country, Dental 3D Printer Market, Europe, 2020 – 2030 |
| Figure 9‑5: Average Selling Price by Country, Dental 3D Printer Market, Europe, 2020 – 2030 (€) |
| Figure 9‑6: Average Selling Price by Country, Dental 3D Printer Market, Europe, 2020 – 2030 (US$) |
| Figure 9‑7: Market Value by Country, Dental 3D Printer Market, Europe, 2020 – 2030 (€M) |
| Figure 9‑8: Market Value by Country, Dental 3D Printer Market, Europe, 2020 – 2030 (US$M) |
| Figure 9‑9: Metal/Other Dental 3D Printer Market, Europe, 2020 – 2030 |
| Figure 9‑10: Units Sold by Country, Metal/Other Dental 3D Printer Market, Europe, 2020 – 2030 |
| Figure 9‑11: Average Selling Price by Country, Metal/Other Dental 3D Printer Market, Europe, 2020 – 2030 (€) |
| Figure 9‑12: Average Selling Price by Country, Metal/Other Dental 3D Printer Market, Europe, 2020 – 2030 (US$) |
| Figure 9‑13: Market Value by Country, Metal/Other Dental 3D Printer Market, Europe, 2020 – 2030 (€M) |
| Figure 9‑14: Market Value by Country, Metal/Other Dental 3D Printer Market, Europe, 2020 – 2030 (US$M) |
| Figure 9‑15: Resin Dental 3D Printer Market by Segment, Europe, 2020 – 2030 (€M) |
| Figure 9‑16: Resin Dental 3D Printer Market by Segment, Europe, 2020 – 2030 (US$M) |
| Figure 9‑17: Total Resin Dental 3D Printer Market, Europe, 2020 – 2030 |
| Figure 9‑18: Units Sold by Country, Total Resin Dental 3D Printer Market, Europe, 2020 – 2030 |
| Figure 9‑19: Average Selling Price by Country, Total Resin Dental 3D Printer Market, Europe, 2020 – 2030 (€) |
| Figure 9‑20: Average Selling Price by Country, Total Resin Dental 3D Printer Market, Europe, 2020 – 2030 (US$) |
| Figure 9‑21: Market Value by Country, Total Resin Dental 3D Printer Market, Europe, 2020 – 2030 (€M) |
| Figure 9‑22: Market Value by Country, Total Resin Dental 3D Printer Market, Europe, 2020 – 2030 (US$M) |
| Figure 9‑23: Digital Light Processing Resin Dental 3D Printer Market, Europe, 2020 – 2030 |
| Figure 9‑24: Units Sold by Country, Digital Light Processing Resin Dental 3D Printer Market, Europe, 2020 – 2030 |
| Figure 9‑25: Average Selling Price by Country, Digital Light Processing Resin Dental 3D Printer Market, Europe, 2020 – 2030 (€) |
| Figure 9‑26: Average Selling Price by Country, Digital Light Processing Resin Dental 3D Printer Market, Europe, 2020 – 2030 (US$) |
| Figure 9‑27: Market Value by Country, Digital Light Processing Resin Dental 3D Printer Market, Europe, 2020 – 2030 (€M) |
| Figure 9‑28: Market Value by Country, Digital Light Processing Resin Dental 3D Printer Market, Europe, 2020 – 2030 (US$M) |
| Figure 9‑29: Stereolithography Apparatus Resin Dental 3D Printer Market, Europe, 2020 – 2030 |
| Figure 9‑30: Units Sold by Country, Stereolithography Apparatus Resin Dental 3D Printer Market, Europe, 2020 – 2030 |
| Figure 9‑31: Average Selling Price by Country, Stereolithography Apparatus Resin Dental 3D Printer Market, Europe, 2020 – 2030 (€) |
| Figure 9‑32: Average Selling Price by Country, Stereolithography Apparatus Resin Dental 3D Printer Market, Europe, 2020 – 2030 (US$) |
| Figure 9‑33: Market Value by Country, Stereolithography Apparatus Resin Dental 3D Printer Market, Europe, 2020 – 2030 (€M) |
| Figure 9‑34: Market Value by Country, Stereolithography Apparatus Resin Dental 3D Printer Market, Europe, 2020– 2030 (US$M) |
| Figure 9‑35: Liquid-Crystal Display Resin Dental 3D Printer Market, Europe, 2020 – 2030 |
| Figure 9‑36: Units Sold by Country, Liquid-Crystal Display Resin Dental 3D Printer Market, Europe, 2020 – 2030 |
| Figure 9‑37: Average Selling Price by Country, Liquid-Crystal Display Resin Dental 3D Printer Market, Europe, 2020 – 2030 (€) |
| Figure 9‑38: Average Selling Price by Country, Liquid-Crystal Display Resin Dental 3D Printer Market, Europe, 2020 – 2030 (US$) |
| Figure 9‑39: Market Value by Country, Liquid-Crystal Display Resin Dental 3D Printer Market, Europe, 2020 – 2030 (€M) |
| Figure 9‑40: Market Value by Country, Liquid-Crystal Display Resin Dental 3D Printer Market, Europe, 2020 – 2030 (US$M) |
| Figure 9‑41: Jet Printing Resin Dental 3D Printer Market, Europe, 2020 – 2030 |
| Figure 9‑42: Units Sold by Country, Jet Printing Resin Dental 3D Printer Market, Europe, 2020 – 2030 |
| Figure 9‑43: Average Selling Price by Country, Jet Printing Resin Dental 3D Printer Market, Europe, 2020 – 2030 (€) |
| Figure 9‑44: Average Selling Price by Country, Jet Printing Resin Dental 3D Printer Market, Europe, 2020 – 2030 (US$) |
| Figure 9‑45: Market Value by Country, Jet Printing Resin Dental 3D Printer Market, Europe, 2020 – 2030 (€M) |
| Figure 9‑46: Market Value by Country, Jet Printing Resin Dental 3D Printer Market, Europe, 2020 – 2030 (US$M) |
| Figure 9‑47: Leading Competitors, Dental 3D Printer Market, Europe, 2023 |
| Figure 9‑48: Leading Competitors by Country, Dental 3D Printer Market, Europe, 2023 |
| Figure 10‑1: Dental 3D Printer Material Market by Segment, Europe, 2020 – 2030 (€M) |
| Figure 10‑2: Dental 3D Printer Material Market by Segment, Europe, 2020 – 2030 (US$M) |
| Figure 10‑3: Dental 3D Printer Material Market, Europe, 2020 – 2030 |
| Figure 10‑4: Units Sold by Country, Dental 3D Printer Material Market, Europe, 2020 – 2030 |
| Figure 10‑5: Average Selling Price by Country, Dental 3D Printer Material Market, Europe, 2020 – 2030 (€) |
| Figure 10‑6: Average Selling Price by Country, Dental 3D Printer Material Market, Europe, 2020 – 2030 (US$) |
| Figure 10‑7: Market Value by Country, Dental 3D Printer Material Market, Europe, 2020 – 2030 (€M) |
| Figure 10‑8: Market Value by Country, Dental 3D Printer Material Market, Europe, 2020 – 2030 (US$M) |
| Figure 10‑9: Resin Dental 3D Printer Material Market, Europe, 2020 – 2030 |
| Figure 10‑10: Units Sold by Country, Resin Dental 3D Printer Material Market, Europe, 2020 – 2030 |
| Figure 10‑11: Average Selling Price by Country, Resin Dental 3D Printer Material Market, Europe, 2020 – 2030 (€) |
| Figure 10‑12: Average Selling Price by Country, Resin Dental 3D Printer Material Market, Europe, 2020 – 2030 (US$) |
| Figure 10‑13: Market Value by Country, Resin Dental 3D Printer Material Market, Europe, 2020 – 2030 (€M) |
| Figure 10‑14: Market Value by Country, Resin Dental 3D Printer Material Market, Europe, 2020– 2030 (US$M) |
| Figure 10‑15: Metal Dental 3D Printer Material Market, Europe, 2020 – 2030 |
| Figure 10‑16: Units Sold by Country, Metal Dental 3D Printer Material Market, Europe, 2020 – 2030 |
| Figure 10‑17: Average Selling Price by Country, Metal Dental 3D Printer Material Market, Europe, 2020 – 2030 (€) |
| Figure 10‑18: Average Selling Price by Country, Metal Dental 3D Printer Material Market, Europe, 2020 – 2030 (US$) |
| Figure 10‑19: Market Value by Country, Metal Dental 3D Printer Material Market, Europe, 2020 – 2030 (€M) |
| Figure 10‑20: Market Value by Country, Metal Dental 3D Printer Material Market, Europe, 2020 – 2030 (US$M) |
| Figure 10‑21: Leading Competitors, Dental 3D Printer Material Market, Europe, 2023 |
| Figure 10‑22: Leading Competitors by Country, Dental 3D Printer Material Market, Europe, 2023 |
| Figure 11‑1: CAD/CAM Software Market by Segment, Europe, 2020 – 2030 (€M) |
| Figure 11‑2: CAD/CAM Software Market by Segment, Europe, 2020 – 2030 (US$M) |
| Figure 11‑3: CAD/CAM Software Market, Europe, 2020 – 2030 |
| Figure 11‑4: Units Sold by Country, CAD/CAM Software Market, Europe, 2020 – 2030 |
| Figure 11‑5: Average Selling Price by Country, CAD/CAM Software Market, Europe, 2020 – 2030 (€) |
| Figure 11‑6: Average Selling Price by Country, CAD/CAM Software Market, Europe, 2020 – 2030 (US$) |
| Figure 11‑7: Market Value by Country, CAD/CAM Software Market, Europe, 2020 – 2030 (€M) |
| Figure 11‑8: Market Value by Country, CAD/CAM Software Market, Europe, 2020 – 2030 (US$M) |
| Figure 11‑9: CAD Software Market, Europe, 2020 – 2030 |
| Figure 11‑10: Units Sold by Country, CAD Software Market, Europe, 2020 – 2030 |
| Figure 11‑11: Average Selling Price by Country, CAD Software Market, Europe, 2020 – 2030 (€) |
| Figure 11‑12: Average Selling Price by Country, CAD Software Market, Europe, 2020 – 2030 (US$) |
| Figure 11‑13: Market Value by Country, CAD Software Market, Europe, 2020 – 2030 (€M) |
| Figure 11‑14: Market Value by Country, CAD Software Market, Europe, 2020 – 2030 (US$M) |
| Figure 11‑15: CAM Software Market, Europe, 2020 – 2030 |
| Figure 11‑16: Units Sold by Country, CAM Software Market, Europe, 2020 – 2030 |
| Figure 11‑17: Average Selling Price by Country, CAM Software Market, Europe, 2020 – 2030 (€) |
| Figure 11‑18: Average Selling Price by Country, CAM Software Market, Europe, 2020 – 2030 (US$) |
| Figure 11‑19: Market Value by Country, CAM Software Market, Europe, 2020 – 2030 (€M) |
| Figure 11‑20: Market Value by Country, CAM Software Market, Europe, 2020 – 2030 (US$M) |
| Figure 11‑21: Leading Competitors, CAD/CAM Software Market, Europe, 2023 |
| Figure 11‑22: Leading Competitors by Country, CAD/CAM Software Market, Europe, 2023 |