| Figure 1‑1: Global Dental Prosthetic Market Share Ranking by Segment, Global, 2023 |
| Figure 1‑2: Companies Researched in This Report |
| Figure 1‑3: Factors Impacting the Global Dental Prosthetic Market by Segment, Global (1 of 2) |
| Figure 1‑4: Factors Impacting the Global Dental Prosthetic Market by Segment, Global (2 of 2) |
| Figure 1‑5: Recent Events in the Dental Prosthetic Market, Global, 2020 – 2024 (1 of 5) |
| Figure 1‑6: Recent Events in the Dental Prosthetic Market, Global, 2020 – 2024 (2 of 5) |
| Figure 1‑7: Recent Events in the Dental Prosthetic Market, Global, 2020 – 2024 (3 of 5) |
| Figure 1‑8: Recent Events in the Dental Prosthetic Market, Global, 2020 – 2024 (4 of 5) |
| Figure 1‑9: Recent Events in the Dental Prosthetic Market, Global, 2020 – 2024 (5 of 5) |
| Figure 1‑10: Dental Prosthetic Procedures Covered |
| Figure 1‑11: Dental Prosthetic Markets Covered |
| Figure 1‑12: Dental Prosthetic Regions Covered, Global (1 of 2) |
| Figure 1‑13: Dental Prosthetic Regions Covered, Global (2 of 2) |
| Figure 1‑14: Key Report Updates |
| Figure 1‑15: Version History |
| Figure 2‑1: Dental Prosthetic Market by Segment, Worst Case Scenario, Global, 2020 – 2030 (US$M) |
| Figure 2‑2: Dental Prosthetic Market by Segment, Base Case Scenario, Global, 2020 – 2030 (US$M) |
| Figure 2‑3: Dental Prosthetic Market by Segment, Best Case Scenario, Global, 2020 – 2030 (US$M) |
| Figure 4‑1: Class 2 Device Recall Ivoclar Vivadent |
| Figure 4‑2: RCT: Titanium vs FCZ vs Zirconia Framework |
| Figure 4‑3: TetricCAD Crown Clinical Study |
| Figure 4‑4: Custom-Made versus Prefabricated Zirconia Crowns for Primary Molars |
| Figure 4‑5: Feather Edge versus Deep Chamfer Finish Line Marginal Design in Complete Coverage Bruxzir Zirconia Crowns |
| Figure 4‑6: Success of Zirconia and Stainless Steel Crowns for Permanent Molars |
| Figure 4‑7: Anterior Zirconia vs. Resin Strip Crowns |
| Figure 4‑8: Success of Zirconia and Composite Strip Crowns for Primary Incisors |
| Figure 4‑9: Clinical Performance of Lithium Disilicate Crowns Restoring Endodontically Treated Teeth with Two Occlusal Preparation Schemes |
| Figure 4‑10: Clinical Performance of All-Ceramic Posterior Crowns |
| Figure 4‑11: Primary Molars Restoration Using CAD/CAM Crowns |
| Figure 4‑12: Wear Characteristics and Clinical Performance of Lithium Silicate versus Monolithic Zirconia Crowns |
| Figure 4‑13: Clinical Evaluation of Adhese Universal DC in the Indirect Restorative Therapy |
| Figure 4‑14: Clinical Evaluation of Posterior Indirect Resin Composite Restorations with PBE |
| Figure 4‑15: Evaluation of CAD/CAM Onlays Fabricated by Subtractive versus Additive Digital Manufacturing Techniques |
| Figure 4‑16: One Year Clinical Evaluation of Conservative versus Conventional Ceramic Onlays |
| Figure 4‑17: Functional Evaluation of Ceramic Onlay Restorations with Different Preparation Designs |
| Figure 4‑1: Clinical Performance of Long-Span Fixed Partial Dentures |
| Figure 1‑2: Conventional versus Neutral-Zone CAD/CAM Dentures Restoring Mandibular Resorbed Ridges |
| Figure 1‑3: Comparison between Conventional and Neutral Zone CAD/CAM Complete Dentures in Muscle Activity and Occlusal Accuracy |
| Figure 1‑4: Conventional versus Digital 3D Printed Complete Removable Dentures |
| Figure 1‑5: Patient Satisfaction & Retention of Milled, 3D Printed and Conventional Complete Dentures |
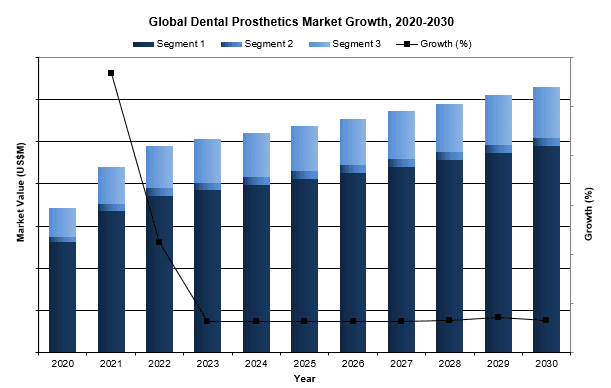
| Figure 5‑1: Dental Prosthetic Market by Segment, Global, 2020 – 2030 (US$M) |
| Figure 5‑2: Dental Prosthetic Market by Region, Global, 2020 – 2030 (US$M) |
| Figure 5‑3: Leading Competitors, Dental Prosthetic Market by Segment, Global, 2023 |
| Figure 6‑1: Crown and Bridge Procedures Covered |
| Figure 6‑2: Crown and Bridge Markets Covered |
| Figure 6‑3: Crown and Bridge Regions Covered, Global (1 of 2) |
| Figure 6‑4: Crown and Bridge Regions Covered, Global (2 of 2) |
| Figure 6‑5: Crown and Bridge Procedures by Segment, Global, 2020 – 2030 |
| Figure 6‑6: Crown and Bridge Procedures by Region, Global, 2020 – 2030 |
| Figure 6‑7: Crown and Bridge Procedures by Country, North America, 2020 – 2030 |
| Figure 6‑8: Crown and Bridge Procedures by Country, Latin America, 2020 – 2030 (1 of 2) |
| Figure 6‑9: Crown and Bridge Procedures by Country, Latin America, 2020 – 2030 (2 of 2) |
| Figure 6‑10: Crown and Bridge Procedures by Country, Western Europe, 2020 – 2030 (1 of 2) |
| Figure 6‑11: Crown and Bridge Procedures by Country, Western Europe, 2020 – 2030 (2 of 2) |
| Figure 6‑12: Crown and Bridge Procedures by Country, Central & Eastern Europe, 2020 – 2030 (1 of 2) |
| Figure 6‑13: Crown and Bridge Procedures by Country, Central & Eastern Europe, 2020 – 2030 (2 of 2) |
| Figure 6‑14: Crown and Bridge Procedures by Country, Middle East, 2020 – 2030 |
| Figure 6‑15: Crown and Bridge Procedures by Country, Asia-Pacific, 2020 – 2030 (1 of 3) |
| Figure 6‑16: Crown and Bridge Procedures by Country, Asia-Pacific, 2020 – 2030 (2 of 3) |
| Figure 6‑17: Crown and Bridge Procedures by Country, Asia-Pacific, 2020 – 2030 (3 of 3) |
| Figure 6‑18: Crown and Bridge Procedures by Country, Africa, 2020 – 2030 |
| Figure 6‑19: Crown Procedures by Region, Global, 2020 – 2030 |
| Figure 6‑20: Crown Procedures by Country, North America, 2020 – 2030 |
| Figure 6‑21: Crown Procedures by Country, Latin America, 2020 – 2030 (1 of 2) |
| Figure 6‑22: Crown Procedures by Country, Latin America, 2020 – 2030 (2 of 2) |
| Figure 6‑23: Crown Procedures by Country, Western Europe, 2020 – 2030 (1 of 2) |
| Figure 6‑24: Crown Procedures by Country, Western Europe, 2020 – 2030 (2 of 2) |
| Figure 6‑25: Crown Procedures by Country, Central & Eastern Europe, 2020 – 2030 (1 of 2) |
| Figure 6‑26: Crown Procedures by Country, Central & Eastern Europe, 2020 – 2030 (2 of 2) |
| Figure 6‑27: Crown Procedures by Country, Middle East, 2020 – 2030 |
| Figure 6‑28: Crown Procedures by Country, Asia-Pacific, 2020 – 2030 (1 of 3) |
| Figure 6‑29: Crown Procedures by Country, Asia-Pacific, 2020 – 2030 (2 of 3) |
| Figure 6‑30: Crown Procedures by Country, Asia-Pacific, 2020 – 2030 (3 of 3) |
| Figure 6‑31: Crown Procedures by Country, Africa, 2020 – 2030 |
| Figure 6‑32: Bridge Procedures by Region, Global, 2020 – 2030 |
| Figure 6‑33: Bridge Procedures by Country, North America, 2020 – 2030 |
| Figure 6‑34: Bridge Procedures by Country, Latin America, 2020 – 2030 (1 of 2) |
| Figure 6‑35: Bridge Procedures by Country, Latin America, 2020 – 2030 (2 of 2) |
| Figure 6‑36: Bridge Procedures by Country, Western Europe, 2020 – 2030 |
| Figure 6‑37: Bridge Procedures by Country, Central & Eastern Europe, 2020 – 2030 (1 of 2) |
| Figure 6‑38: Bridge Procedures by Country, Central & Eastern Europe, 2020 – 2030 (2 of 2) |
| Figure 6‑39: Bridge Procedures by Country, Middle East, 2020 – 2030 |
| Figure 6‑40: Bridge Procedures by Country, Asia-Pacific, 2020 – 2030 (1 of 3) |
| Figure 6‑41: Bridge Procedures by Country, Asia-Pacific, 2020 – 2030 (2 of 3) |
| Figure 6‑42: Bridge Procedures by Country, Asia-Pacific, 2020 – 2030 (3 of 3) |
| Figure 6‑43: Bridge Procedures by Country, Africa, 2020 – 2030 |
| Figure 6‑44: Crown and Bridge Market by Segment, Global, 2020 – 2030 (US$M) |
| Figure 6‑45: Crown and Bridge Market by Region, Global, 2020 – 2030 (US$M) |
| Figure 6‑46: Crown and Bridge Market by Segment, Global, 2020 – 2030 (US$M) |
| Figure 6‑47: Crown and Bridge Market, Global, 2020 – 2030 |
| Figure 6‑48: Units Sold by Region, Crown and Bridge Market, Global, 2020 – 2030 |
| Figure 6‑49: Average Selling Price by Region, Crown and Bridge Market, Global, 2020 – 2030 (US$) |
| Figure 6‑50: Market Value by Region, Crown and Bridge Market, Global, 2020 – 2030 (US$M) |
| Figure 6‑51: Crown Market, Global, 2020 – 2030 |
| Figure 6‑52: Crown Market by Segment, Global, 2020 – 2030 (US$M) |
| Figure 6‑53: Units Sold by Region, Crown Market, Global, 2020 – 2030 |
| Figure 6‑54: Average Selling Price by Region, Crown Market, Global, 2020 – 2030 (US$) |
| Figure 6‑55: Market Value by Region, Crown Market, Global, 2020 – 2030 (US$M) |
| Figure 6‑56: Bridge Market, Global, 2020 – 2030 |
| Figure 6‑57: Crown Market by Segment, Global, 2020 – 2030 (US$M) |
| Figure 6‑58: Units Sold by Region, Bridge Market, Global, 2020 – 2030 |
| Figure 6‑59: Average Selling Price by Region, Bridge Market, Global, 2020 – 2030 (US$) |
| Figure 6‑60: Market Value by Region, Bridge Market, Global, 2020 – 2030 (US$M) |
| Figure 6‑61: Full-Cast Crown and Bridge Market by Segment, Global, 2020 – 2030 (US$M) |
| Figure 6‑62: Full-Cast Crown and Bridge Market, Global, 2020 – 2030 |
| Figure 6‑63: Units Sold by Region, Full-Cast Crown and Bridge Market, Global, 2020 – 2030 |
| Figure 6‑64: Average Selling Price by Region, Full-Cast Crown and Bridge Market, Global, 2020 – 2030 (US$) |
| Figure 6‑65: Market Value by Region, Full-Cast Crown and Bridge Market, Global, 2020 – 2030 (US$M) |
| Figure 6‑66: Full-Cast Crown Market, Global, 2020 – 2030 |
| Figure 6‑67: Units Sold by Region, Full-Cast Crown Market, Global, 2020 – 2030 |
| Figure 6‑68: Average Selling Price by Region, Full-Cast Crown Market, Global, 2020 – 2030 (US$) |
| Figure 6‑69: Market Value by Region, Full-Cast Crown Market, Global, 2020 – 2030 (US$M) |
| Figure 6‑70: Full-Cast Bridge Market, Global, 2020 – 2030 |
| Figure 6‑71: Units Sold by Region, Full-Cast Bridge Market, Global, 2020 – 2030 |
| Figure 6‑72: Average Selling Price by Region, Full-Cast Bridge Market, Global, 2020 – 2030 (US$) |
| Figure 6‑73: Market Value by Region, Full-Cast Bridge Market, Global, 2020 – 2030 (US$M) |
| Figure 6‑74: Total PFM Crown and Bridge Market by Segment, Global, 2018 – 2028 (US$M) |
| Figure 6‑75: Total PFM Crown and Bridge Market, Global, 2020 – 2030 |
| Figure 6‑76: Units Sold by Region, Total PFM Crown and Bridge Market, Global, 2020 – 2030 |
| Figure 6‑77: Average Selling Price by Region, Total PFM Crown and Bridge Market, Global, 2020 – 2030 (US$) |
| Figure 6‑78: Market Value by Region, Total PFM Crown and Bridge Market, Global, 2020 – 2030 (US$M) |
| Figure 6‑79: Total PFM Crown Market by Segment, Global, 2020 – 2030 (US$M) |
| Figure 6‑80: Total PFM Crown Market, Global, 2020 – 2030 |
| Figure 6‑81: Units Sold by Region, Total PFM Crown Market, Global, 2020 – 2030 |
| Figure 6‑82: Average Selling Price by Region, PFM Crown Market, Global, 2020 – 2030 (US$) |
| Figure 6‑83: Market Value by Region, Total PFM Crown Market, Global, 2020 – 2030 (US$M) |
| Figure 6‑84: Total PFM Bridge Market by Segment, Global, 2020 – 2030 (US$M) |
| Figure 6‑85: Total PFM Bridge Market, Global, 2020 – 2030 |
| Figure 6‑86: Units Sold by Region, Total PFM Bridge Market, Global, 2020 – 2030 |
| Figure 6‑87: Average Selling Price by Region, PFM Bridge Market, Global, 2020 – 2030 (US$) |
| Figure 6‑88: Market Value by Region, PFM Bridge Market, Global, 2020 – 2030 (US$M) |
| Figure 6‑89: Non-Precious PFM Crown and Bridge Market by Segment, Global, 2020 – 2030 (US$M) |
| Figure 6‑90: Total Non-Precious PFM Crown and Bridge Market, Global, 2020 – 2030 |
| Figure 6‑91: Units Sold by Region, Total Non-Precious PFM Crown and Bridge Market, Europe, 2020 – 2030 |
| Figure 6‑92: Average Selling Price by Region, Total Non-Precious PFM Crown and Bridge Market, Europe, 2020 – 2030 (US$) |
| Figure 6‑93: Market Value by Country, Total Non-Precious PFM Crown and Bridge Market, Europe, 2020 – 2030 (US$M) |
| Figure 6‑94: Non-Precious PFM Crown Market, Global, 2020 – 2030 |
| Figure 6‑95: Units Sold by Country, Non-Precious PFM Crown Market, Global, 2020 – 2030 |
| Figure 6‑96: Average Selling Price by Country, Non-Precious PFM Crown Market, Europe, 2020 – 2030 (US$M) |
| Figure 6‑97: Market Value by Country, Non-Precious PFM Crown Market, Europe, 2020 – 2030 (US$M) |
| Figure 6‑98: Non-Precious PFM Bridge Market, Global, 2020 – 2030 |
| Figure 6‑99: Units Sold by Region, Non-Precious PFM Bridge Market, Global, 2020 – 2030 |
| Figure 6‑100: Average Selling Price by Region, Non-Precious PFM Bridge Market, Europe, 2020 – 2030 (US$M) |
| Figure 6‑101: Market Value by Region, Non-Precious PFM Bridge Market, Europe, 2020 – 2030 (US$M) |
| Figure 6‑102: Semi-Precious PFM Crown and Bridge Market by Segment, Global, 2020 – 2030 (US$M) |
| Figure 6‑103: Total Semi-Precious PFM Crown and Bridge Market, Global, 2020 – 2030 |
| Figure 6‑104: Units Sold by Region, Total Semi-Precious PFM Crown and Bridge Market, Europe, 2020 – 2030 |
| Figure 6‑105: Average Selling Price by Region, Total Semi-Precious PFM Crown and Bridge Market, Europe, 2020 – 2030 (US$) |
| Figure 6‑106: Market Value by Country, Total Semi-Precious PFM Crown and Bridge Market, Europe, 2020 – 2030 (US$M) |
| Figure 6‑107: Semi-Precious PFM Crown Market, Global, 2020 – 2030 |
| Figure 6‑108: Units Sold by Country, Semi-Precious PFM Crown Market, Global, 2020 – 2030 |
| Figure 6‑109: Average Selling Price by Country, Semi-Precious PFM Crown Market, Europe, 2020 – 2030 (US$M) |
| Figure 6‑110: Market Value by Country, Semi-Precious PFM Crown Market, Europe, 2020 – 2030 (US$M) |
| Figure 6‑111: Semi-Precious PFM Bridge Market, Global, 2020 – 2030 |
| Figure 6‑112: Units Sold by Region, Semi-Precious PFM Bridge Market, Global, 2020 – 2030 |
| Figure 6‑113: Average Selling Price by Region, Semi-Precious PFM Bridge Market, Europe, 2020 – 2030 (US$M) |
| Figure 6‑114: Market Value by Region, Semi-Precious PFM Bridge Market, Europe, 2020 – 2030 (US$M) |
| Figure 6‑115: Precious PFM Crown and Bridge Market by Segment, Global, 2020 – 2030 (US$M) |
| Figure 6‑116: Total Precious PFM Crown and Bridge Market, Global, 2020 – 2030 |
| Figure 6‑117: Units Sold by Region, Total Precious PFM Crown and Bridge Market, Europe, 2020 – 2030 |
| Figure 6‑118: Average Selling Price by Region, Total Precious PFM Crown and Bridge Market, Europe, 2020 – 2030 (US$) |
| Figure 6‑119: Market Value by Country, Total Precious PFM Crown and Bridge Market, Europe, 2020 – 2030 (US$M) |
| Figure 6‑120: Precious PFM Crown Market, Global, 2020 – 2030 |
| Figure 6‑121: Units Sold by Country, Precious PFM Crown Market, Global, 2020 – 2030 |
| Figure 6‑122: Average Selling Price by Country, Precious PFM Crown Market, Europe, 2020 – 2030 (US$M) |
| Figure 6‑123: Market Value by Country, Precious PFM Crown Market, Europe, 2020 – 2030 (US$M) |
| Figure 6‑124: Precious PFM Bridge Market, Global, 2020 – 2030 |
| Figure 6‑125: Units Sold by Region, Precious PFM Bridge Market, Global, 2020 – 2030 |
| Figure 6‑126: Average Selling Price by Region, Precious PFM Bridge Market, Europe, 2020 – 2030 (US$M) |
| Figure 6‑127: Market Value by Region, Precious PFM Bridge Market, Europe, 2020 – 2030 (US$M) |
| Figure 6‑128: All-Ceramic Crown and Bridge Market by Segment, Global, 2018 – 2028 (US$M) |
| Figure 6‑129: All-Ceramic Crown and Bridge Market, Global, 2020 – 2030 |
| Figure 6‑130: Units Sold by Region, All-Ceramic Crown and Bridge Market, Global, 2020 – 2030 |
| Figure 6‑131: Average Selling Price by Region, All-Ceramic Crown and Bridge Market, Global, 2020 – 2030 (US$) |
| Figure 6‑132: Market Value by Region, All-Ceramic Crown and Bridge Market, Global, 2020 – 2030 (US$M) |
| Figure 6‑133: All-Ceramic Crown Market, Global, 2020 – 2030 |
| Figure 6‑134: Units Sold by Region, All-Ceramic Crown Market, Global, 2020 – 2030 |
| Figure 6‑135: Average Selling Price by Region, All-Ceramic Crown Market, Global, 2020 – 2030 (US$) |
| Figure 6‑136: Market Value by Region, All-Ceramic Crown Market, Global, 2020 – 2030 (US$M) |
| Figure 6‑137: All-Ceramic Bridge Market, Global, 2020 – 2030 |
| Figure 6‑138: Units Sold by Region, All-Ceramic Bridge Market, Global, 2020 – 2030 |
| Figure 6‑139: Average Selling Price by Region, All-Ceramic Bridge Market, Global, 2020 – 2030 (US$) |
| Figure 6‑140: Market Value by Region, All-Ceramic Bridge Market, Global, 2020 – 2030 (US$M) |
| Figure 6‑141: Leading Competitors, Crown and Bridge Market, Global, 2023 |
| Figure 7‑1: Inlay and Onlay Regions Covered, Global (1 of 2) |
| Figure 7‑2: Inlay and Onlay Regions Covered, Global (2 of 2) |
| Figure 7‑3: Inlay and Onlay Procedures by Region, Global, 2020 – 2030 |
| Figure 7‑4: Inlay and Onlay Procedures by Country, North America, 2020 – 2030 |
| Figure 7‑5: Inlay and Onlay Procedures by Country, Latin America, 2020 – 2030 (1 of 2) |
| Figure 7‑6: Inlay and Onlay Procedures by Country, Latin America, 2020 – 2030 (2 of 2) |
| Figure 7‑7: Inlay and Onlay Procedures by Country, Western Europe, 2020 – 2030 |
| Figure 7‑8: Inlay and Onlay Procedures by Country, Central & Eastern Europe, 2020 – 2030 (1 of 2) |
| Figure 7‑9: Inlay and Onlay Procedures by Country, Central & Eastern Europe, 2020 – 2030 (2 of 2) |
| Figure 7‑10: Inlay and Onlay Procedures by Country, Middle East, 2020 – 2030 |
| Figure 7‑11: Inlay and Onlay Procedures by Country, Asia-Pacific, 2020 – 2030 (1 of 3) |
| Figure 7‑12: Inlay and Onlay Procedures by Country, Asia-Pacific, 2020 – 2030 (2 of 3) |
| Figure 7‑13: Inlay and Onlay Procedures by Country, Asia-Pacific, 2020 – 2030 (3 of 3) |
| Figure 7‑14: Inlay and Onlay Procedures by Country, Africa, 2020 – 2030 |
| Figure 7‑15: Inlay and Onlay Market, Global, 2020 – 2030 |
| Figure 7‑16: Units Sold by Region, Inlay and Onlay Market, Global, 2020 – 2030 |
| Figure 7‑17: Average Selling Price by Region, Inlay and Onlay Market, Global, 2020 – 2030 (US$) |
| Figure 7‑18: Market Value by Region, Inlay and Onlay Market, Global, 2020 – 2030 (US$M) |
| Figure 7‑19: Leading Competitors, Inlay and Onlay Market, Global, 2023 |
| Figure 8‑1: Denture Regions Covered, Global (1 of 2) |
| Figure 8‑2: Denture Regions Covered, Global (2 of 2) |
| Figure 8‑3: Denture Market by Segment, Global, 2020 – 2030 (US$M) |
| Figure 8‑4: Denture Market by Region, Global, 2020 – 2030 (US$M) |
| Figure 8‑5: Denture Market, Global, 2020 – 2030 |
| Figure 8‑6: Units Sold by Region, Denture Market, Global, 2020 – 2030 |
| Figure 8‑7: Average Selling Price by Region, Denture Market, Global, 2020 – 2030 (US$) |
| Figure 8‑8: Market Value by Region, Denture Market, Global, 2020 – 2030 (US$M) |
| Figure 8‑9: Leading Competitors, Denture Market, Global, 2023 |
| Figure 9‑1: Denture Teeth Regions Covered, Global (1 of 2) |
| Figure 9‑2: Denture Teeth Regions Covered, Global (2 of 2) |
| Figure 9‑3: Denture Teeth Market, Global, 2020 – 2030 |
| Figure 9‑4: Units Sold by Region, Denture Teeth Market, Global, 2020 – 2030 |
| Figure 9‑5: Average Selling Price by Region, Denture Teeth Market, Global, 2020 – 2030 (US$) |
| Figure 9‑6: Market Value by Region, Denture Teeth Market, Global, 2020 – 2030 (US$M) |
| Figure 9‑7: Leading Competitors, Denture Teeth Market, Global, 2023 |
| Figure 10‑1: CAD/CAM Milled Dental Prosthetic Regions Covered, Global (1 of 2) |
| Figure 10‑2: CAD/CAM Milled Dental Prosthetic Regions Covered, Global (2 of 2) |
| Figure 10‑3: CAD/CAM Milled Crown and Bridge Procedures by Region, Global, 2020 – 2030 |
| Figure 10‑4: CAD/CAM Milled Crown and Bridge Procedures by Country, North America, 2020 – 2030 |
| Figure 10‑5: CAD/CAM Milled Crown and Bridge Procedures by Country, Latin America, 2020 – 2030 (1 of 2) |
| Figure 10‑6: CAD/CAM Milled Crown and Bridge Procedures by Country, Latin America, 2020 – 2030 (2 of 2) |
| Figure 10‑7: CAD/CAM Milled Crown and Bridge Procedures by Country, Western Europe, 2020 – 2030 |
| Figure 10‑8: CAD/CAM Milled Crown and Bridge by Country, Central & Eastern Europe, 2020 – 2030 (1 of 2) |
| Figure 10‑9: CAD/CAM Milled Crown and Bridge Procedures by Country, Central & Eastern Europe, 2020 – 2030 (2 of 2) |
| Figure 10‑10: CAD/CAM Milled Crown and Bridge Procedures by Country, Middle East, 2020 – 2030 |
| Figure 10‑11: CAD/CAM Milled Crown and Bridge Procedures by Country, Asia-Pacific, 2020 – 2030 (1 of 3) |
| Figure 10‑12: CAD/CAM Milled Crown and Bridge Procedures by Country, Asia-Pacific, 2020 – 2030 (2 of 3) |
| Figure 10‑13: CAD/CAM Milled Crown and Bridge Procedures by Country, Asia-Pacific, 2020 – 2030 (3 of 3) |
| Figure 10‑14: CAD/CAM Milled Crown and Bridge Procedures by Country, Africa, 2020 – 2030 |
| Figure 10‑15: CAD/CAM Milled Inlay and Onlay Procedures by Region, Global, 2020 – 2030 |
| Figure 10‑16: CAD/CAM Milled Inlay and Onlay Procedures by Country, North America, 2020 – 2030 |
| Figure 10‑17: CAD/CAM Milled Inlay and Onlay Procedures by Country, Latin America, 2020 – 2030 (1 of 2) |
| Figure 10‑18: CAD/CAM Milled Inlay and Onlay Procedures by Country, Latin America, 2020 – 2030 (2 of 2) |
| Figure 10‑19: CAD/CAM Milled Inlay and Onlay Procedures by Country, Western Europe, 2020 – 2030 |
| Figure 10‑20: CAD/CAM Milled Inlay and Onlay Procedures by Country, Central & Eastern Europe, 2020 – 2030 (1 of 2) |
| Figure 10‑21: CAD/CAM Milled Inlay and Onlay Procedures by Country, Central & Eastern Europe, 2020 – 2030 (2 of 2) |
| Figure 10‑22: CAD/CAM Milled Inlay and Onlay Procedures by Country, Middle East, 2020 – 2030 |
| Figure 10‑23: CAD/CAM Milled Inlay and Onlay Procedures by Country, Asia-Pacific, 2020 – 2030 (1 of 3) |
| Figure 10‑24: CAD/CAM Milled Inlay and Onlay Procedures by Country, Asia-Pacific, 2020 – 2030 (2 of 3) |
| Figure 10‑25: CAD/CAM Milled Inlay and Onlay Procedures by Country, Asia-Pacific, 2020 – 2030 (3 of 3) |
| Figure 10‑26: CAD/CAM Milled Inlay and Onlay Procedures by Country, Africa, 2020 – 2030 |
| Figure 10‑27: CAD/CAM Milled Dental Prosthetic Market, Global, 2020 – 2030 |
| Figure 10‑28: CAD/CAM Milled Dental Prosthetic Market by Setting, Global, 2020 – 2030 |
| Figure 10‑29: CAD/CAM Milled Dental Prosthetic Market by Prosthetic Type, Global, 2020 – 2030 |
| Figure 10‑30: CAD/CAM Milled Dental Prosthetic Market by Region, Global, 2020 – 2030 (US$M) |
| Figure 10‑31: Units Sold by Region, CAD/CAM Milled Dental Prosthetic Market, Global, 2020 – 2030 |
| Figure 10‑32: Average Selling Price by Region, CAD/CAM Milled Dental Prosthetic Market, Global, 2020 – 2030 (US$) |
| Figure 10‑33: CAD/CAM Milled Crown and Bridge Market, Global, 2020 – 2030 |
| Figure 10‑34: Units Sold by Region, CAD/CAM Milled Crown and Bridge Market, Global, 2020 – 2030 |
| Figure 10‑35: Average Selling Price by Region, CAD/CAM Milled Crown and Bridge Market, Global, 2020 – 2030 (US$) |
| Figure 10‑36: Market Value by Region, CAD/CAM Milled Crown and Bridge Market, Global, 2020 – 2030 (US$M) |
| Figure 10‑37: CAD/CAM Milled Crown and Bridge Market by Setting, Global, 2020 – 2030 (US$M) |
| Figure 10‑38: Chairside CAD/CAM Milled Crown and Bridge Market, Global, 2020 – 2030 |
| Figure 10‑39: Units Sold by Region, Chairside CAD/CAM Milled Crown and Bridge Market, Global, 2020 – 2030 |
| Figure 10‑40: Average Selling Price by Region, Chairside CAD/CAM Milled Crown and Bridge Market, Global, 2020 – 2030 (US$) |
| Figure 10‑41: Market Value by Region, Chairside CAD/CAM Milled Crown and Bridge Market, Global, 2020 – 2030 (US$M) |
| Figure 10‑42: In-Lab CAD/CAM Milled Crown and Bridge Market, Europe, 2020 – 2030 |
| Figure 10‑43: Units Sold by Country, In-Lab CAD/CAM Milled Crown and Bridge Market, Europe, 2020 – 2030 |
| Figure 10‑44: Average Selling Price by Country, In-Lab CAD/CAM Milled Crown and Bridge Market, Global, 2020 – 2030 (US$) |
| Figure 10‑45: Market Value by Region, In-Lab CAD/CAM Milled Crown and Bridge Market, Global, 2020 – 2030 (US$M) |
| Figure 10‑46: CAD/CAM Milled Inlay and Onlay Market, Global, 2020 – 2030 |
| Figure 10‑47: Units Sold by Region, CAD/CAM Milled Inlay and Onlay Market, Global, 2020 – 2030 |
| Figure 10‑48: Average Selling Price by Region, CAD/CAM Milled Inlay and Onlay Market, Global, 2020 – 2030 (US$) |
| Figure 10‑49: Market Value by Region, CAD/CAM Milled Inlay and Onlay Market, Global, 2020 – 2030 (US$M) |
| Figure 10‑50: CAD/CAM Milled Inlay and Onlay Market by Setting, Global, 2020 – 2030 (US$M) |
| Figure 10‑51: Chairside CAD/CAM Milled Inlay and Onlay Market, Global, 2020 – 2030 |
| Figure 10‑52: Units Sold by Region, Chairside CAD/CAM Milled Inlay and Onlay Market, Global, 2020 – 2030 |
| Figure 10‑53: Average Selling Price by Region, Chairside CAD/CAM Milled Inlay and Onlay Market, Global, 2020 – 2030 (US$) |
| Figure 10‑54: Market Value by Region, Chairside CAD/CAM Milled Inlay and Onlay Market, Global, 2020 – 2030 (US$M) |
| Figure 10‑55: In-Lab CAD/CAM Milled Inlay and Onlay Market, Europe, 2020 – 2030 |
| Figure 10‑56: Units Sold by Country, In-Lab CAD/CAM Milled Inlay and Onlay Market, Europe, 2020 – 2030 |
| Figure 10‑57: Average Selling Price by Country, In-Lab CAD/CAM Milled Inlay and Onlay Market, Global, 2020 – 2030 (US$) |
| Figure 10‑58: Market Value by Region, In-Lab CAD/CAM Milled Inlay and Onlay Market, Global, 2020 – 2030 (US$M) |
| Figure 10‑59: CAD/CAM Milled Denture Market, Global, 2020 – 2030 |
| Figure 10‑60: Units Sold by Region, CAD/CAM Milled Denture Market, Global, 2020 – 2030 |
| Figure 10‑61: Average Selling Price by Region, CAD/CAM Milled Denture Market, Global, 2020 – 2030 (US$) |
| Figure 10‑62: Market Value by Region, CAD/CAM Milled Denture Market, Global, 2020 – 2030 (US$M) |
| Figure 10‑63: CAD/CAM Milled Denture Market by Setting, Global, 2020 – 2030 (US$M) |
| Figure 10‑64: Chairside CAD/CAM Milled Denture Market, Global, 2020 – 2030 |
| Figure 10‑65: Units Sold by Region, Chairside CAD/CAM Milled Denture Market, Global, 2020 – 2030 |
| Figure 10‑66: Average Selling Price by Region, Chairside CAD/CAM Milled Denture Market, Global, 2020 – 2030 (US$) |
| Figure 10‑67: Market Value by Region, Chairside CAD/CAM Milled Denture Market, Global, 2020 – 2030 (US$M) |
| Figure 10‑68: In-Lab CAD/CAM Milled Denture Market, Europe, 2020 – 2030 |
| Figure 10‑69: Units Sold by Country, In-Lab CAD/CAM Milled Denture Market, Europe, 2020 – 2030 |
| Figure 10‑70: Average Selling Price by Country, In-Lab CAD/CAM Milled Denture Market, Global, 2020 – 2030 (US$) |
| Figure 10‑71: Market Value by Region, In-Lab CAD/CAM Milled Denture Market, Global, 2020 – 2030 (US$M) |