| Figure 1‑1: Complex Peripheral Vascular Device Market Share Ranking by Segment, Global, 2025 (1 of 2) |
| Figure 1‑2: Complex Peripheral Vascular Device Market Share Ranking by Segment, Global, 2025 (2 of 2) |
| Figure 1‑3: Companies Researched in This Report |
| Figure 1‑4: Factors Impacting the Complex Peripheral Vascular Device Market by Segment, Global (1 of 2) |
| Figure 1‑5: Factors Impacting the Complex Peripheral Vascular Device Market by Segment, Global (2 of 2) |
| Figure 1‑6: Recent Events in the Peripheral Vascular Device Market, Global, 2021 – 2025 |
| Figure 1‑7: Complex Peripheral Vascular Procedures Covered |
| Figure 1‑8: Standard Peripheral Vascular Procedures Covered |
| Figure 1‑9: Complex Peripheral Vascular Device Markets Covered (1 of 2) |
| Figure 1‑10: Complex Peripheral Vascular Device Markets Covered (2 of 2) |
| Figure 1‑11: Standard Peripheral Vascular Device Markets Covered |
| Figure 1‑12: Peripheral Vascular Regions Covered, Global (1 of 2) |
| Figure 1‑13: Peripheral Vascular Regions Covered, Global (2 of 2) |
| Figure 1‑14: Key Analysis Updates |
| Figure 1‑15: Version History |
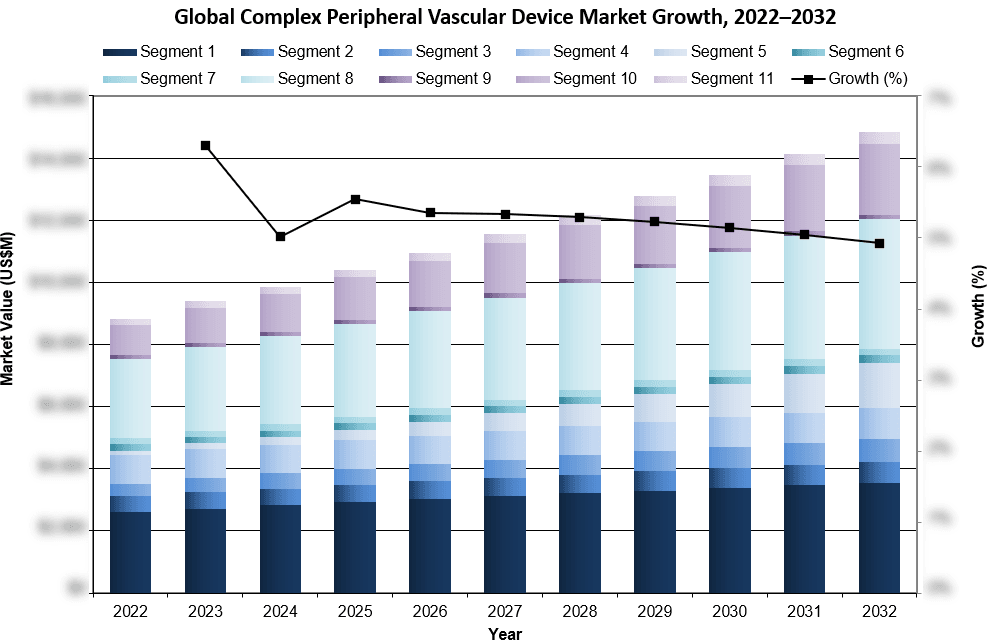
| Figure 3‑1: Complex Peripheral Vascular Device Market by Segment, Global, 2022 – 2032 (US$M) (1 of 2) |
| Figure 3‑2: Complex Peripheral Vascular Device Market by Segment, Global, 2022 – 2032 (US$M) (2 of 2) |
| Figure 3‑3: Complex Peripheral Vascular Device Market by Region, Global, 2022 – 2032 (US$M) |
| Figure 3‑4: Leading Competitors, Complex Peripheral Vascular Device Market, Global, 2025 (1 of 2) |
| Figure 3‑5: Leading Competitors, Complex Peripheral Vascular Device Market, Global, 2025 (2 of 2) |
| Figure 4‑1: Peripheral Vascular Stent Procedures Covered |
| Figure 4‑2: Peripheral Vascular Stent Markets Covered |
| Figure 4‑3: Peripheral Vascular Stent Regions Covered, Global (1 of 2) |
| Figure 4‑4: Peripheral Vascular Stent Regions Covered, Global (2 of 2) |
| Figure 4‑5: Peripheral Vascular Stenting Procedures by Segment, Global, 2022 – 2032 |
| Figure 4‑6: Peripheral Vascular Stenting Procedures by Region, Global, 2022 – 2032 |
| Figure 4‑7: Peripheral Vascular Stenting Procedures by Country, North America, 2022 – 2032 |
| Figure 4‑8: Peripheral Vascular Stenting Procedures by Country, Latin America, 2022 – 2032 (1 of 2) |
| Figure 4‑9: Peripheral Vascular Stenting Procedures by Country, Latin America, 2022 – 2032 (2 of 2) |
| Figure 4‑10: Peripheral Vascular Stenting Procedures by Country, Western Europe, 2022 – 2032 |
| Figure 4‑11: Peripheral Vascular Stenting Procedures by Country, Central & Eastern Europe, 2022 – 2032 (1 of 2) |
| Figure 4‑12: Peripheral Vascular Stenting Procedures by Country, Central & Eastern Europe, 2022 – 2032 (2 of 2) |
| Figure 4‑13: Peripheral Vascular Stenting Procedures by Country, Middle East, 2022 – 2032 |
| Figure 4‑14: Peripheral Vascular Stenting Procedures by Country, Asia-Pacific, 2022 – 2032 (1 of 3) |
| Figure 4‑15: Peripheral Vascular Stenting Procedures by Country, Asia-Pacific, 2022 – 2032 (2 of 3) |
| Figure 4‑16: Peripheral Vascular Stenting Procedures by Country, Asia-Pacific, 2022 – 2032 (3 of 3) |
| Figure 4‑17: Peripheral Vascular Stenting Procedures by Country, Africa, 2022 – 2032 |
| Figure 4‑18: Arterial Stent Procedures by Segment, Global, 2022 – 2032 |
| Figure 4‑19: Arterial Stent Procedures by Region, Global, 2022 – 2032 |
| Figure 4‑20: Arterial Stent Procedures by Country, North America, 2022 – 2032 |
| Figure 4‑21: Arterial Stent Procedures by Country, Latin America, 2022 – 2032 (1 of 2) |
| Figure 4‑22: Arterial Stent Procedures by Country, Latin America, 2022 – 2032 (2 of 2) |
| Figure 4‑23: Arterial Stent Procedures by Country, Western Europe, 2022 – 2032 |
| Figure 4‑24: Arterial Stent Procedures by Country, Central & Eastern Europe, 2022 – 2032 (1 of 2) |
| Figure 4‑25: Arterial Stent Procedures by Country, Central & Eastern Europe, 2022 – 2032 (2 of 2) |
| Figure 4‑26: Arterial Stent Procedures by Country, Middle East, 2022 – 2032 |
| Figure 4‑27: Arterial Stent Procedures by Country, Asia-Pacific, 2022 – 2032 (1 of 3) |
| Figure 4‑28: Arterial Stent Procedures by Country, Asia-Pacific, 2022 – 2032 (2 of 3) |
| Figure 4‑29: Arterial Stent Procedures by Country, Asia-Pacific, 2022 – 2032 (3 of 3) |
| Figure 4‑30: Arterial Stent Procedures by Country, Africa, 2022 – 2032 |
| Figure 4‑31: Bare-Metal Stent Procedures by Region, Global, 2022 – 2032 |
| Figure 4‑32: Bare-Metal Stent Procedures by Country, North America, 2022 – 2032 |
| Figure 4‑33: Bare-Metal Stent Procedures by Country, Latin America, 2022 – 2032 (1 of 2) |
| Figure 4‑34: Bare-Metal Stent Procedures by Country, Latin America, 2022 – 2032 (2 of 2) |
| Figure 4‑35: Bare-Metal Stent Procedures by Country, Western Europe, 2022 – 2032 |
| Figure 4‑36: Bare-Metal Stent Procedures by Country, Central & Eastern Europe, 2022 – 2032 (1 of 2) |
| Figure 4‑37: Bare-Metal Stent Procedures by Country, Central & Eastern Europe, 2022 – 2032 (2 of 2) |
| Figure 4‑38: Bare-Metal Stent Procedures by Country, Middle East, 2022 – 2032 |
| Figure 4‑39: Bare-Metal Stent Procedures by Country, Asia-Pacific, 2022 – 2032 (1 of 3) |
| Figure 4‑40: Bare-Metal Stent Procedures by Country, Asia-Pacific, 2022 – 2032 (2 of 3) |
| Figure 4‑41: Bare-Metal Stent Procedures by Country, Asia-Pacific, 2022 – 2032 (3 of 3) |
| Figure 4‑42: Bare-Metal Stent Procedures by Country, Africa, 2022 – 2032 |
| Figure 4‑43: Covered Stent Procedures by Region, Global, 2022 – 2032 |
| Figure 4‑44: Covered Stent Procedures by Country, North America, 2022 – 2032 |
| Figure 4‑45: Covered Stent Procedures by Country, Latin America, 2022 – 2032 (1 of 2) |
| Figure 4‑46: Covered Stent Procedures by Country, Latin America, 2022 – 2032 (2 of 2) |
| Figure 4‑47: Covered Stent Procedures by Country, Western Europe, 2022 – 2032 |
| Figure 4‑48: Covered Stent Procedures by Country, Central & Eastern Europe, 2022 – 2032 (1 of 2) |
| Figure 4‑49: Covered Stent Procedures by Country, Central & Eastern Europe, 2022 – 2032 (2 of 2) |
| Figure 4‑50: Covered Stent Procedures by Country, Middle East, 2022 – 2032 |
| Figure 4‑51: Covered Stent Procedures by Country, Asia-Pacific, 2022 – 2032 (1 of 3) |
| Figure 4‑52: Covered Stent Procedures by Country, Asia-Pacific, 2022 – 2032 (2 of 3) |
| Figure 4‑53: Covered Stent Procedures by Country, Asia-Pacific, 2022 – 2032 (3 of 3) |
| Figure 4‑54: Covered Stent Procedures by Country, Africa, 2022 – 2032 |
| Figure 4‑55: Drug-Eluting Stent Procedures by Region, Global, 2022 – 2032 |
| Figure 4‑56: Drug-Eluting Stent Procedures by Country, North America, 2022 – 2032 |
| Figure 4‑57: Drug-Eluting Stent Procedures by Country, Latin America, 2022 – 2032 (1 of 2) |
| Figure 4‑58: Drug-Eluting Stent Procedures by Country, Latin America, 2022 – 2032 (2 of 2) |
| Figure 4‑59: Drug-Eluting Stent Procedures by Country, Western Europe, 2022 – 2032 |
| Figure 4‑60: Drug-Eluting Stent Procedures by Country, Central & Eastern Europe, 2022 – 2032 (1 of 2) |
| Figure 4‑61: Drug-Eluting Stent Procedures by Country, Central & Eastern Europe, 2022 – 2032 (2 of 2) |
| Figure 4‑62: Drug-Eluting Stent Procedures by Country, Middle East, 2022 – 2032 |
| Figure 4‑63: Drug-Eluting Stent Procedures by Country, Asia-Pacific, 2022 – 2032 (1 of 3) |
| Figure 4‑64: Drug-Eluting Stent Procedures by Country, Asia-Pacific, 2022 – 2032 (2 of 3) |
| Figure 4‑65: Drug-Eluting Stent Procedures by Country, Asia-Pacific, 2022 – 2032 (3 of 3) |
| Figure 4‑66: Drug-Eluting Stent Procedures by Country, Africa, 2022 – 2032 |
| Figure 4‑67: Venous Stent Procedures by Region, Global, 2022 – 2032 |
| Figure 4‑68: Venous Stent Procedures by Country, North America, 2022 – 2032 |
| Figure 4‑69: Venous Stent Procedures by Country, Latin America, 2022 – 2032 (1 of 2) |
| Figure 4‑70: Venous Stent Procedures by Country, Latin America, 2022 – 2032 (2 of 2) |
| Figure 4‑71: Venous Stent Procedures by Country, Western Europe, 2022 – 2032 |
| Figure 4‑72: Venous Stent Procedures by Country, Central & Eastern Europe, 2022 – 2032 (1 of 2) |
| Figure 4‑73: Venous Stent Procedures by Country, Central & Eastern Europe, 2022 – 2032 (2 of 2) |
| Figure 4‑74: Venous Stent Procedures by Country, Middle East, 2022 – 2032 |
| Figure 4‑75: Venous Stent Procedures by Country, Asia-Pacific, 2022 – 2032 (1 of 3) |
| Figure 4‑76: Venous Stent Procedures by Country, Asia-Pacific, 2022 – 2032 (2 of 3) |
| Figure 4‑77: Venous Stent Procedures by Country, Asia-Pacific, 2022 – 2032 (3 of 3) |
| Figure 4‑78: Venous Stent Procedures by Country, Africa, 2022 – 2032 |
| Figure 4‑79: Peripheral Vascular Stent Market by Segment, Global, 2022 – 2032 (US$M) |
| Figure 4‑80: Peripheral Vascular Stent Market by Region, Global, 2022 – 2032 (US$M) |
| Figure 4‑81: Arterial Stent Market by Segment, Global, 2022 – 2032 (US$M) |
| Figure 4‑82: Total Arterial Stent Market, Global, 2022 – 2032 |
| Figure 4‑83: Units Sold by Region, Arterial Stent Market, Global, 2022 – 2032 |
| Figure 4‑84: Average Selling Price by Region, Arterial Stent Market, Global, 2022 – 2032 (US$) |
| Figure 4‑85: Market Value by Region, Arterial Stent Market, Global, 2022 – 2032 (US$M) |
| Figure 4‑86: Bare-Metal Stent Market by Segment, Global, 2022 – 2032 (US$M) |
| Figure 4‑87: Total Bare-Metal Stent Market, Global, 2022 – 2032 |
| Figure 4‑88: Units Sold by Region, Bare-Metal Stent Market, Global, 2022 – 2032 |
| Figure 4‑89: Average Selling Price by Region, Bare-Metal Stent Market, Global, 2022 – 2032 (US$) |
| Figure 4‑90: Market Value by Region, Bare-Metal Stent Market, Global, 2022 – 2032 (US$M) |
| Figure 4‑91: Bare-Metal Carotid Stent Market, Global, 2022 – 2032 |
| Figure 4‑92: Units Sold by Region, Bare-Metal Carotid Stent Market, Global, 2022 – 2032 |
| Figure 4‑93: Average Selling Price by Region, Bare-Metal Carotid Stent Market, Global, 2022 – 2032 (US$) |
| Figure 4‑94: Market Value by Region, Bare-Metal Carotid Stent Market, Global, 2022 – 2032 (US$M) |
| Figure 4‑95: Bare-Metal Iliac Stent Market, Global, 2022 – 2032 |
| Figure 4‑96: Units Sold by Region, Bare-Metal Iliac Stent Market, Global, 2022 – 2032 |
| Figure 4‑97: Average Selling Price by Region, Bare-Metal Iliac Stent Market, Global, 2022 – 2032 (US$) |
| Figure 4‑98: Market Value by Region, Bare-Metal Iliac Stent Market, Global, 2022 – 2032 (US$M) |
| Figure 4‑99: Bare-Metal Renal Stent Market, Global, 2022 – 2032 |
| Figure 4‑100: Units Sold by Region, Bare-Metal Renal Stent Market, Global, 2022 – 2032 |
| Figure 4‑101: Average Selling Price by Region, Bare-Metal Renal Stent Market, Global, 2022 – 2032 (US$) |
| Figure 4‑102: Market Value by Region, Bare-Metal Renal Stent Market, Global, 2022 – 2032 (US$M) |
| Figure 4‑103: Bare-Metal Fem-Pop Stent Market, Global, 2022 – 2032 |
| Figure 4‑104: Units Sold by Region, Bare-Metal Fem-Pop Stent Market, Global, 2022 – 2032 |
| Figure 4‑105: Average Selling Price by Region, Bare-Metal Fem-Pop Stent Market, Global, 2022 – 2032 (US$) |
| Figure 4‑106: Market Value by Region, Bare-Metal Fem-Pop Stent Market, Global, 2022 – 2032 (US$M) |
| Figure 4‑107: Bare-Metal Infra-Pop Stent Market, Global, 2022 – 2032 |
| Figure 4‑108: Units Sold by Region, Bare-Metal Infra-Pop Stent Market, Global, 2022 – 2032 |
| Figure 4‑109: Average Selling Price by Region, Bare-Metal Infra-Pop Stent Market, Global, 2022 – 2032 (US$) |
| Figure 4‑110: Market Value by Region, Bare-Metal Infra-Pop Stent Market, Global, 2022 – 2032 (US$M) |
| Figure 4‑111: Bare-Metal Sten Unit Analysis by Delivery Platform, Global, 2022 – 2032 |
| Figure 4‑112: Units Sold by Region, Self-Expanding Bare-Metal Stent Units, Global, 2022 – 2032 |
| Figure 4‑113: Units Sold by Region, Balloon-Expanding Bare-Metal Stent Market, Global, 2022 – 2032 |
| Figure 4‑114: Covered Stent Market, Global, 2022 – 2032 |
| Figure 4‑115: Units Sold by Region, Covered Stent Market, Global, 2022 – 2032 |
| Figure 4‑116: Average Selling Price by Region, Covered Stent Market, Global, 2022 – 2032 (US$) |
| Figure 4‑117: Market Value by Region, Covered Stent Market, Global, 2022 – 2032 (US$M) |
| Figure 4‑118: Covered Stent Unis Analysis by Indication, Global, 2022 – 2032 |
| Figure 4‑119: Units Sold by Region, Iliac Covered Stent Market, Global, 2022 – 2032 |
| Figure 4‑120: Units Sold by Region, Fem-Popliteal Covered Stent Market, Global, 2022 – 2032 |
| Figure 4‑121: Units Sold by Region, AV-Access Covered Stent Market, Global, 2022 – 2032 |
| Figure 4‑122: Drug-Eluting Stent Market, Global, 2022 – 2032 |
| Figure 4‑123: Units Sold by Region, Drug-Eluting Stent Market, Global, 2022 – 2032 |
| Figure 4‑124: Average Selling Price by Region, Drug-Eluting Stent Market, Global, 2022 – 2032 (US$) |
| Figure 4‑125: Market Value by Region, Drug-Eluting Stent Market, Global, 2022 – 2032 (US$M) |
| Figure 4‑126: Drug-Eluting Stent Unit analysis by Indication, U.S., 2022 – 2032 |
| Figure 4‑127: Units Sold by Region, SFA Drug-Eluting Stent Market, Global, 2022 – 2032 |
| Figure 4‑128: Units Sold by Region, Infra-Popliteal Drug-Eluting Stent Market, Global, 2022 – 2032 |
| Figure 4‑129: Venous Stent Market, Global, 2022 – 2032 |
| Figure 4‑130: Units Sold by Region, Venous Stent Market, Global, 2022 – 2032 |
| Figure 4‑131: Average Selling Price by Region, Venous Stent Market, Global, 2022 – 2032 (US$) |
| Figure 4‑132: Market Value by Region, Venous Stent Market, Global, 2022 – 2032 (US$M) |
| Figure 4‑133: Leading Competitors, Peripheral Vascular Stent Market, Global, 2025 |
| Figure 5‑1: PTA Balloon Procedures Covered |
| Figure 5‑2: PTA Balloon Markets Covered |
| Figure 5‑3: PTA Balloon Regions Covered, Global (1 of 2) |
| Figure 5‑4: PTA Balloon Regions Covered, Global (2 of 2) |
| Figure 5‑5: PTA Balloon Procedures by Region, Global, 2022 – 2032 |
| Figure 5‑6: PTA Balloon Procedures by Country, North America, 2022 – 2032 |
| Figure 5‑7: PTA Balloon Procedures by Country, Latin America, 2022 – 2032 (1 of 2) |
| Figure 5‑8: PTA Balloon Procedures by Country, Latin America, 2022 – 2032 (2 of 2) |
| Figure 5‑9: PTA Balloon Procedures by Country, Western Europe, 2022 – 2032 |
| Figure 5‑10: PTA Balloon Procedures by Country, Central & Eastern Europe, 2022 – 2032 (1 of 2) |
| Figure 5‑11: PTA Balloon Procedures by Country, Central & Eastern Europe, 2022 – 2032 (2 of 2) |
| Figure 5‑12: PTA Balloon Procedures by Country, Middle East, 2022 – 2032 |
| Figure 5‑13: PTA Balloon Procedures by Country, Asia-Pacific, 2022 – 2032 (1 of 3) |
| Figure 5‑14: PTA Balloon Procedures by Country, Asia-Pacific, 2022 – 2032 (2 of 3) |
| Figure 5‑15: PTA Balloon Procedures by Country, Asia-Pacific, 2022 – 2032 (3 of 3) |
| Figure 5‑16: PTA Balloon Procedures by Country, Africa, 2022 – 2032 |
| Figure 5‑17: PTA Balloon Market by Segment, Global, 2022 – 2032 (US$M) |
| Figure 5‑18: PTA Balloon Market by Region, Global, 2022 – 2032 (US$M) |
| Figure 5‑19: PTA Balloon Market, Global, 2022 – 2032 |
| Figure 5‑20: Units Sold by Region, PTA Balloon Market, Global, 2022 – 2032 |
| Figure 5‑21: Average Selling Price by Region, PTA Balloon Market, Global, 2022 – 2032 (US$) |
| Figure 5‑22: Market Value by Region, PTA Balloon Market, Global, 2022 – 2032 (US$M) |
| Figure 5‑23: Standard PTA Balloon Market, Global, 2022 – 2032 |
| Figure 5‑24: Units Sold by Region, Standard PTA Balloon Market, Global, 2022 – 2032 |
| Figure 5‑25: Average Selling Price by Region, Standard PTA Balloon Market, Global, 2022 – 2032 (US$) |
| Figure 5‑26: Market Value by Region, Standard PTA Balloon Market, Global, 2022 – 2032 (US$M) |
| Figure 5‑27: High-Pressure PTA Balloon Market, Global, 2022 – 2032 |
| Figure 5‑28: Units Sold by Region, High-Pressure PTA Balloon Market, Global, 2022 – 2032 |
| Figure 5‑29: Average Selling Price by Region, High-Pressure PTA Balloon Market, Global, 2022 – 2032 (US$) |
| Figure 5‑30: Market Value by Region, High-Pressure PTA Balloon Market, Global, 2022 – 2032 (US$M) |
| Figure 5‑31: Large PTA Balloon Market, Global, 2022 – 2032 |
| Figure 5‑32: Units Sold by Region, Large PTA Balloon Market, Global, 2022 – 2032 |
| Figure 5‑33: Average Selling Price by Region, Large PTA Balloon Market, Global, 2022 – 2032 (US$) |
| Figure 5‑34: Market Value by Region, Large PTA Balloon Market, Global, 2022 – 2032 (US$M) |
| Figure 5‑35: Small PTA Balloon Market, Global, 2022 – 2032 |
| Figure 5‑36: Units Sold by Region, Small PTA Balloon Market, Global, 2022 – 2032 |
| Figure 5‑37: Average Selling Price by Region, Small PTA Balloon Market, Global, 2022 – 2032 (US$) |
| Figure 5‑38: Market Value by Region, Small PTA Balloon Market, Global, 2022 – 2032 (US$M) |
| Figure 5‑39: Specialty PTA Balloon PTA Balloon Market, Global, 2022 – 2032 |
| Figure 5‑40: Units Sold by Region, Specialty PTA Balloon PTA Balloon Market, Global, 2022 – 2032 |
| Figure 5‑41: Average Selling Price by Region, Specialty PTA Balloon PTA Balloon Market, Global, 2022 – 2032 (US$) |
| Figure 5‑42: Market Value by Region, Specialty PTA Balloon PTA Balloon Market, Global, 2022 – 2032 (US$M) |
| Figure 5‑43: Units Sold by Application, PTA Balloon Catheter Market, Global, 2022 – 2032 |
| Figure 5‑44: Units Sold by Region, Central Venous/Hemodialysis Access PTA Balloon Market, Global, 2022 – 2032 |
| Figure 5‑45: Units Sold by Region, Femoral Popliteal PTA Balloon Market, Global, 2022 – 2032 |
| Figure 5‑46: Units Sold by Region, Iliac PTA Balloon Market, Global, 2022 – 2032 |
| Figure 5‑47: Units Sold by Region, Infra-Popliteal PTA Balloon Market, Global, 2022 – 2032 |
| Figure 5‑48: Units Sold by Region, Renal PTA Balloon Market, Global, 2022 – 2032 |
| Figure 5‑49: Units Sold by Region, Carotid PTA Balloon Market, Global, 2022 – 2032 |
| Figure 5‑50: Units Sold by Region, Aorta PTA Balloon Market, Global, 2022 – 2032 |
| Figure 5‑51: Units Sold by Region, Otehers PTA Balloon Market, Global, 2022 – 2032 |
| Figure 5‑52: Leading Competitors, Percutaneous Transluminal Angioplasty Balloon Market, Global, 2025 |
| Figure 6‑1: Drug-Coated Balloon Procedures Covered |
| Figure 6‑2: Drug-Coated Balloon Regions Covered, Global (1 of 2) |
| Figure 6‑3: Drug-Coated Balloon Regions Covered, Global (2 of 2) |
| Figure 6‑4: Drug-Coated Balloon Procedures by Region, Global, 2022 – 2032 |
| Figure 6‑5: Drug-Coated Balloon Procedures by Country, North America, 2022 – 2032 |
| Figure 6‑6: Drug-Coated Balloon Procedures by Country, Latin America, 2022 – 2032 (1 of 2) |
| Figure 6‑7: Drug-Coated Balloon Procedures by Country, Latin America, 2022 – 2032 (2 of 2) |
| Figure 6‑8: Drug-Coated Balloon Procedures by Country, Western Europe, 2022 – 2032 |
| Figure 6‑9: Drug-Coated Balloon Procedures by Country, Central & Eastern Europe, 2022 – 2032 (1 of 2) |
| Figure 6‑10: Drug-Coated Balloon Procedures by Country, Central & Eastern Europe, 2022 – 2032 (2 of 2) |
| Figure 6‑11: Drug-Coated Balloon Procedures by Country, Middle East, 2022 – 2032 |
| Figure 6‑12: Drug-Coated Balloon Procedures by Country, Asia-Pacific, 2022 – 2032 (1 of 3) |
| Figure 6‑13: Drug-Coated Balloon Procedures by Country, Asia-Pacific, 2022 – 2032 (2 of 3) |
| Figure 6‑14: Drug-Coated Balloon Procedures by Country, Asia-Pacific, 2022 – 2032 (3 of 3) |
| Figure 6‑15: Drug-Coated Balloon Procedures by Country, Africa, 2022 – 2032 |
| Figure 6‑16: Drug-Coated Balloon Market, Global, 2022 – 2032 |
| Figure 6‑17: Units Sold by Region, Drug-Coated Balloon Market, Global, 2022 – 2032 |
| Figure 6‑18: Average Selling Price by Region, Drug-Coated Balloon Market, Global, 2022 – 2032 (US$) |
| Figure 6‑19: Market Value by Region, Drug-Coated Balloon Market, Global, 2022 – 2032 (US$M) |
| Figure 6‑20: Drug-Coated Balloon Unit Analysis by Indication, Global, 2022 – 2032 |
| Figure 6‑21: Units Sold by Region, SFA Drug-Coated Balloon Market, Global, 2022 – 2032 |
| Figure 6‑22: Units Sold by Region, AV Access Drug-Coated Balloon Market, Global, 2022 – 2032 |
| Figure 6‑23: Leading Competitors, Drug-Coated Balloon Market, Global, 2025 |
| Figure 7‑1: Atherectomy Procedures Covered |
| Figure 7‑2: Atherectomy Markets Covered |
| Figure 7‑3: Atherectomy Device Regions Covered, Global (1 of 2) |
| Figure 7‑4: Atherectomy Device Regions Covered, Global (2 of 2) |
| Figure 7‑5: Atherectomy Procedures by Region, Global, 2022 – 2032 |
| Figure 7‑6: Atherectomy Procedures by Country, North America, 2022 – 2032 |
| Figure 7‑7: Atherectomy Procedures by Country, Latin America, 2022 – 2032 (1 of 2) |
| Figure 7‑8: Atherectomy Procedures by Country, Latin America, 2022 – 2032 (2 of 2) |
| Figure 7‑9: Atherectomy Procedures by Country, Western Europe, 2022 – 2032 |
| Figure 7‑10: Atherectomy Procedures by Country, Central & Eastern Europe, 2022 – 2032 (1 of 2) |
| Figure 7‑11: Atherectomy Procedures by Country, Central & Eastern Europe, 2022 – 2032 (2 of 2) |
| Figure 7‑12: Atherectomy Procedures by Country, Middle East, 2022 – 2032 |
| Figure 7‑13: Atherectomy Procedures by Country, Asia-Pacific, 2022 – 2032 (1 of 3) |
| Figure 7‑14: Atherectomy Procedures by Country, Asia-Pacific, 2022 – 2032 (2 of 3) |
| Figure 7‑15: Atherectomy Procedures by Country, Asia-Pacific, 2022 – 2032 (3 of 3) |
| Figure 7‑16: Atherectomy Procedures by Country, Africa, 2022 – 2032 |
| Figure 7‑17: Atherectomy Device Market by Segment, Global, 2022 – 2032 (US$M) |
| Figure 7‑18: Atherectomy Device Market by Region, Global, 2022 – 2032 (US$M) |
| Figure 7‑19: Laser Atherectomy Device Market, Global, 2022 – 2032 |
| Figure 7‑20: Units Sold by Region, Laser Atherectomy Device Market, Global, 2022 – 2032 |
| Figure 7‑21: Average Selling Price by Region, Laser atherectomy Device Market, Global, 2022 – 2032 (US$) |
| Figure 7‑22: Market Value by Region, Laser Atherectomy Device Market, Global, 2022 – 2032 (US$M) |
| Figure 7‑23: Mechanical Atherectomy Device Market, Global, 2022 – 2032 |
| Figure 7‑24: Units Sold by Region, Mechanical Atherectomy Device Market, Global, 2022 – 2032 |
| Figure 7‑25: Average Selling Price by Region, Mechanical Atherectomy Device Market, Global, 2022 – 2032 (US$) |
| Figure 7‑26: Market Value by Region, Mechanical Atherectomy Market, Global, 2022 – 2032 (US$M) |
| Figure 7‑27: Leading Competitors, Atherectomy Device Market, Global, 2025 |
| Figure 8‑1: Intravascular Lithotripsy Procedures Covered |
| Figure 8‑2: Intravascular Lithotripsy Regions Covered, Global (1 of 2) |
| Figure 8‑3: Intravascular Lithotripsy Regions Covered, Global (2 of 2) |
| Figure 8‑4: Intravascular Lithotripsy Procedures by Region, Global, 2022 – 2032 |
| Figure 8‑5: Intravascular Lithotripsy Procedures by Country, North America, 2022 – 2032 |
| Figure 8‑6: Intravascular Lithotripsy Procedures by Country, Latin America, 2022 – 2032 (1 of 2) |
| Figure 8‑7: Intravascular Lithotripsy Procedures by Country, Latin America, 2022 – 2032 (2 of 2) |
| Figure 8‑8: Intravascular Lithotripsy Procedures by Country, Western Europe, 2022 – 2032 |
| Figure 8‑9: Intravascular Lithotripsy Procedures by Country, Central & Eastern Europe, 2022 – 2032 (1 of 2) |
| Figure 8‑10: Intravascular Lithotripsy Procedures by Country, Central & Eastern Europe, 2022 – 2032 (2 of 2) |
| Figure 8‑11: Intravascular Lithotripsy Procedures by Country, Middle East, 2022 – 2032 |
| Figure 8‑12: Intravascular Lithotripsy Procedures by Country, Asia-Pacific, 2022 – 2032 (1 of 3) |
| Figure 8‑13: Intravascular Lithotripsy Procedures by Country, Asia-Pacific, 2022 – 2032 (2 of 3) |
| Figure 8‑14: Intravascular Lithotripsy Procedures by Country, Asia-Pacific, 2022 – 2032 (3 of 3) |
| Figure 8‑15: Intravascular Lithotripsy Procedures by Country, Africa, 2022 – 2032 |
| Figure 8‑16: Intravascular Lithotripsy Market, Global, 2022 – 2032 |
| Figure 8‑17: Units Sold by Region, Intravascular Lithotripsy Market, Global, 2022 – 2032 |
| Figure 8‑18: Average Selling Price by Region, Intravascular Lithotripsy Market, Global, 2022 – 2032 (US$) |
| Figure 8‑19: Market Value by Region, Intravascular Lithotripsy Market, Global, 2022 – 2032 (US$M) |
| Figure 8‑20: Leading Competitors, Intravascular Lithotripsy Market, Global, 2025 |
| Figure 9‑1: CTO Device Procedures Covered |
| Figure 9‑2: CTO Device Markets Covered |
| Figure 9‑3: CTO Device Regions Covered, Global (1 of 2) |
| Figure 9‑4: CTO Device Regions Covered, Global (2 of 2) |
| Figure 9‑5: CTO Procedures by Segment, Global, 2022 – 2032 |
| Figure 9‑6: CTO Procedures by Region, Global, 2022 – 2032 |
| Figure 9‑7: CTO Procedures by Country, North America, 2022 – 2032 |
| Figure 9‑8: CTO Procedures by Country, Latin America, 2022 – 2032 (1 of 2) |
| Figure 9‑9: CTO Procedures by Country, Latin America, 2022 – 2032 (2 of 2) |
| Figure 9‑10: CTO Procedures by Country, Western Europe, 2022 – 2032 |
| Figure 9‑11: CTO Procedures by Country, Central & Eastern Europe, 2022 – 2032 (1 of 2) |
| Figure 9‑12: CTO Procedures by Country, Central & Eastern Europe, 2022 – 2032 (2 of 2) |
| Figure 9‑13: CTO Procedures by Country, Middle East, 2022 – 2032 |
| Figure 9‑14: CTO Procedures by Country, Asia-Pacific, 2022 – 2032 (1 of 3) |
| Figure 9‑15: CTO Procedures by Country, Asia-Pacific, 2022 – 2032 (2 of 3) |
| Figure 9‑16: CTO Procedures by Country, Asia-Pacific, 2022 – 2032 (3 of 3) |
| Figure 9‑17: CTO Procedures by Country, Africa, 2022 – 2032 |
| Figure 9‑18: Re-Entry Procedures by Region, Global, 2022 – 2032 |
| Figure 9‑19: Re-Entry Procedures by Country, North America, 2022 – 2032 |
| Figure 9‑20: Re-Entry Procedures by Country, Latin America, 2022 – 2032 (1 of 2) |
| Figure 9‑21: Re-Entry Procedures by Country, Latin America, 2022 – 2032 (2 of 2) |
| Figure 9‑22: Re-Entry Procedures by Country, Western Europe, 2022 – 2032 |
| Figure 9‑23: Re-Entry Procedures by Country, Central & Eastern Europe, 2022 – 2032 (1 of 2) |
| Figure 9‑24: Re-Entry Procedures by Country, Central & Eastern Europe, 2022 – 2032 (2 of 2) |
| Figure 9‑25: Re-Entry Procedures by Country, Middle East, 2022 – 2032 |
| Figure 9‑26: Re-Entry Procedures by Country, Asia-Pacific, 2022 – 2032 (1 of 3) |
| Figure 9‑27: Re-Entry Procedures by Country, Asia-Pacific, 2022 – 2032 (2 of 3) |
| Figure 9‑28: Re-Entry Procedures by Country, Asia-Pacific, 2022 – 2032 (3 of 3) |
| Figure 9‑29: Re-Entry Procedures by Country, Africa, 2022 – 2032 |
| Figure 9‑30: Recanalization Procedures by Region, Global, 2022 – 2032 |
| Figure 9‑31: Recanalization Procedures by Country, North America, 2022 – 2032 |
| Figure 9‑32: Recanalization Procedures by Country, Latin America, 2022 – 2032 (1 of 2) |
| Figure 9‑33: Recanalization Procedures by Country, Latin America, 2022 – 2032 (2 of 2) |
| Figure 9‑34: Recanalization Procedures by Country, Western Europe, 2022 – 2032 |
| Figure 9‑35: Recanalization Procedures by Country, Central & Eastern Europe, 2022 – 2032 (1 of 2) |
| Figure 9‑36: Recanalization Procedures by Country, Central & Eastern Europe, 2022 – 2032 (2 of 2) |
| Figure 9‑37: Recanalization Procedures by Country, Middle East, 2022 – 2032 |
| Figure 9‑38: Recanalization Procedures by Country, Asia-Pacific, 2022 – 2032 (1 of 3) |
| Figure 9‑39: Recanalization Procedures by Country, Asia-Pacific, 2022 – 2032 (2 of 3) |
| Figure 9‑40: Recanalization Procedures by Country, Asia-Pacific, 2022 – 2032 (3 of 3) |
| Figure 9‑41: Recanalization Procedures by Country, Africa, 2022 – 2032 |
| Figure 9‑42: CTO Device Market by Segment, Global, 2022 – 2032 (US$M) |
| Figure 9‑43: CTO Device Market by Region, Global, 2022 – 2032 (US$M) |
| Figure 9‑44: Total CTO Device Market, Global, 2022 – 2032 |
| Figure 9‑45: Units Sold by Region, CTO Device Market, Global, 2022 – 2032 |
| Figure 9‑46: Average Selling Price by Region, CTO Device Market, Global, 2022 – 2032 (US$) |
| Figure 9‑47: Market Value by Region, CTO Device Market, Global, 2022 – 2032 (US$M) |
| Figure 9‑48: Re-Entry Device Market, Global, 2022 – 2032 |
| Figure 9‑49: Units Sold by Region, Re-Entry Device Market, Global, 2022 – 2032 |
| Figure 9‑50: Average Selling Price by Region, Re-Entry Device Market, Global, 2022 – 2032 (US$) |
| Figure 9‑51: Market Value by Region, Re-Entry Device Market, Global, 2022 – 2032 (US$M) |
| Figure 9‑52: Recanalization Device Market, Global, 2022 – 2032 |
| Figure 9‑53: Units Sold by Region, Recanalization Device Market, Global, 2022 – 2032 |
| Figure 9‑54: Average Selling Price by Region, Recanalization Device Market, Global, 2022 – 2032 (US$) |
| Figure 9‑55: Market Value by Region, Recanalization Device Market, Global, 2022 – 2032 (US$M) |
| Figure 9‑56: Leading Competitors, CTO Device Market, Global, 2025 |
| Figure 10‑1: Surgical Graft Procedures Covered |
| Figure 10‑2: Surgical Graft Markets Covered |
| Figure 10‑3: Surgical Graft Regions Covered, Global (1 of 2) |
| Figure 10‑4: Surgical Graft Regions Covered, Global (2 of 2) |
| Figure 10‑5: Surgical Graft Procedures by Segment, Global, 2022 – 2032 |
| Figure 10‑6: Surgical Graft Procedures by Region, Global, 2022 – 2032 |
| Figure 10‑7: Surgical Graft Procedures by Country, North America, 2022 – 2032 |
| Figure 10‑8: Surgical Graft Procedures by Country, Latin America, 2022 – 2032 (1 of 2) |
| Figure 10‑9: Surgical Graft Procedures by Country, Latin America, 2022 – 2032 (2 of 2) |
| Figure 10‑10: Surgical Graft Procedures by Country, Western Europe, 2022 – 2032 |
| Figure 10‑11: Surgical Graft Procedures by Country, Central & Eastern Europe, 2022 – 2032 (1 of 2) |
| Figure 10‑12: Surgical Graft Procedures by Country, Central & Eastern Europe, 2022 – 2032 (2 of 2) |
| Figure 10‑13: Surgical Graft Procedures by Country, Middle East, 2022 – 2032 |
| Figure 10‑14: Surgical Graft Procedures by Country, Asia-Pacific, 2022 – 2032 (1 of 3) |
| Figure 10‑15: Surgical Graft Procedures by Country, Asia-Pacific, 2022 – 2032 (2 of 3) |
| Figure 10‑16: Surgical Graft Procedures by Country, Asia-Pacific, 2022 – 2032 (3 of 3) |
| Figure 10‑17: Surgical Graft Procedures by Country, Africa, 2022 – 2032 |
| Figure 10‑18: Lower-Limb Surgical Graft Procedures by Region, Global, 2022 – 2032 |
| Figure 10‑19: Lower-Limb Surgical Graft Procedures by Country, North America, 2022 – 2032 |
| Figure 10‑20: Lower-Limb Surgical Graft Procedures by Country, Latin America, 2022 – 2032 (1 of 2) |
| Figure 10‑21: Lower-Limb Surgical Graft Procedures by Country, Latin America, 2022 – 2032 (2 of 2) |
| Figure 10‑22: Lower-Limb Surgical Graft Procedures by Country, Western Europe, 2022 – 2032 |
| Figure 10‑23: Lower-Limb Surgical Graft Procedures by Country, Central & Eastern Europe, 2022 – 2032 (1 of 2) |
| Figure 10‑24: Lower-Limb Surgical Graft Procedures by Country, Central & Eastern Europe, 2022 – 2032 (2 of 2) |
| Figure 10‑25: Lower-Limb Surgical Graft Procedures by Country, Middle East, 2022 – 2032 |
| Figure 10‑26: Lower-Limb Surgical Graft Procedures by Country, Asia-Pacific, 2022 – 2032 (1 of 3) |
| Figure 10‑27: Lower-Limb Surgical Graft Procedures by Country, Asia-Pacific, 2022 – 2032 (2 of 3) |
| Figure 10‑28: Lower-Limb Surgical Graft Procedures by Country, Asia-Pacific, 2022 – 2032 (3 of 3) |
| Figure 10‑29: Lower-Limb Surgical Graft Procedures by Country, Africa, 2022 – 2032 |
| Figure 10‑30: Aorta Repair Surgical Graft Procedures by Segment, Global, 2022 – 2032 |
| Figure 10‑31: Aorta Repair Surgical Graft Procedures by Region, Global, 2022 – 2032 |
| Figure 10‑32: Aorta Repair Surgical Graft Procedures by Country, North America, 2022 – 2032 |
| Figure 10‑33: Aorta Repair Surgical Graft Procedures by Country, Latin America, 2022 – 2032 (1 of 2) |
| Figure 10‑34: Aorta Repair Surgical Graft Procedures by Country, Latin America, 2022 – 2032 (2 of 2) |
| Figure 10‑35: Aorta Repair Surgical Graft Procedures by Country, Western Europe, 2022 – 2032 |
| Figure 10‑36: Aorta Repair Surgical Graft Procedures by Country, Central & Eastern Europe, 2022 – 2032 (1 of 2) |
| Figure 10‑37: Aorta Repair Surgical Graft Procedures by Country, Central & Eastern Europe, 2022 – 2032 (2 of 2) |
| Figure 10‑38: Aorta Repair Surgical Graft Procedures by Country, Middle East, 2022 – 2032 |
| Figure 10‑39: Aorta Repair Surgical Graft Procedures by Country, Asia-Pacific, 2022 – 2032 (1 of 3) |
| Figure 10‑40: Aorta Repair Surgical Graft Procedures by Country, Asia-Pacific, 2022 – 2032 (2 of 3) |
| Figure 10‑41: Aorta Repair Surgical Graft Procedures by Country, Asia-Pacific, 2022 – 2032 (3 of 3) |
| Figure 10‑42: Aorta Repair Surgical Graft Procedures by Country, Africa, 2022 – 2032 |
| Figure 10‑43: AAA Surgical Graft Procedures by Region, Global, 2022 – 2032 |
| Figure 10‑44: AAA Surgical Graft Procedures by Country, North America, 2022 – 2032 |
| Figure 10‑45: AAA Surgical Graft Procedures by Country, Latin America, 2022 – 2032 (1 of 2) |
| Figure 10‑46: AAA Surgical Graft Procedures by Country, Latin America, 2022 – 2032 (2 of 2) |
| Figure 10‑47: AAA Surgical Graft Procedures by Country, Western Europe, 2022 – 2032 |
| Figure 10‑48: AAA Surgical Graft Procedures by Country, Central & Eastern Europe, 2022 – 2032 (1 of 2) |
| Figure 10‑49: AAA Surgical Graft Procedures by Country, Central & Eastern Europe, 2022 – 2032 (2 of 2) |
| Figure 10‑50: AAA Surgical Graft Procedures by Country, Middle East, 2022 – 2032 |
| Figure 10‑51: AAA Surgical Graft Procedures by Country, Asia-Pacific, 2022 – 2032 (1 of 3) |
| Figure 10‑52: AAA Surgical Graft Procedures by Country, Asia-Pacific, 2022 – 2032 (2 of 3) |
| Figure 10‑53: AAA Surgical Graft Procedures by Country, Asia-Pacific, 2022 – 2032 (3 of 3) |
| Figure 10‑54: AAA Surgical Graft Procedures by Country, Africa, 2022 – 2032 |
| Figure 10‑55: TAA Surgical Graft Procedures by Region, Global, 2022 – 2032 |
| Figure 10‑56: TAA Surgical Graft Procedures by Country, North America, 2022 – 2032 |
| Figure 10‑57: TAA Surgical Graft Procedures by Country, Latin America, 2022 – 2032 (1 of 2) |
| Figure 10‑58: TAA Surgical Graft Procedures by Country, Latin America, 2022 – 2032 (2 of 2) |
| Figure 10‑59: TAA Surgical Graft Procedures by Country, Western Europe, 2022 – 2032 |
| Figure 10‑60: TAA Surgical Graft Procedures by Country, Central & Eastern Europe, 2022 – 2032 (1 of 2) |
| Figure 10‑61: TAA Surgical Graft Procedures by Country, Central & Eastern Europe, 2022 – 2032 (2 of 2) |
| Figure 10‑62: TAA Surgical Graft Procedures by Country, Middle East, 2022 – 2032 |
| Figure 10‑63: TAA Surgical Graft Procedures by Country, Asia-Pacific, 2022 – 2032 (1 of 3) |
| Figure 10‑64: TAA Surgical Graft Procedures by Country, Asia-Pacific, 2022 – 2032 (2 of 3) |
| Figure 10‑65: TAA Surgical Graft Procedures by Country, Asia-Pacific, 2022 – 2032 (3 of 3) |
| Figure 10‑66: TAA Surgical Graft Procedures by Country, Africa, 2022 – 2032 |
| Figure 10‑67: Extra-Anatomical Bypass Surgical Graft Procedures by Region, Global, 2022 – 2032 |
| Figure 10‑68: Extra-Anatomical Bypass Surgical Graft Procedures by Country, North America, 2022 – 2032 |
| Figure 10‑69: Extra-Anatomical Bypass Surgical Graft Procedures by Country, Latin America, 2022 – 2032 (1 of 2) |
| Figure 10‑70: Extra-Anatomical Bypass Surgical Graft Procedures by Country, Latin America, 2022 – 2032 (2 of 2) |
| Figure 10‑71: Extra-Anatomical Bypass Surgical Graft Procedures by Country, Western Europe, 2022 – 2032 |
| Figure 10‑72: Extra-Anatomical Bypass Surgical Graft Procedures by Country, Central & Eastern Europe, 2022 – 2032 (1 of 2) |
| Figure 10‑73: Extra-Anatomical Bypass Surgical Graft Procedures by Country, Central & Eastern Europe, 2022 – 2032 (2 of 2) |
| Figure 10‑74: Extra-Anatomical Bypass Surgical Graft Procedures by Country, Middle East, 2022 – 2032 |
| Figure 10‑75: Extra-Anatomical Bypass Surgical Graft Procedures by Country, Asia-Pacific, 2022 – 2032 (1 of 3) |
| Figure 10‑76: Extra-Anatomical Bypass Surgical Graft Procedures by Country, Asia-Pacific, 2022 – 2032 (2 of 3) |
| Figure 10‑77: Extra-Anatomical Bypass Surgical Graft Procedures by Country, Asia-Pacific, 2022 – 2032 (3 of 3) |
| Figure 10‑78: Extra-Anatomical Bypass Surgical Graft Procedures by Country, Africa, 2022 – 2032 |
| Figure 10‑79: Surgical Graft Market by Segment, Global, 2022 – 2032 (US$M) |
| Figure 10‑80: Surgical Graft Market by Region, Global, 2022 – 2032 (US$M) |
| Figure 10‑81: Total Surgical Graft Market, Global, 2022 – 2032 |
| Figure 10‑82: Units Sold by Region, Surgical Graft Market, Global, 2022 – 2032 |
| Figure 10‑83: Average Selling Price by Region, Surgical Graft Market, Global, 2022 – 2032 (US$) |
| Figure 10‑84: Market Value by Region, Surgical Graft Market, Global, 2022 – 2032 (US$M) |
| Figure 10‑85: Lower-Limb Surgical Graft Market, Global, 2022 – 2032 |
| Figure 10‑86: Units Sold by Region, Lower-Limb Surgical Graft Market, Global, 2022 – 2032 |
| Figure 10‑87: Average Selling Price by Region, Lower-Limb Surgical Graft Market, Global, 2022 – 2032 (US$) |
| Figure 10‑88: Market Value by Region, Lower-Limb Surgical Graft Market, Global, 2022 – 2032 (US$M) |
| Figure 10‑89: Aorta Repair Surgical Graft Market by Segment, Global, 2022 – 2032 (US$M) |
| Figure 10‑90: Total Aorta Repair Surgical Graft Market, Global, 2022 – 2032 |
| Figure 10‑91: Units Sold by Region, Aorta Repair Surgical Graft Market, Global, 2022 – 2032 |
| Figure 10‑92: Average Selling Price by Region, Aorta Repair Surgical Graft Market, Global, 2022 – 2032 (US$) |
| Figure 10‑93: Market Value by Region, Aorta Repair Surgical Graft Market, Global, 2022 – 2032 (US$M) |
| Figure 10‑94: AAA Surgical Graft Surgical Graft Market, Global, 2022 – 2032 |
| Figure 10‑95: Units Sold by Region, AAA Surgical Graft Surgical Graft Market, Global, 2022 – 2032 |
| Figure 10‑96: Average Selling Price by Region, AAA Surgical Graft Surgical Graft Market, Global, 2022 – 2032 (US$) |
| Figure 10‑97: Market Value by Region, AAA Surgical Graft Surgical Graft Market, Global, 2022 – 2032 (US$M) |
| Figure 10‑98: TAA Surgical Graft Surgical Graft Market, Global, 2022 – 2032 |
| Figure 10‑99: Units Sold by Region, TAA Surgical Graft Surgical Graft Market, Global, 2022 – 2032 |
| Figure 10‑100: Average Selling Price by Region, TAA Surgical Graft Surgical Graft Market, Global, 2022 – 2032 (US$) |
| Figure 10‑101: Market Value by Region, TAA Surgical Graft Surgical Graft Market, Global, 2022 – 2032 (US$M) |
| Figure 10‑102: Extra-Anatomical Bypass Surgical Graft Market, Global, 2022 – 2032 |
| Figure 10‑103: Units Sold by Region, Extra-Anatomical Bypass Surgical Graft Market, Global, 2022 – 2032 |
| Figure 10‑104: Average Selling Price by Region, Extra-Anatomical Bypass Surgical Graft Market, Global, 2022 – 2032 (US$) |
| Figure 10‑105: Market Value by Region, Extra-Anatomical Bypass Surgical Graft Market, Global, 2022 – 2032 (US$M) |
| Figure 10‑106: Leading Competitors, Surgical Graft Market, Global, 2025 |
| Figure 11‑1: Stent Graft Procedures Covered |
| Figure 11‑2: Stent Graft Markets Covered |
| Figure 11‑3: Stent Graft Regions Covered, Global (1 of 2) |
| Figure 11‑4: Stent Graft Regions Covered, Global (2 of 2) |
| Figure 11‑5: Stent Graft Procedures by Segment, Global, 2022 – 2032 |
| Figure 11‑6: Stent Graft Procedures by Region, Global, 2022 – 2032 |
| Figure 11‑7: Stent Graft Procedures by Country, North America, 2022 – 2032 |
| Figure 11‑8: Stent Graft Procedures by Country, Latin America, 2022 – 2032 (1 of 2) |
| Figure 11‑9: Stent Graft Procedures by Country, Latin America, 2022 – 2032 (2 of 2) |
| Figure 11‑10: Stent Graft Procedures by Country, Western Europe, 2022 – 2032 |
| Figure 11‑11: Stent Graft Procedures by Country, Central & Eastern Europe, 2022 – 2032 (1 of 2) |
| Figure 11‑12: Stent Graft Procedures by Country, Central & Eastern Europe, 2022 – 2032 (2 of 2) |
| Figure 11‑13: Stent Graft Procedures by Country, Middle East, 2022 – 2032 |
| Figure 11‑14: Stent Graft Procedures by Country, Asia-Pacific, 2022 – 2032 (1 of 3) |
| Figure 11‑15: Stent Graft Procedures by Country, Asia-Pacific, 2022 – 2032 (2 of 3) |
| Figure 11‑16: Stent Graft Procedures by Country, Asia-Pacific, 2022 – 2032 (3 of 3) |
| Figure 11‑17: Stent Graft Procedures by Country, Africa, 2022 – 2032 |
| Figure 11‑18: AAA Stent Graft Procedures by Region, Global, 2022 – 2032 |
| Figure 11‑19: AAA Stent Graft Procedures by Country, North America, 2022 – 2032 |
| Figure 11‑20: AAA Stent Graft Procedures by Country, Latin America, 2022 – 2032 (1 of 2) |
| Figure 11‑21: AAA Stent Graft Procedures by Country, Latin America, 2022 – 2032 (2 of 2) |
| Figure 11‑22: AAA Stent Graft Procedures by Country, Western Europe, 2022 – 2032 |
| Figure 11‑23: AAA Stent Graft Procedures by Country, Central & Eastern Europe, 2022 – 2032 (1 of 2) |
| Figure 11‑24: AAA Stent Graft Procedures by Country, Central & Eastern Europe, 2022 – 2032 (2 of 2) |
| Figure 11‑25: AAA Stent Graft Procedures by Country, Middle East, 2022 – 2032 |
| Figure 11‑26: AAA Stent Graft Procedures by Country, Asia-Pacific, 2022 – 2032 (1 of 3) |
| Figure 11‑27: AAA Stent Graft Procedures by Country, Asia-Pacific, 2022 – 2032 (2 of 3) |
| Figure 11‑28: AAA Stent Graft Procedures by Country, Asia-Pacific, 2022 – 2032 (3 of 3) |
| Figure 11‑29: AAA Stent Graft Procedures by Country, Africa, 2022 – 2032 |
| Figure 11‑30: Fenestrated Stent Graft Procedures by Region, Global, 2022 – 2032 |
| Figure 11‑31: Fenestrated Stent Graft Procedures by Country, North America, 2022 – 2032 |
| Figure 11‑32: Fenestrated Stent Graft Procedures by Country, Latin America, 2022 – 2032 (1 of 2) |
| Figure 11‑33: Fenestrated Stent Graft Procedures by Country, Latin America, 2022 – 2032 (2 of 2) |
| Figure 11‑34: Fenestrated Stent Graft Procedures by Country, Western Europe, 2022 – 2032 |
| Figure 11‑35: Fenestrated Stent Graft Procedures by Country, Central & Eastern Europe, 2022 – 2032 (1 of 2) |
| Figure 11‑36: Fenestrated Stent Graft Procedures by Country, Central & Eastern Europe, 2022 – 2032 (2 of 2) |
| Figure 11‑37: Fenestrated Stent Graft Procedures by Country, Middle East, 2022 – 2032 |
| Figure 11‑38: Fenestrated Stent Graft Procedures by Country, Asia-Pacific, 2022 – 2032 (1 of 3) |
| Figure 11‑39: Fenestrated Stent Graft Procedures by Country, Asia-Pacific, 2022 – 2032 (2 of 3) |
| Figure 11‑40: Fenestrated Stent Graft Procedures by Country, Asia-Pacific, 2022 – 2032 (3 of 3) |
| Figure 11‑41: Fenestrated Stent Graft Procedures by Country, Africa, 2022 – 2032 |
| Figure 11‑42: TAA Stent Graft Procedures by Region, Global, 2022 – 2032 |
| Figure 11‑43: TAA Stent Graft Procedures by Country, North America, 2022 – 2032 |
| Figure 11‑44: TAA Stent Graft Procedures by Country, Latin America, 2022 – 2032 (1 of 2) |
| Figure 11‑45: TAA Stent Graft Procedures by Country, Latin America, 2022 – 2032 (2 of 2) |
| Figure 11‑46: TAA Stent Graft Procedures by Country, Western Europe, 2022 – 2032 |
| Figure 11‑47: TAA Stent Graft Procedures by Country, Central & Eastern Europe, 2022 – 2032 (1 of 2) |
| Figure 11‑48: TAA Stent Graft Procedures by Country, Central & Eastern Europe, 2022 – 2032 (2 of 2) |
| Figure 11‑49: TAA Stent Graft Procedures by Country, Middle East, 2022 – 2032 |
| Figure 11‑50: TAA Stent Graft Procedures by Country, Asia-Pacific, 2022 – 2032 (1 of 3) |
| Figure 11‑51: TAA Stent Graft Procedures by Country, Asia-Pacific, 2022 – 2032 (2 of 3) |
| Figure 11‑52: TAA Stent Graft Procedures by Country, Asia-Pacific, 2022 – 2032 (3 of 3) |
| Figure 11‑53: TAA Stent Graft Procedures by Country, Africa, 2022 – 2032 |
| Figure 11‑54: Stent Graft Market by Segment, Global, 2022 – 2032 (US$M) |
| Figure 11‑55: Stent Graft Market by Region, Global, 2022 – 2032 (US$M) |
| Figure 11‑56: Stent Graft Market, Global, 2022 – 2032 |
| Figure 11‑57: Units Sold by Region, Stent Graft Market, Global, 2022 – 2032 |
| Figure 11‑58: Average Selling Price by Region, Stent Graft Market, Global, 2022 – 2032 (US$) |
| Figure 11‑59: Market Value by Region, Stent Graft Market, Global, 2022 – 2032 (US$M) |
| Figure 11‑60: AAA Stent Graft Market, Global, 2022 – 2032 |
| Figure 11‑61: Units Sold by Region, AAA Stent Graft Market, Global, 2022 – 2032 |
| Figure 11‑62: Average Selling Price by Region, AAA Stent Graft Market, Global, 2022 – 2032 (US$) |
| Figure 11‑63: Market Value by Region, AAA Stent Graft Market, Global, 2022 – 2032 (US$M) |
| Figure 11‑64: Fenestrated Stent Graft Market, Global, 2022 – 2032 |
| Figure 11‑65: Units Sold by Region, Fenestrated Stent Graft Market, Global, 2022 – 2032 |
| Figure 11‑66: Average Selling Price by Region, Fenestrated Stent Graft Market, Global, 2022 – 2032 (US$) |
| Figure 11‑67: Market Value by Region, Fenestrated Stent Graft Market, Global, 2022 – 2032 (US$M) |
| Figure 11‑68: TAA Stent Graft Market, Global, 2022 – 2032 |
| Figure 11‑69: Units Sold by Region, TAA Stent Graft Market, Global, 2022 – 2032 |
| Figure 11‑70: Average Selling Price by Region, TAA Stent Graft Market, Global, 2022 – 2032 (US$) |
| Figure 11‑71: Market Value by Region, TAA Stent Graft Market, Global, 2022 – 2032 (US$M) |
| Figure 11‑72: Leading Competitors, Stent Graft Market, Global, 2025 |
| Figure 12‑1: Embolic Protection Device Procedures Covered |
| Figure 12‑2: Embolic Protection Device Markets Covered |
| Figure 12‑3: Embolic Protection Device Regions Covered, Global (1 of 2) |
| Figure 12‑4: Embolic Protection Device Regions Covered, Global (2 of 2) |
| Figure 12‑5: Embolic Protection Device Procedures by Region, Global, 2022 – 2032 |
| Figure 12‑6: Embolic Protection Device Procedures by Country, North America, 2022 – 2032 |
| Figure 12‑7: Embolic Protection Device Procedures by Country, Latin America, 2022 – 2032 (1 of 2) |
| Figure 12‑8: Embolic Protection Device Procedures by Country, Latin America, 2022 – 2032 (2 of 2) |
| Figure 12‑9: Embolic Protection Device Procedures by Country, Western Europe, 2022 – 2032 |
| Figure 12‑10: Embolic Protection Device Procedures by Country, Central & Eastern Europe, 2022 – 2032 (1 of 2) |
| Figure 12‑11: Embolic Protection Device Procedures by Country, Central & Eastern Europe, 2022 – 2032 (2 of 2) |
| Figure 12‑12: Embolic Protection Device Procedures by Country, Middle East, 2022 – 2032 |
| Figure 12‑13: Embolic Protection Device Procedures by Country, Asia-Pacific, 2022 – 2032 (1 of 3) |
| Figure 12‑14: Embolic Protection Device Procedures by Country, Asia-Pacific, 2022 – 2032 (2 of 3) |
| Figure 12‑15: Embolic Protection Device Procedures by Country, Asia-Pacific, 2022 – 2032 (3 of 3) |
| Figure 12‑16: Embolic Protection Device Procedures by Country, Africa, 2022 – 2032 |
| Figure 12‑17: Embolic Protection Device Market by Segment, Global, 2022 – 2032 (US$M) |
| Figure 12‑18: Embolic Protection Device Market by Region, Global, 2022 – 2032 (US$M) |
| Figure 12‑19: Embolic Protection Device Market, Global, 2022 – 2032 |
| Figure 12‑20: Units Sold by Region, Embolic Protection Device Market, Global, 2022 – 2032 |
| Figure 12‑21: Average Selling Price by Region, Embolic Protection Device Market, Global, 2022 – 2032 (US$) |
| Figure 12‑22: Market Value by Region, Embolic Protection Device Market, Global, 2022 – 2032 (US$M) |
| Figure 12‑23: Carotid EPD Market, Global, 2022 – 2032 |
| Figure 12‑24: Units Sold by Region, Carotid EPD Market, Global, 2022 – 2032 |
| Figure 12‑25: Average Selling Price by Region, Carotid EPD Market, Global, 2022 – 2032 (US$) |
| Figure 12‑26: Market Value by Region, Carotid EPD Market, Global, 2022 – 2032 (US$M) |
| Figure 12‑27: Renal EPD Market, Global, 2022 – 2032 |
| Figure 12‑28: Units Sold by Region, Renal EPD Market, Global, 2022 – 2032 |
| Figure 12‑29: Average Selling Price by Region, Renal EPD Market, Global, 2022 – 2032 (US$) |
| Figure 12‑30: Market Value by Region, Renal EPD Market, Global, 2022 – 2032 (US$M) |
| Figure 12‑31: Lower-Limb EPD Market, Global, 2022 – 2032 |
| Figure 12‑32: Units Sold by Region, Lower-Limb EPD Market, Global, 2022 – 2032 |
| Figure 12‑33: Average Selling Price by Region, Lower-Limb EPD Market, Global, 2022 – 2032 (US$) |
| Figure 12‑34: Market Value by Region, Lower-Limb EPD Market, Global, 2022 – 2032 (US$M) |
| Figure 12‑35: Leading Competitors, Embolic Protection Device Market, Global, 2025 |
| Figure 13‑1: Peripheral Thrombus Management Procedures Covered |
| Figure 13‑2: Peripheral Thrombus Management Markets Covered |
| Figure 13‑3: Peripheral Thrombus Management Regions Covered, Global (1 of 2) |
| Figure 13‑4: Peripheral Thrombus Management Regions Covered, Global (2 of 2) |
| Figure 13‑5: Peripheral Thrombus Management Procedures by Region, Global, 2022 – 2032 |
| Figure 13‑6: Peripheral Thrombus Management Procedures by Country, North America, 2022 – 2032 |
| Figure 13‑7: Peripheral Thrombus Management Procedures by Country, Latin America, 2022 – 2032 (1 of 2) |
| Figure 13‑8: Peripheral Thrombus Management Procedures by Country, Latin America, 2022 – 2032 (2 of 2) |
| Figure 13‑9: Peripheral Thrombus Management Procedures by Country, Western Europe, 2022 – 2032 |
| Figure 13‑10: Peripheral Thrombus Management Procedures by Country, Central & Eastern Europe, 2022 – 2032 (1 of 2) |
| Figure 13‑11: Peripheral Thrombus Management Procedures by Country, Central & Eastern Europe, 2022 – 2032 (2 of 2) |
| Figure 13‑12: Peripheral Thrombus Management Procedures by Country, Middle East, 2022 – 2032 |
| Figure 13‑13: Peripheral Thrombus Management Procedures by Country, Asia-Pacific, 2022 – 2032 (1 of 3) |
| Figure 13‑14: Peripheral Thrombus Management Procedures by Country, Asia-Pacific, 2022 – 2032 (2 of 3) |
| Figure 13‑15: Peripheral Thrombus Management Procedures by Country, Asia-Pacific, 2022 – 2032 (3 of 3) |
| Figure 13‑16: Peripheral Thrombus Management Procedures by Country, Africa, 2022 – 2032 |
| Figure 13‑17: Peripheral Thrombus Management Market by Segment, Global, 2022 – 2032 (US$M) |
| Figure 13‑18: Peripheral Thrombus Management Market by Region, Global, 2022 – 2032 (US$M) |
| Figure 13‑19: Peripheral Thrombus Management Market, Global, 2022 – 2032 |
| Figure 13‑20: Units Sold by Region, Peripheral Thrombus Management Market, Global, 2022 – 2032 |
| Figure 13‑21: Average Selling Price by Region, Peripheral Thrombus Management Market, Global, 2022 – 2032 (US$) |
| Figure 13‑22: Market Value by Region, Peripheral Thrombus Management Market, Global, 2022 – 2032 (US$M) |
| Figure 13‑23: Traditional Thrombectomy Device Market, Global, 2022 – 2032 |
| Figure 13‑24: Units Sold by Region, Traditional Thrombectomy Device Market, Global, 2022 – 2032 |
| Figure 13‑25: Average Selling Price by Region, Traditional Thrombectomy Device Market, Global, 2022 – 2032 (US$) |
| Figure 13‑26: Market Value by Region, Traditional Thrombectomy Device Market, Global, 2022 – 2032 (US$M) |
| Figure 13‑27: Pharmacomechanical Thrombectomy Device Market, Global, 2022 – 2032 |
| Figure 13‑28: Units Sold by Region, Pharmacomechanical Thrombectomy Device Market, Global, 2022 – 2032 |
| Figure 13‑29: Average Selling Price by Region, Pharmacomechanical Thrombectomy Device Market, Global, 2022 – 2032 (US$) |
| Figure 13‑30: Market Value by Region, Pharmacomechanical Thrombectomy Device Market, Global, 2022 – 2032 (US$M) |
| Figure 13‑31: Catheter Directed Thrombolysis Device Market, Global, 2022 – 2032 |
| Figure 13‑32: Units Sold by Region, Traditional Thrombectomy Device Market, Global, 2022 – 2032 |
| Figure 13‑33: Average Selling Price by Region, Traditional Thrombectomy Device Market, Global, 2022 – 2032 (US$) |
| Figure 13‑34: Market Value by Region, Traditional Thrombectomy Device Market, Global, 2022 – 2032 (US$M) |
| Figure 13‑35: Leading Competitors, Peripheral Thrombus Management Market, Global, 2025 |
| Figure 14‑1: Peripheral IVUS Procedures Covered |
| Figure 14‑2: Peripheral IVUS Regions Covered, Global (1 of 2) |
| Figure 14‑3: Peripheral IVUS Regions Covered, Global (2 of 2) |
| Figure 14‑4: Peripheral IVUS Procedures by Region, Global, 2022 – 2032 |
| Figure 14‑5: Peripheral IVUS Procedures by Country, North America, 2022 – 2032 |
| Figure 14‑6: Peripheral IVUS Procedures by Country, Latin America, 2022 – 2032 (1 of 2) |
| Figure 14‑7: Peripheral IVUS Procedures by Country, Latin America, 2022 – 2032 (2 of 2) |
| Figure 14‑8: Peripheral IVUS Procedures by Country, Western Europe, 2022 – 2032 |
| Figure 14‑9: Peripheral IVUS Procedures by Country, Central & Eastern Europe, 2022 – 2032 (1 of 2) |
| Figure 14‑10: Peripheral IVUS Procedures by Country, Central & Eastern Europe, 2022 – 2032 (2 of 2) |
| Figure 14‑11: Peripheral IVUS Procedures by Country, Middle East, 2022 – 2032 |
| Figure 14‑12: Peripheral IVUS Procedures by Country, Asia-Pacific, 2022 – 2032 (1 of 3) |
| Figure 14‑13: Peripheral IVUS Procedures by Country, Asia-Pacific, 2022 – 2032 (2 of 3) |
| Figure 14‑14: Peripheral IVUS Procedures by Country, Asia-Pacific, 2022 – 2032 (3 of 3) |
| Figure 14‑15: Peripheral IVUS Procedures by Country, Africa, 2022 – 2032 |
| Figure 14‑16: Peripheral IVUS Market, Global, 2022 – 2032 |
| Figure 14‑17: Units Sold by Region, Peripheral IVUS Market, Global, 2022 – 2032 |
| Figure 14‑18: Average Selling Price by Region, Peripheral IVUS Market, Global, 2022 – 2032 (US$) |
| Figure 14‑19: Market Value by Region, Peripheral IVUS Market, Global, 2022 – 2032 (US$M) |
| Figure 14‑20: Leading Competitors, Peripheral IVUS Market, Global, 2025 |