Figure 1-1: Complex Peripheral Vascular Device Market Share Ranking by Segment, U.S., 2024 (1 of 2)
|
Figure 1-2: Complex Peripheral Vascular Device Market Share Ranking by Segment, U.S., 2024 (2 of 2)
|
Figure 1-3: Companies Researched in This Report (1 of 2)
|
Figure 1-4: Companies Researched in This Report (2 of 2)
|
Figure 1-5: Recent Events in the Peripheral Vascular Device Market, U.S., 2021 – 2025
|
Figure 1-6: Factors Impacting the Complex Peripheral Vascular Device Market by Segment, U.S. (1 of 2)
|
Figure 1-7: Factors Impacting the Complex Peripheral Vascular Device Market by Segment, U.S. (2 of 2)
|
Figure 1-8: Peripheral Vascular Device Procedures Covered by Indication (1 of 3)
|
Figure 1-9: Peripheral Vascular Device Procedures Covered by Indication (2 of 3)
|
Figure 1-10: Peripheral Vascular Device Procedures Covered by Indication (3 of 3)
|
Figure 1-11: Complex Peripheral Vascular Device Procedure Segmentation by Device Type (1 of 4)
|
Figure 1-12: Complex Peripheral Vascular Device Procedure Segmentation by Device Type (2 of 4)
|
Figure 1-13: Complex Peripheral Vascular Device Procedures Covered by Device Type (3 of 4)
|
Figure 1-14: Complex Peripheral Vascular Device Procedure Segmentation by Device Type (4 of 4)
|
Figure 1-15: Standard Peripheral Vascular Device Procedure Segmentation by Device Type
|
Figure 1-16: Procedure Codes Investigated
|
Figure 1-17: Complex Peripheral Vascular Device Market Segmentation (1 of 4)
|
Figure 1-18: Complex Peripheral Vascular Device Market Segmentation (2 of 4)
|
Figure 1-19: Complex Peripheral Vascular Device Market Segmentation (3 of 4)
|
Figure 1-20: Complex Peripheral Vascular Device Market Segmentation (4 of 4)
|
Figure 1-21: Standard Peripheral Vascular Device Market Segmentation (1 of 2)
|
Figure 1-22: Standard Peripheral Vascular Device Market Segmentation (2 of 2)
|
Figure 1-23: Key Analysis Updates
|
Figure 1-24: Version History
|
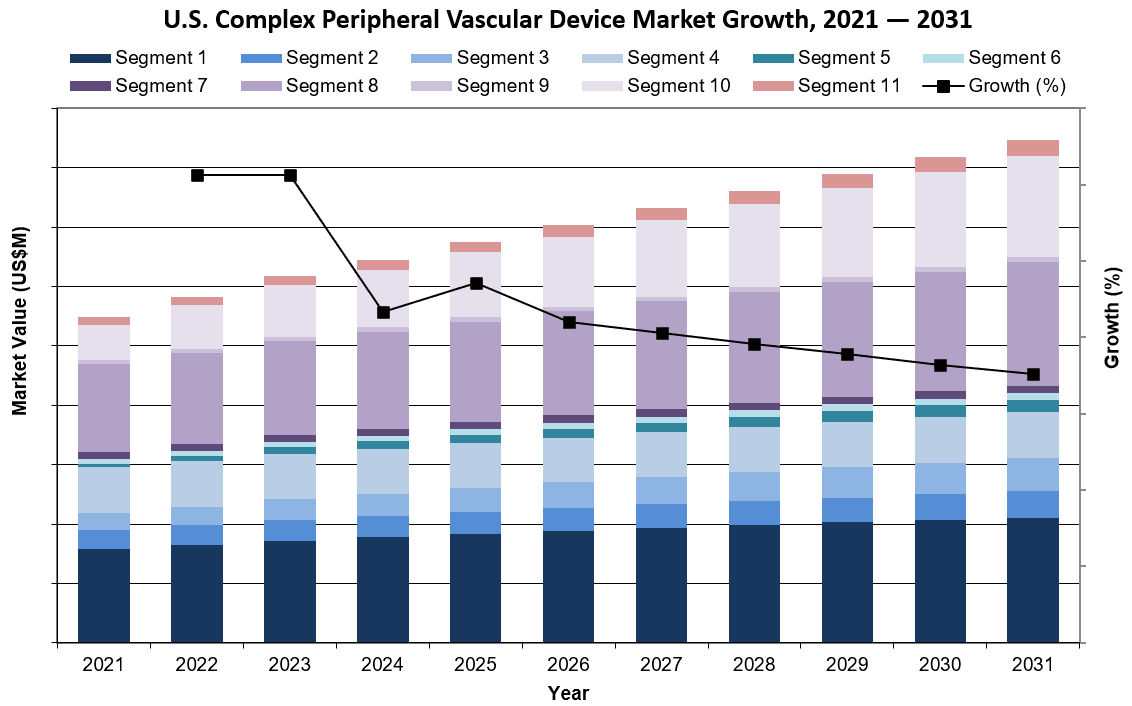
Figure 3-1: Complex Peripheral Vascular Device Market by Segment, U.S., 2021 – 2031 (US$M) (1 of 2)
|
Figure 3-2: Complex Peripheral Vascular Device Market by Segment, U.S., 2021 – 2031 (US$M) (2 of 2)
|
Figure 3-3: Standard Peripheral Vascular Device Market by Segment, U.S., 2021 – 2031 (US$M) (1 of 2)
|
Figure 3-4: Standard Peripheral Vascular Device Market by Segment, U.S., 2021 – 2031 (US$M) (2 of 2)
|
Figure 3-5: Leading Competitors, Complex Peripheral Vascular Device Market, U.S., 2024 (1 of 2)
|
Figure 3-6: Leading Competitors, Complex Peripheral Vascular Device Market, U.S., 2024 (2 of 2)
|
Figure 4-1: Procedure Codes Investigated, U.S., 2024
|
Figure 4-2: Complex Peripheral Vascular Procedures by Segment, U.S., 2021 – 2031 (1 of 2)
|
Figure 4-3: Complex Peripheral Vascular Procedures by Segment, U.S., 2021 – 2031 (2 of 2)
|
Figure 4-4: Above-the-Knee Procedures by Segment, U.S., 2021 – 2031 (1 of 2)
|
Figure 4-5: Above-the-Knee Procedures by Segment, U.S., 2021 – 2031 (2 of 2)
|
Figure 4-6: Above-the-Knee Stent Procedures by Device Type, U.S., 2021 – 2031
|
Figure 4-7: Above-the-Knee Stent Procedures by Care Setting, U.S., 2021 – 2031
|
Figure 4-8: Above-the-Knee POBA Procedures by Care Setting, U.S., 2021 – 2031
|
Figure 4-9: Above-the-Knee DCB Procedures by Care Setting, U.S., 2021 – 2031
|
Figure 4-10: Peripheral Intravascular Lithotripsy Procedures, U.S., 2021 – 2031
|
Figure 4-11: Above-the-Knee Atherectomy without Stent Procedures by Care Setting, U.S.,2021 – 2031
|
Figure 4-12: Above-the-Knee Atherectomy with Stent Procedures by Care Setting, U.S.,2021 – 2031
|
Figure 4-13: Surgical Graft Procedures, U.S., 2021 – 2031
|
Figure 4-14: Below-the-Knee Procedures by Intervention Type, U.S., 2021 – 2031 (1 of 2)
|
Figure 4-15: Below-the-Knee Procedures by Intervention Type, U.S., 2021 – 2031 (2 of 2)
|
Figure 4-16: Below-the-Knee Stent Procedures by Device Type, U.S., 2021 – 2031
|
Figure 4-17: Below-the-Knee Stent Procedures by Care Setting, U.S., 2021 – 2031
|
Figure 4-18: Below-the-Knee POBA Procedures by Care Setting, U.S., 2021 – 2031
|
Figure 4-19: Intravascular Lithotripsy Procedures, U.S., 2021 – 2031
|
Figure 4-20: Below-the-Knee Atherectomy without Stent Procedures by Care Setting, U.S.,2021 – 2031
|
Figure 4-21: Below-the-Knee Atherectomy with Stent Procedures by Care Setting, U.S.,2021 – 2031
|
Figure 4-22: Surgical Graft Procedures, U.S., 2021 – 2031
|
Figure 4-23: Iliac Procedures by Intervention Type, U.S., 2021 – 2031
|
Figure 4-24: Iliac Stent Procedures by Device Type, U.S., 2021 – 2031
|
Figure 4-25: Iliac Stent Procedures by Care Setting, U.S., 2021 – 2031
|
Figure 4-26: Iliac POBA Procedures by Care Setting, U.S., 2021 – 2031
|
Figure 4-27: AV Access Procedures by Intervention Type, U.S., 2021 – 2031
|
Figure 4-28: AV Access Covered Stent Procedures by Care Setting, U.S., 2021 – 2031
|
Figure 4-29: AV Access POBA Procedures by Care Setting, U.S., 2021 – 2031
|
Figure 4-30: AV Access DCB Procedures by Care Setting, U.S., 2021 – 2031
|
Figure 4-31: Renal Procedures by Intervention Type, U.S., 2021 – 2031
|
Figure 4-32: Carotid Intervention by Procedure Type, U.S., 2021 – 2031
|
Figure 4-33: Peripheral Vascular Stent Procedures by Device Type, U.S., 2021 – 2031
|
Figure 4-34: Peripheral Arterial Stent Procedures by Stent Type, U.S., 2021 – 2031
|
Figure 4-35: Bare-Metal Stent Procedures by Indication, U.S., 2021 – 2031
|
Figure 4-36: Bare-Metal Iliac Stent Procedures by Care Setting, U.S., 2021 – 2031
|
Figure 4-37: Bare-Metal Fem-Popliteal Procedures by Care Setting, U.S., 2021 – 2031
|
Figure 4-38: Bare-Metal Infra-Popliteal Procedures by Care Setting, U.S., 2021 – 2031
|
Figure 4-39: Bare-Metal Stent Procedures by Delivery Method, U.S., 2021 – 2031
|
Figure 4-40: Covered Stent Procedures by Indication, U.S., 2021 – 2031
|
Figure 4-41: Drug-Eluting Stent Procedures by Indication, U.S., 2021 – 2031
|
Figure 4-42: Peripheral Venous Stent, U.S., 2021 – 2031
|
Figure 4-43: PTA Balloon Catheter Procedures by Segment, U.S., 2021 – 2031
|
Figure 4-44: Drug-Coated Balloon Procedures by Care Setting, U.S., 2021 – 2031
|
Figure 4-45: Drug-Coated Balloon Procedures by Indication, U.S., 2021 – 2031
|
Figure 4-46: Atherectomy Procedures by Device Type, U.S., 2021 – 2031
|
Figure 4-47: Atherectomy Procedures by Indication, U.S., 2021 – 2031 (1 of 2)
|
Figure 4-48: Atherectomy Procedures by Indication, U.S., 2021 – 2031 (2 of 2)
|
Figure 4-49: Fem-Popliteal Artery Atherectomy Procedures by Type, U.S., 2021 – 2031
|
Figure 4-50: Infra-Popliteal Artery Atherectomy Procedures by Type, U.S., 2021 – 2031
|
Figure 4-51: Atherectomy Procedures by Care Setting, U.S., 2021 – 2031
|
Figure 4-52: Intravascular Lithotripsy Procedures by Indication, U.S., 2021 – 2031
|
Figure 4-53: CTO Device Procedures by Type, U.S., 2021 – 2031
|
Figure 4-54: Surgical Graft Procedures by Graft Material, U.S., 2021 – 2031
|
Figure 4-55: Surgical Graft Procedures by Indication, U.S., 2021 – 2031
|
Figure 4-56: Lower Limb Surgical Graft Procedures by Anatomy, U.S., 2021 – 2031
|
Figure 4-57: Aorta Repair Surgical Graft Procedures by Anatomy, U.S., 2021 – 2031
|
Figure 4-58: Endovascular Stent Graft Procedures by Type, U.S., 2021 – 2031
|
Figure 4-59: EVAR Procedures by Anatomy, U.S., 2021 – 2031
|
Figure 4-60: EVAR Procedures by Device Type, U.S., 2021 – 2031
|
Figure 4-61: EVAR Procedures by Complexity, U.S., 2021 – 2031
|
Figure 4-62: EVAR Procedures by Fenestration, U.S., 2021 – 2031
|
Figure 4-63: EVAR Procedures by Anesthesia Type, U.S., 2021 – 2031
|
Figure 4-64: EVAR Procedures by Gender, U.S., 2021 – 2031
|
Figure 4-65: TEVAR Procedures by Indication, U.S., 2021 – 2031
|
Figure 4-66: TEVAR Procedures by Anesthesia Type, U.S., 2021 – 2031
|
Figure 4-67: TEVAR Procedures by Gender, U.S., 2021 – 2031
|
Figure 4-68: Embolic Protection Procedures by Type, U.S., 2021 – 2031
|
Figure 4-69: Peripheral Thrombus Management Procedures by Procedure Type, U.S., 2021 – 2031
|
Figure 4-70: Peripheral Thrombus Management Procedures by Indication, U.S., 2021 – 2031
|
Figure 4-71: Peripheral IVUS Procedures by Indication, U.S., 2021 – 2031
|
Figure 4-72: Peripheral IVUS Procedures by Care Setting, U.S., 2021 – 2031
|
Figure 5-1: Peripheral Vascular Stent Market by Segment, U.S., 2021 – 2031 (US$M)
|
Figure 5-2: Peripheral Arterial Stent Market by Segment, U.S., 2021 – 2031 (US$M)
|
Figure 5-3: Total Peripheral Arterial Stent Market, U.S., 2021 – 2031
|
Figure 5-4: Total Bare-Metal Peripheral Arterial Stent Market, U.S., 2021 – 2031
|
Figure 5-5: Bare-Metal Peripheral Arterial Stent Market by Indication, U.S., 2021 – 2031
|
Figure 5-6: Bare-Metal Carotid Stent Market, U.S., 2021 – 2031
|
Figure 5-7: Bare-Metal Iliac Stent Market, U.S., 2021 – 2031
|
Figure 5-8: Bare-Metal Renal Stent Market, U.S., 2021 – 2031
|
Figure 5-9: Bare-Metal Fem-Popliteal Stent Market, U.S., 2021 – 2031
|
Figure 5-10: Bare-Metal Infra-Popliteal Stent Market, U.S., 2021 – 2031
|
Figure 5-11: Bare-Metal Stent Market by Delivery Platform, U.S., 2021 – 2031
|
Figure 5-12: Self-Expanding Bare-Metal Stent Market, U.S., 2021 – 2031
|
Figure 5-13: Balloon Expanding Bare-Metal Stent Market, U.S., 2021 – 2031
|
Figure 5-14: Covered Stent Market by Segment, U.S., 2021 – 2031
|
Figure 5-15: Total Covered Stent Market, U.S., 2021 – 2031
|
Figure 5-16: Iliac Covered Stent Market, U.S., 2021 – 2031
|
Figure 5-17: Fem-Popliteal Covered Stent Market, U.S., 2021 – 2031
|
Figure 5-18: AV Access Covered Stent Market, U.S., 2021 – 2031
|
Figure 5-19: Drug-Eluting Stent Market by Segment, U.S., 2021 – 2031
|
Figure 5-20: Total Drug-Eluting Stent Market, U.S., 2021 – 2031
|
Figure 5-21: SFA Drug-Eluting Stent Market, U.S., 2021 – 2031
|
Figure 5-22: Infra-Popliteal Drug-Eluting Stent Market, U.S., 2021 – 2031
|
Figure 5-23: Venous Stent Market, U.S., 2021 – 2031
|
Figure 5-24: Units Sold by Stent Length, Bare-Metal Carotid Stent Market, U.S., 2021 – 2031
|
Figure 5-25: Units Sold by Stent Length, Bare-Metal Renal Stent Market, U.S., 2021 – 2031
|
Figure 5-26: Units Sold by Stent Length, Bare-Metal Iliac Stent Market, U.S., 2021 – 2031
|
Figure 5-27: Units Sold by Stent Length, Bare-Metal Fem-Popliteal Stent Market, U.S., 2021 – 2031
|
Figure 5-28: Leading Competitors, Peripheral Vascular Stent Market, U.S., 2024
|
Figure 5-29: Leading Competitors, Bare-Metal Peripheral Arterial Vascular Stent Market, U.S., 2024
|
Figure 5-30: Leading Competitors, Drug-Eluting Peripheral Vascular Stent Market, U.S., 2024
|
Figure 6-1: PTA Balloon Catheter Market by Segment, U.S., 2021 – 2031 (US$M)
|
Figure 6-2: Total PTA Balloon Catheter Market, U.S., 2021 – 2031
|
Figure 6-3: Standard PTA Balloon Catheter Market by Segment, U.S., 2021 – 2031 (US$M)
|
Figure 6-4: Total Standard PTA Balloon Catheter Market, U.S., 2021 – 2031
|
Figure 6-5: Hospital Standard PTA Balloon Catheter Market, U.S., 2021 – 2031
|
Figure 6-6: Office-Based Lab Standard PTA Balloon Catheter Market, U.S., 2021 – 2031
|
Figure 6-7: High-Pressure PTA Balloon Catheter Market by Segment, U.S., 2021 – 2031 (US$M)
|
Figure 6-8: Total High-Pressure PTA Balloon Catheter Market, U.S., 2021 – 2031
|
Figure 6-9: Hospital High-Pressure PTA Balloon Catheter Market, U.S., 2021 – 2031
|
Figure 6-10: Office-Based Lab High-Pressure PTA Balloon Catheter Market, U.S., 2021 – 2031
|
Figure 6-11: Large PTA Balloon Catheter Market by Segment, U.S., 2021 – 2031 (US$M)
|
Figure 6-12: Total Large PTA Balloon Catheter Market, U.S., 2021 – 2031
|
Figure 6-13: Hospital Large PTA Balloon Catheter Market, U.S., 2021 – 2031
|
Figure 6-14: Office-Based Lab Large PTA Balloon Catheter Market, U.S., 2021 – 2031
|
Figure 6-15: Total Small PTA Balloon Catheter Market, U.S., 2021 – 2031
|
Figure 6-16: 0.014” Small PTA Balloon Catheter Market, U.S., 2021 – 2031
|
Figure 6-17: 0.018” Small PTA Balloon Catheter Market, U.S., 2021 – 2031
|
Figure 6-18: Hospital Small PTA Balloon Catheter Market, U.S., 2021 – 2031
|
Figure 6-19: Office-Based Lab Small PTA Balloon Catheter Market, U.S., 2021 – 2031
|
Figure 6-20: Specialty PTA Balloon Catheter Market by Segment, U.S., 2021 – 2031 (US$M)
|
Figure 6-21: Total Specialty PTA Balloon Catheter Market, U.S., 2021 – 2031
|
Figure 6-22: Hospital Specialty PTA Balloon Catheter Market, U.S., 2021 – 2031
|
Figure 6-23: Office-Based Lab Specialty PTA Balloon Catheter Market, U.S., 2021 – 2031
|
Figure 6-24: Units Sold by Application, PTA Balloon Catheter Market, U.S., 2021 – 2031
|
Figure 6-25: Leading Competitors, PTA Balloon Catheter Market, U.S., 2024
|
Figure 7-1: Drug-Coated Balloon Market by Segment, U.S., 2021 – 2031 (US$M)
|
Figure 7-2: Total Drug-Coated Balloon Market, U.S., 2021 – 2031
|
Figure 7-3: SFA DCB Market, U.S., 2021 – 2031
|
Figure 7-4: AV Access DCB Market, U.S., 2021 – 2031
|
Figure 7-5: Units Sold by Care Setting, Drug-Coated Balloon Market, U.S., 2021 – 2031
|
Figure 7-6: Leading Competitors, Drug-Coated Balloon Market, U.S., 2024
|
Figure 8-1: Atherectomy Device Market by Segment, U.S., 2021 – 2031 (US$M)
|
Figure 8-2: Total Laser Atherectomy Device Market by Segment, U.S., 2021 – 2031 (US$M)
|
Figure 8-3: Laser Atherectomy Disposable Market, U.S., 2021 – 2031
|
Figure 8-4: Laser Atherectomy Console Market, U.S., 2021 – 2031 (1 of 2)
|
Figure 8-5: Laser Atherectomy Console Market, U.S., 2021 – 2031 (2 of 2)
|
Figure 8-6: Mechanical Atherectomy Disposable Market, U.S., 2021 – 2031
|
Figure 8-7: Atherectomy Disposable Market by Care Setting, U.S., 2021 – 2031 (US$M)
|
Figure 8-8: Hospital Atherectomy Disposable Market, U.S., 2021 – 2031
|
Figure 8-9: Office-Based Lab Atherectomy Disposable Market, U.S., 2021 – 2031
|
Figure 8-10: Leading Competitors, Atherectomy Device Market, U.S., 2024
|
Figure 9-1: Intravascular Lithotripsy Market by Care Setting, U.S., 2021 – 2031 (US$M)
|
Figure 9-2: Hospital Intravascular Lithotripsy Market, U.S., 2021 – 2031
|
Figure 9-3: Office-Based Lab Intravascular Lithotripsy Market, U.S., 2021 – 2031
|
Figure 9-4: Leading Competitors, Intravascular Lithotripsy Market, U.S., 2024
|
Figure 10-1: CTO Device Market by Segment, U.S., 2021 – 2031 (US$M)
|
Figure 10-2: Total CTO Device Market, U.S., 2021 – 2031
|
Figure 10-3: Re-Entry Device Market, U.S., 2021 – 2031
|
Figure 10-4: Re-Canalization Device Market, U.S., 2021 – 2031
|
Figure 10-5: Leading Competitors, CTO Device Market, U.S., 2024
|
Figure 11-1: Surgical Graft Market by Indication, U.S., 2021 – 2031 (US$M)
|
Figure 11-2: Surgical Graft Market by Material, U.S., 2021 – 2031 (US$M)
|
Figure 11-3: Total Surgical Graft Market, U.S., 2021 – 2031
|
Figure 11-4: Lower Limb Surgical Graft Market, U.S., 2021 – 2031 (US$M)
|
Figure 11-5: Total Lower Limb Surgical Graft Market, U.S., 2021 – 2031
|
Figure 11-6: Above-the-Knee Surgical Graft Market, U.S., 2021 – 2031
|
Figure 11-7: Below-the-Knee Surgical Graft Market, U.S., 2021 – 2031
|
Figure 11-8: Aorta Repair Surgical Graft Market by Segment, U.S., 2021 – 2031 (US$M)
|
Figure 11-9: Total Aorta Repair Surgical Graft Market, U.S., 2021 – 2031
|
Figure 11-10: Abdominal Aortic Aneurysm Surgical Graft Market, U.S., 2021 – 2031
|
Figure 11-11: Thoracic Aortic Aneurysm Surgical Graft Market, U.S., 2021 – 2031
|
Figure 11-12: Extra-Anatomical Bypass Surgical Graft Market, U.S., 2021 – 2031
|
Figure 11-13: Polyester Surgical Graft Market, U.S., 2021 – 2031
|
Figure 11-14: ePTFE Surgical Graft Market, U.S., 2021 – 2031
|
Figure 11-15: Leading Competitors, Surgical Graft Market, U.S., 2024
|
Figure 12-1: Stent Graft Market by Segment, U.S., 2021 – 2031 (US$M)
|
Figure 12-2: Total Stent Graft Market, U.S., 2021 – 2031
|
Figure 12-3: AAA Stent Graft Market by Segment, U.S., 2021 – 2031 (US$M)
|
Figure 12-4: Total AAA Stent Graft Market, U.S., 2021 – 2031
|
Figure 12-5: Bifurcated Main Body Graft Market, U.S., 2021 – 2031
|
Figure 12-6: Contralateral/Ipsilateral Iliac Leg/Limb Market, U.S., 2021 – 2031
|
Figure 12-7: Aorto-uni-iliac (AUI) Stent Graft Market, U.S., 2021 – 2031
|
Figure 12-8: Iliac Extension Market, U.S., 2021 – 2031
|
Figure 12-9: Aortic Extension Market, U.S., 2021 – 2031
|
Figure 12-10: FAA Stent Graft Market by Segment, U.S., 2021 – 2031 (US$M)
|
Figure 12-11: Total FAA Stent Graft Market, U.S., 2021 – 2031
|
Figure 12-12: Fenestrated Distal Bifurcated Graft Market, U.S., 2021 – 2031
|
Figure 12-13: Fenestrated Proximal Body Graft Market, U.S., 2021 – 2031
|
Figure 12-14: TAA Stent Graft Market, U.S., 2021 – 2031
|
Figure 12-15: Leading Competitors, Stent Graft Market, U.S., 2024
|
Figure 12-16: Leading Competitors, AAA Stent Graft Market, U.S., 2024
|
Figure 13-1: Embolic Protection Device Market by Segment, U.S., 2021 – 2031 (US$M)
|
Figure 13-2: Total Embolic Protection Device Market, U.S., 2021 – 2031
|
Figure 13-3: Carotid EPD Market, U.S., 2021 – 2031
|
Figure 13-4: Alternative EPD Market by Segment, U.S., 2021 – 2031 (US$M)
|
Figure 13-5: Total Alternative EPD Market, U.S., 2021 – 2031
|
Figure 13-6: Renal EPD Market, U.S., 2021 – 2031
|
Figure 13-7: Lower Limb EPD Market, U.S., 2021 – 2031
|
Figure 13-8: Leading Competitors, Embolic Protection Device Market, U.S., 2024
|
Figure 14-1: Peripheral Thrombus Management Market Overview by Device Type, U.S., 2021 – 2031 (US$M)
|
Figure 14-2: Peripheral Thrombus Management Market Overview by Indication, U.S., 2021 – 2031 (US$M)
|
Figure 14-3: Total Peripheral Thrombus Management Market, U.S., 2021 – 2031
|
Figure 14-4: Traditional Thrombectomy Market, U.S., 2021 – 2031
|
Figure 14-5: Pharmacomechanical Thrombectomy Market, U.S., 2021 – 2031
|
Figure 14-6: Catheter Directed Thrombolysis Market, U.S., 2021 – 2031
|
Figure 14-7: AV Access Thrombectomy Device Market, U.S., 2021 – 2031
|
Figure 14-8: Arterial Thrombectomy Device Market, U.S., 2021 – 2031
|
Figure 14-9: Venous Thrombectomy Device Market, U.S., 2021 – 2031
|
Figure 14-10: Leading Competitors, Peripheral Thrombus Management Market, U.S., 2024
|
Figure 15-1: Peripheral IVUS Catheter Market, U.S., 2021 – 2031
|
Figure 15-2: Leading Competitors, Peripheral IVUS Catheter Market, U.S., 2024
|