| Figure 5‑1: Clear Aligner Procedure Segmentation |
| Figure 5‑2: Clear Aligner Market Segmentation |
| Figure 5‑3: Clear Aligner Regions Covered, Global |
| Figure 5‑4: Patients with Clear Aligners, Global, 2021 – 2031 |
| Figure 5‑5: Patient with Clear Aligners by Country, Global, 2021 – 2031 (1 of 2) |
| Figure 5‑6: Patient with Clear Aligners by Country, Global, 2021 – 2031 (2 of 2) |
| Figure 5‑7: Patients with Clear Aligners with Age Below 18 Years Old, Global, 2021 – 2031 (1 of 2) |
| Figure 5‑8: Patients with Clear Aligners with Age Below 18 Years Old, Global, 2021 – 2031 (2 of 2) |
| Figure 5‑9: Patients with Clear Aligners with Age 18 to 35 Years Old, Global, 2021 – 2031 (1 of 2) |
| Figure 5‑10: Patients with Clear Aligners with Age 18 to 35 Years Old, Global, 2021 – 2031 (2 of 2) |
| Figure 5‑11: Patients with Clear Aligners with Age More than 35 Years Old, Global, 2021 – 2031 (1 of 2) |
| Figure 5‑12: Patients with Clear Aligners with Age More than 35 Years Old, Global, 2021 – 2031 (2 of 2) |
| Figure 5‑13: Patients with Clear Aligners with Age More than 55 Years Old, Global, 2021 – 2031 (1 of 2) |
| Figure 5‑14: Patients with Clear Aligners with Age More than 55 Years Old, Global, 2021 – 2031 (2 of 2) |
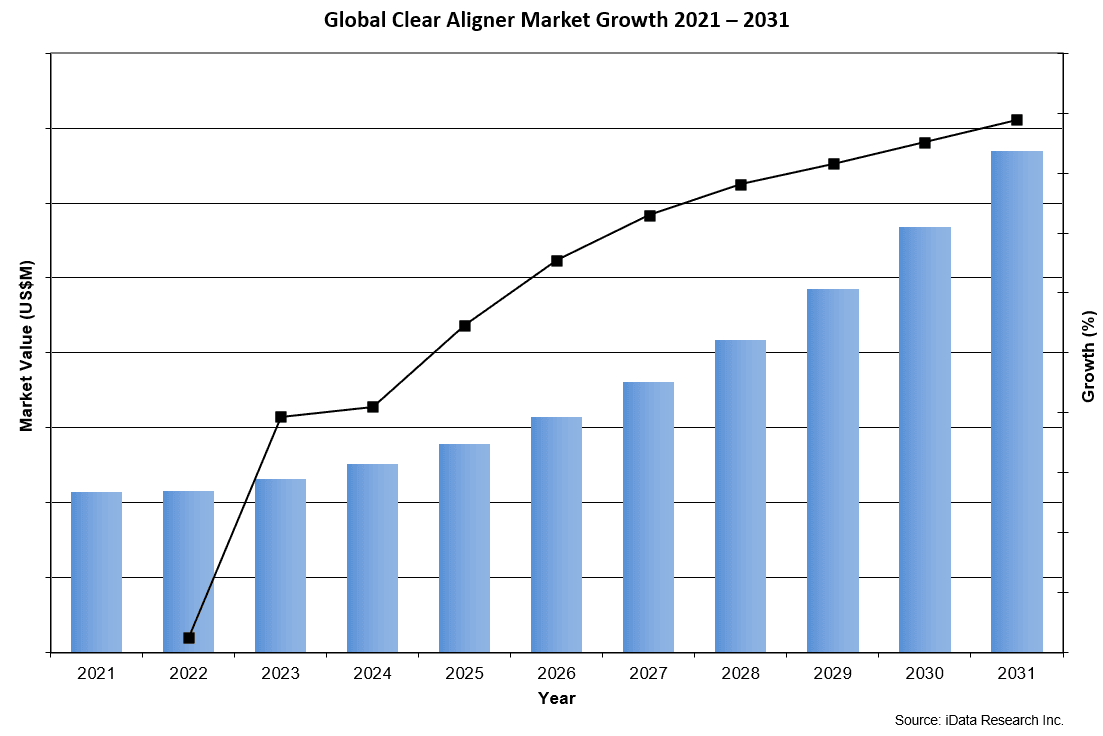
| Figure 5‑15: Clear Aligner Market, Global, 2021 – 2031 |
| Figure 5‑16: Units Sold by Region, Clear Aligner Market, Global, 2021 – 2031 (1 of 2) |
| Figure 5‑17: Units Sold by Region, Clear Aligner Market, Global, 2021 – 2031 (2 of 2) |
| Figure 5‑18: Average Selling Price by Region, Clear Aligner Market, Global, 2021 – 2031 (US$) (1 of 2) |
| Figure 5‑19: Average Selling Price by Region, Clear Aligner Market, Global, 2021 – 2031 (US$) (2 of 2) |
| Figure 5‑20: Market Value by Country, Clear Aligner Market, Global, 2021 – 2031 (US$M) (1 of 2) |
| Figure 5‑21: Market Value by Country, Clear Aligner Market, Global, 2021 – 2031 (US$M) (2 of 2) |
| Figure 5‑22: Clear Aligner Market by Market Type, Global, 2021 – 2031 (US$M) |
| Figure 5‑23: Professional Clear Aligner Market, Global, 2021 – 2031 |
| Figure 5‑24: Units Sold by Country, Professional Clear Aligner Market, Global, 2021 – 2031 (1 of 2) |
| Figure 5‑25: Units Sold by Country, Professional Clear Aligner Market, Global, 2021 – 2031 (2 of 2) |
| Figure 5‑26: Average Selling Price by Country, Professional Clear Aligner Market, Global, 2021 – 2031 (US$) (1 of 2) |
| Figure 5‑27: Average Selling Price by Country, Professional Clear Aligner Market, Global, 2021 – 2031 (US$) (2 of 2) |
| Figure 5‑28: Market Value by Country, Professional Clear Aligner Market, Global, 2021 – 2031 (US$M) (1 of 2) |
| Figure 5‑29: Market Value by Country, Professional Clear Aligner Market, Global, 2021 – 2031 (US$M) (2 of 2) |
| Figure 5‑30: Professional Clear Aligner Market by Type, Global, 2021 – 2031 |
| Figure 5‑31: Orthodontist Professional Clear Aligner Market, Global, 2021 – 2031 |
| Figure 5‑32: Units Sold by Country, Orthodontist Professional Clear Aligner Market, Global, 2021 – 2031 (1 of 2) |
| Figure 5‑33: Units Sold by Country, Orthodontist Professional Clear Aligner Market, Global, 2021 – 2031 (2 of 2) |
| Figure 5‑34: Average Selling Price by Country, Orthodontist Professional Clear Aligner Market, Global, 2021 – 2031 (US$) (1 of 2) |
| Figure 5‑35: Average Selling Price by Country, Orthodontist Professional Clear Aligner Market, Global, 2021 – 2031 (US$) (2 of 2) |
| Figure 5‑36: Market Value by Country, Orthodontist Professional Clear Aligner Market, Global, 2021 – 2031 (US$M) (1 of 2) |
| Figure 5‑37: Market Value by Country, Orthodontist Professional Clear Aligner Market, Global, 2021 – 2031 (US$M) (2 of 2) |
| Figure 5‑38: Dentist Professional Clear Aligner Market, Global, 2021 – 2031 |
| Figure 5‑39: Units Sold by Country, Dentist Professional Clear Aligner Market, Global, 2021 – 2031 (1 of 2) |
| Figure 5‑40: Units Sold by Country, Dentist Professional Clear Aligner Market, Global, 2021 – 2031 (2 of 2) |
| Figure 5‑41: Average Selling Price by Country, Dentist Professional Clear Aligner Market, Global, 2021 – 2031 (US$) (1 of 2) |
| Figure 5‑42: Average Selling Price by Country, Dentist Professional Clear Aligner Market, Global, 2021 – 2031 (US$) (2 of 2) |
| Figure 5‑43: Market Value by Country, Dentist Professional Clear Aligner Market, Global, 2021 – 2031 (US$M) (1 of 2) |
| Figure 5‑44: Market Value by Country, Dentist Professional Clear Aligner Market, Global, 2021 – 2031 (US$M) (2 of 2) |
| Figure 5‑45: Professional Clear Aligner Market by Tier, Global, 2021 – 2031 |
| Figure 5‑46: Professional Simple Clear Aligner Market, Global, 2021 – 2031 |
| Figure 5‑47: Units Sold by Country, Professional Simple Clear Aligner Market, Global, 2021 – 2031 (1 of 2) |
| Figure 5‑48: Units Sold by Country, Professional Simple Clear Aligner Market, Global, 2021 – 2031 (2 of 2) |
| Figure 5‑49: Average Selling Price by Country, Professional Simple Clear Aligner Market, Global, 2021 – 2031 (US$) (1 of 2) |
| Figure 5‑50: Average Selling Price by Country, Professional Simple Clear Aligner Market, Global, 2021 – 2031 (US$) (2 of 2) |
| Figure 5‑51: Market Value by Country, Professional Simple Clear Aligner Market, Global, 2021 – 2031 (US$M) (1 of 2) |
| Figure 5‑52: Market Value by Country, Professional Simple Clear Aligner Market, Global, 2021 – 2031 (US$M) (2 of 2) |
| Figure 5‑53: Professional Moderate Clear Aligner Market, Global, 2021 – 2031 |
| Figure 5‑54: Units Sold by Country, Professional Moderate Clear Aligner Market, Global, 2021 – 2031 (1 of 2) |
| Figure 5‑55: Units Sold by Country, Professional Moderate Clear Aligner Market, Global, 2021 – 2031 (2 of 2) |
| Figure 5‑56: Average Selling Price by Country, Professional Moderate Clear Aligner Market, Global, 2021 – 2031 (US$) (1 of 2) |
| Figure 5‑57: Average Selling Price by Country, Professional Moderate Clear Aligner Market, Global, 2021 – 2031 (US$) (2 of 2) |
| Figure 5‑58: Market Value by Country, Professional Moderate Clear Aligner Market, Global, 2021 – 2031 (US$M) (1 of 2) |
| Figure 5‑59: Market Value by Country, Professional Moderate Clear Aligner Market, Global, 2021 – 2031 (US$M) (2 of 2) |
| Figure 5‑60: Complex Clear Aligner Market, Global, 2021 – 2031 |
| Figure 5‑61: Units Sold by Country, Complex Clear Aligner Market, Global, 2021 – 2031 (1 of 2) |
| Figure 5‑62: Units Sold by Country, Complex Clear Aligner Market, Global, 2021 – 2031 (2 of 2) |
| Figure 5‑63: Average Selling Price by Country, Complex Clear Aligner Market, Global, 2021 – 2031 (US$) (1 of 2) |
| Figure 5‑64: Average Selling Price by Country, Complex Clear Aligner Market, Global, 2021 – 2031 (US$) (2 of 2) |
| Figure 5‑65: Market Value by Country, Complex Clear Aligner Market, Global, 2021 – 2031 (US$M) (1 of 2) |
| Figure 5‑66: Market Value by Country, Complex Clear Aligner Market, Global, 2021 – 2031 (US$M) (2 of 2) |
| Figure 5‑67: Direct-to-Consumer Clear Aligner Market, Global, 2021 – 2031 |
| Figure 5‑68: Units Sold by Country, Direct-to-Consumer Clear Aligner Market, Global, 2021 – 2031 (1 of 2) |
| Figure 5‑69: Units Sold by Country, Direct-to-Consumer Clear Aligner Market, Global, 2021 – 2031 (2 of 2) |
| Figure 5‑70: Average Selling Price by Country, Direct-to-Consumer Clear Aligner Market, Global, 2021 – 2031 (US$) (1 of 2) |
| Figure 5‑71: Average Selling Price by Country, Direct-to-Consumer Clear Aligner Market, Global, 2021 – 2031 (US$) (2 of 2) |
| Figure 5‑72: Market Value by Country, Direct-to-Consumer Clear Aligner Market, Global, 2021 – 2031 (US$M) (1 of 2) |
| Figure 5‑73: Market Value by Country, Direct-to-Consumer Clear Aligner Market, Global, 2021 – 2031 (US$M) (2 of 2) |
| Figure 5‑74: Clear Aligner Market by Device Type, Global, 2021 – 2031 (US$M) |
| Figure 5‑75: Digital Submission Clear Aligner Market, Global, 2021 – 2031 |
| Figure 5‑76: Units Sold by Country, Digital Submission Clear Aligner Market, Global, 2021 – 2031 (1 of 2) |
| Figure 5‑77: Units Sold by Country, Digital Submission Clear Aligner Market, Global, 2021 – 2031 (2 of 2) |
| Figure 5‑78: Average Selling Price by Country, Digital Submission Clear Aligner Market, Global, 2021 – 2031 (US$) (1 of 2) |
| Figure 5‑79: Average Selling Price by Country, Digital Submission Clear Aligner Market, Global, 2021 – 2031 (US$) (2 of 2) |
| Figure 5‑80: Market Value by Country, Digital Submission Clear Aligner Market, Global, 2021 – 2031 (US$M) (1 of 2) |
| Figure 5‑81: Market Value by Country, Digital Submission Clear Aligner Market, Global, 2021 – 2031 (US$M) (2 of 2) |
| Figure 5‑82: Impression Clear Aligner Market, Global, 2021 – 2031 |
| Figure 5‑83: Units Sold by Country, Impression Clear Aligner Market, Global, 2021 – 2031 (1 of 2) |
| Figure 5‑84: Units Sold by Country, Impression Clear Aligner Market, Global, 2021 – 2031 (2 of 2) |
| Figure 5‑85: Average Selling Price by Country, Impression Clear Aligner Market, Global, 2021 – 2031 (US$) (1 of 2) |
| Figure 5‑86: Average Selling Price by Country, Impression Clear Aligner Market, Global, 2021 – 2031 (US$) (2 of 2) |
| Figure 5‑87: Market Value by Country, Impression Clear Aligner Market, Global, 2021 – 2031 (US$M) (1 of 2) |
| Figure 5‑88: Market Value by Country, Impression Clear Aligner Market, Global, 2021 – 2031 (US$M) (2 of 2) |
| Figure 5‑89: Clear Aligner Market by Tier, Global, 2021 – 2031 (US$M) |
| Figure 5‑90: Simple Clear Aligner Market by Market Type, Global, 2021 – 2031 (US$M) |
| Figure 5‑91: Simple Clear Aligner Market, Global, 2021 – 2031 |
| Figure 5‑92: Units Sold by Country, Simple Clear Aligner Market, Global, 2021 – 2031 (1 of 2) |
| Figure 5‑93: Units Sold by Country, Simple Clear Aligner Market, Global, 2021 – 2031 (2 of 2) |
| Figure 5‑94: Average Selling Price by Country, Simple Clear Aligner Market, Global, 2021 – 2031 (US$) (1 of 2) |
| Figure 5‑95: Average Selling Price by Country, Simple Clear Aligner Market, Global, 2021 – 2031 (US$) (2 of 2) |
| Figure 5‑96: Market Value by Country, Simple Clear Aligner Market, Global, 2021 – 2031 (US$M) (1 of 2) |
| Figure 5‑97: Market Value by Country, Simple Clear Aligner Market, Global, 2021 – 2031 (US$M) (2 of 2) |
| Figure 5‑98: Professional Simple Clear Aligner Market, Global, 2021 – 2031 |
| Figure 5‑99: Units Sold by Country, Professional Simple Clear Aligner Market, Global, 2021 – 2031 (1 of 2) |
| Figure 5‑100: Units Sold by Country, Professional Simple Clear Aligner Market, Global, 2021 – 2031 (2 of 2) |
| Figure 5‑101: Average Selling Price by Country, Professional Simple Clear Aligner Market, Global, 2021 – 2031 (US$) (1 of 2) |
| Figure 5‑102: Average Selling Price by Country, Professional Simple Clear Aligner Market, Global, 2021 – 2031 (US$) (2 of 2) |
| Figure 5‑103: Market Value by Country, Professional Simple Clear Aligner Market, Global, 2021 – 2031 (US$M) (1 of 2) |
| Figure 5‑104: Market Value by Country, Professional Simple Clear Aligner Market, Global, 2021 – 2031 (US$M) (2 of 2) |
| Figure 5‑105: DTC Simple Clear Aligner Market, Global, 2021 – 2031 |
| Figure 5‑106: Units Sold by Country, DTC Simple Clear Aligner Market, Global, 2021 – 2031 (1 of 2) |
| Figure 5‑107: Units Sold by Country, DTC Simple Clear Aligner Market, Global, 2021 – 2031 (2 of 2) |
| Figure 5‑108: Average Selling Price by Country, DTC Simple Clear Aligner Market, Global, 2021 – 2031 (US$) (1 of 2) |
| Figure 5‑109: Average Selling Price by Country, DTC Simple Clear Aligner Market, Global, 2021 – 2031 (US$) (2 of 2) |
| Figure 5‑110: Market Value by Country, DTC Simple Clear Aligner Market, Global, 2021 – 2031 (US$M) (1 of 2) |
| Figure 5‑111: Market Value by Country, DTC Simple Clear Aligner Market, Global, 2021 – 2031 (US$M) (2 of 2) |
| Figure 5‑112: Moderate Clear Aligner Market by Market Type, Global, 2021 – 2031 (US$M) |
| Figure 5‑113: Moderate Clear Aligner Market, Global, 2021 – 2031 |
| Figure 5‑114: Units Sold by Country, Moderate Clear Aligner Market, Global, 2021 – 2031 (1 of 2) |
| Figure 5‑115: Units Sold by Country, Moderate Clear Aligner Market, Global, 2021 – 2031 (2 of 2) |
| Figure 5‑116: Average Selling Price by Country, Moderate Clear Aligner Market, Global, 2021 – 2031 (US$) (1 of 2) |
| Figure 5‑117: Average Selling Price by Country, Moderate Clear Aligner Market, Global, 2021 – 2031 (US$) (2 of 2) |
| Figure 5‑118: Market Value by Country, Moderate Clear Aligner Market, Global, 2021 – 2031 (US$M) (1 of 2) |
| Figure 5‑119: Market Value by Country, Moderate Clear Aligner Market, Global, 2021 – 2031 (US$M) (2 of 2) |
| Figure 5‑120: Professional Moderate Clear Aligner Market, Global, 2021 – 2031 |
| Figure 5‑121: Units Sold by Country, Professional Moderate Clear Aligner Market, Global, 2021 – 2031 (1 of 2) |
| Figure 5‑122: Units Sold by Country, Professional Moderate Clear Aligner Market, Global, 2021 – 2031 (2 of 2) |
| Figure 5‑123: Average Selling Price by Country, Professional Moderate Clear Aligner Market, Global, 2021 – 2031 (US$) (1 of 2) |
| Figure 5‑124: Average Selling Price by Country, Professional Moderate Clear Aligner Market, Global, 2021 – 2031 (US$) (2 of 2) |
| Figure 5‑125: Market Value by Country, Professional Moderate Clear Aligner Market, Global, 2021 – 2031 (US$M) (1 of 2) |
| Figure 5‑126: Market Value by Country, Professional Moderate Clear Aligner Market, Global, 2021 – 2031 (US$M) (2 of 2) |
| Figure 5‑127: DTC Moderate Clear Aligner Market, Global, 2021 – 2031 |
| Figure 5‑128: Units Sold by Country, DTC Moderate Clear Aligner Market, Global, 2021 – 2031 (1 of 2) |
| Figure 5‑129: Units Sold by Country, DTC Moderate Clear Aligner Market, Global, 2021 – 2031 (2 of 2) |
| Figure 5‑130: Average Selling Price by Country, DTC Moderate Clear Aligner Market, Global, 2021 – 2031 (US$) (1 of 2) |
| Figure 5‑131: Average Selling Price by Country, DTC Moderate Clear Aligner Market, Global, 2021 – 2031 (US$) (2 of 2) |
| Figure 5‑132: Market Value by Country, DTC Moderate Clear Aligner Market, Global, 2021 – 2031 (US$M) (1 of 2) |
| Figure 5‑133: Market Value by Country, DTC Moderate Clear Aligner Market, Global, 2021 – 2031 (US$M) (2 of 2) |
| Figure 5‑134: Complex Clear Aligner Market, Global, 2021 – 2031 |
| Figure 5‑135: Units Sold by Country, Complex Clear Aligner Market, Global, 2021 – 2031 (1 of 2) |
| Figure 5‑136: Units Sold by Country, Complex Clear Aligner Market, Global, 2021 – 2031 (2 of 2) |
| Figure 5‑137: Average Selling Price by Country, Complex Clear Aligner Market, Global, 2021 – 2031 (US$) (1 of 2) |
| Figure 5‑138: Average Selling Price by Country, Complex Clear Aligner Market, Global, 2021 – 2031 (US$) (2 of 2) |
| Figure 5‑139: Market Value by Country, Complex Clear Aligner Market, Global, 2021 – 2031 (US$M) (1 of 2) |
| Figure 5‑140: Market Value by Country, Complex Clear Aligner Market, Global, 2021 – 2031 (US$M) (2 of 2) |
| Figure 5‑141: Clear Aligner Market by Setting, Global, 2021 – 2031 (US$M) |
| Figure 5‑142: Private Practice Clear Aligner Market, Global, 2021 – 2031 |
| Figure 5‑143: Units Sold by Country, Private Practice Clear Aligner Market, Global, 2021 – 2031 (1 of 2) |
| Figure 5‑144: Units Sold by Country, Private Practice Clear Aligner Market, Global, 2021 – 2031 (2 of 2) |
| Figure 5‑145: Average Selling Price by Country, Private Practice Clear Aligner Market, Global, 2021 – 2031 (US$) (1 of 2) |
| Figure 5‑146: Average Selling Price by Country, Private Practice Clear Aligner Market, Global, 2021 – 2031 (US$) (2 of 2) |
| Figure 5‑147: Market Value by Country, Private Practice Clear Aligner Market, Global, 2021 – 2031 (US$M) (1 of 2) |
| Figure 5‑148: Market Value by Country, Private Practice Clear Aligner Market, Global, 2021 – 2031 (US$M) (2 of 2) |
| Figure 5‑149: Dental Clinic Clear Aligner Market, Global, 2021 – 2031 |
| Figure 5‑150: Units Sold by Country, Dental Clinic Clear Aligner Market, Global, 2021 – 2031 (1 of 2) |
| Figure 5‑151: Units Sold by Country, Dental Clinic Clear Aligner Market, Global, 2021 – 2031 (2 of 2) |
| Figure 5‑152: Average Selling Price by Country, Dental Clinic Clear Aligner Market, Global, 2021 – 2031 (US$) (1 of 2) |
| Figure 5‑153: Average Selling Price by Country, Dental Clinic Clear Aligner Market, Global, 2021 – 2031 (US$) (2 of 2) |
| Figure 5‑154: Market Value by Country, Dental Clinic Clear Aligner Market, Global, 2021 – 2031 (US$M) (1 of 2) |
| Figure 5‑155: Market Value by Country, Dental Clinic Clear Aligner Market, Global, 2021 – 2031 (US$M) (2 of 2) |
| Figure 5‑156: Dental Service Organization Clear Aligner Market, Global, 2021 – 2031 |
| Figure 5‑157: Units Sold by Country, Dental Service Organization Clear Aligner Market, Global, 2021 – 2031 (1 of 2) |
| Figure 5‑158: Units Sold by Country, Dental Service Organization Clear Aligner Market, Global, 2021 – 2031 (2 of 2) |
| Figure 5‑159: Average Selling Price by Country, Dental Service Organization Clear Aligner Market, Global, 2021 – 2031 (US$) (1 of 2) |
| Figure 5‑160: Average Selling Price by Country, Dental Service Organization Clear Aligner Market, Global, 2021 – 2031 (US$) (2 of 2) |
| Figure 5‑161: Market Value by Country, Dental Service Organization Clear Aligner Market, Global, 2021 – 2031 (US$M) (1 of 2) |
| Figure 5‑162: Market Value by Country, Dental Service Organization Clear Aligner Market, Global, 2021 – 2031 (US$M) (2 of 2) |
| Figure 5‑163: Hospital Clear Aligner Market, Global, 2021 – 2031 |
| Figure 5‑164: Units Sold by Country, Hospital Clear Aligner Market, Global, 2021 – 2031 (1 of 2) |
| Figure 5‑165: Units Sold by Country, Hospital Clear Aligner Market, Global, 2021 – 2031 (2 of 2) |
| Figure 5‑166: Average Selling Price by Country, Hospital Clear Aligner Market, Global, 2021 – 2031 (US$) (1 of 2) |
| Figure 5‑167: Average Selling Price by Country, Hospital Clear Aligner Market, Global, 2021 – 2031 (US$) (2 of 2) |
| Figure 5‑168: Market Value by Country, Hospital Clear Aligner Market, Global, 2021 – 2031 (US$M) (1 of 2) |
| Figure 5‑169: Market Value by Country, Hospital Clear Aligner Market, Global, 2021 – 2031 (US$M) (2 of 2) |
| Figure 5‑170: Direct-to-Consumer Clear Aligner Market, Global, 2021 – 2031 |
| Figure 5‑171: Units Sold by Country, Direct-to-Consumer Clear Aligner Market, Global, 2021 – 2031 (1 of 2) |
| Figure 5‑172: Units Sold by Country, Direct-to-Consumer Clear Aligner Market, Global, 2021 – 2031 (2 of 2) |
| Figure 5‑173: Average Selling Price by Country, Direct-to-Consumer Clear Aligner Market, Global, 2021 – 2031 (US$) (1 of 2) |
| Figure 5‑174: Average Selling Price by Country, Direct-to-Consumer Clear Aligner Market, Global, 2021 – 2031 (US$) (2 of 2) |
| Figure 5‑175: Market Value by Country, Direct-to-Consumer Clear Aligner Market, Global, 2021 – 2031 (US$M) (1 of 2) |
| Figure 5‑176: Market Value by Country, Direct-to-Consumer Clear Aligner Market, Global, 2021 – 2031 (US$M) (2 of 2) |
| Figure 5‑177: Clear Aligner Market by Material Type, Global, 2021 – 2031 (US$M) |
| Figure 5‑178: Thermoforming Polymer and Polymer Blend Clear Aligner Market, Global, 2021 – 2031 |
| Figure 5‑179: Units Sold by Country, Thermoforming Polymer and Polymer Blend Clear Aligner Market, Global, 2021 – 2031 (1 of 2) |
| Figure 5‑180: Units Sold by Country, Thermoforming Polymer and Polymer Blend Clear Aligner Market, Global, 2021 – 2031 (2 of 2) |
| Figure 5‑181: Average Selling Price by Country, Thermoforming Polymer and Polymer Blend Clear Aligner Market, Global, 2021 – 2031 (US$) (1 of 2) |
| Figure 5‑182: Average Selling Price by Country, Thermoforming Polymer and Polymer Blend Clear Aligner Market, Global, 2021 – 2031 (US$) (2 of 2) |
| Figure 5‑183: Market Value by Country, Thermoforming Polymer and Polymer Blend Clear Aligner Market, Global, 2021 – 2031 (US$M) (1 of 2) |
| Figure 5‑184: Market Value by Country, Thermoforming Polymer and Polymer Blend Clear Aligner Market, Global, 2021 – 2031 (US$M) (2 of 2) |
| Figure 5‑185: 3D-Printed Clear Aligner Market, Global, 2021 – 2031 |
| Figure 5‑186: Units Sold by Country, 3D-Printed Clear Aligner Market, Global, 2021 – 2031 (1 of 2) |
| Figure 5‑187: Units Sold by Country, 3D-Printed Clear Aligner Market, Global, 2021 – 2031 (2 of 2) |
| Figure 5‑188: Average Selling Price by Country, 3D-Printed Clear Aligner Market, Global, 2021 – 2031 (US$) (1 of 2) |
| Figure 5‑189: Average Selling Price by Country, 3D-Printed Clear Aligner Market, Global, 2021 – 2031 (US$) (2 of 2) |
| Figure 5‑190: Market Value by Country, 3D-Printed Clear Aligner Market, Global, 2021 – 2031 (US$M) (1 of 2) |
| Figure 5‑191: Market Value by Country, 3D-Printed Clear Aligner Market, Global, 2021 – 2031 (US$M) (2 of 2) |
| Figure 5‑192: Leading Competitors, Clear Aligner Market, Global, 2024 (1 of 3) |
| Figure 5‑193: Leading Competitors, Clear Aligner Market, Global, 2024 (2 of 3) |
| Figure 5‑194: Leading Competitors, Clear Aligner Market, Global, 2024 (3 of 3) |