| List of Figures |
| Figure 1‑1: Infusion Therapy Device Market Share Ranking by Segment, U.S., 2022 |
5 |
| Figure 1‑2: Companies Researched in This Report |
6 |
| Figure 1‑3: Factors Impacting the Infusion Therapy Device Market by Segment, U.S. |
7 |
| Figure 1‑4: Recent Events in the Infusion Therapy Device Market, U.S., 2019 – 2023 |
8 |
| Figure 1‑5: Infusion Therapy Device Markets Covered (1 of 5) |
9 |
| Figure 1‑6: Infusion Therapy Device Markets Covered (2 of 5) |
10 |
| Figure 1‑7: Infusion Therapy Device Markets Covered (3 of 5) |
11 |
| Figure 1‑8: Infusion Therapy Device Markets Covered (4 of 5) |
12 |
| Figure 1‑9: Infusion Therapy Device Markets Covered (5 of 5) |
13 |
| Figure 1‑10: Key Report Updates |
14 |
| Figure 1‑11: Version History |
15 |
| Figure 2‑1: Infusion Therapy Device Market by Segment, Worst Case Scenario, U.S., 2019 – 2029 (US$M) |
32 |
| Figure 2‑2: Infusion Therapy Device Market by Segment, Base Case Scenario, U.S., 2019 – 2029 (US$M) |
33 |
| Figure 2‑3: Infusion Therapy Device Market by Segment, Best Case Scenario, U.S., 2019 – 2029 (US$M) |
34 |
| Figure 4‑1: Large-Volume Infusion Pumps by Company |
51 |
| Figure 4‑2: Intravenous Sets by Company (1 of 2) |
53 |
| Figure 4‑3: Intravenous Sets by Company (2 of 2) |
54 |
| Figure 4‑4: Needleless Connectors by Company |
57 |
| Figure 4‑5: Stopcocks by Company |
59 |
| Figure 4‑6: Intravenous Filters by Company |
60 |
| Figure 4‑7: Blood Transfusion Sets by Company |
61 |
| Figure 4‑8: Class 1 Device Recall Baxter Spectrum IQ |
62 |
| Figure 4‑9: Class 1 Device Recall Baxter SIGMA Spectrum |
62 |
| Figure 4‑10: Class 1 Device Recall Spectrum IQ Infusion System with Dose IQ Safety Software |
62 |
| Figure 4‑11: Class 2 Device Recall Spectrum IQInfusion Pump |
63 |
| Figure 4‑12: Class 2 Device Recall SIGMA Spectrum Infusion Pump |
63 |
| Figure 4‑13: Class 1 Device Recall Spectrum IQ |
63 |
| Figure 4‑14: Class 1 Device Recall Baxter SIGMA Spectrum Infusion Pump |
63 |
| Figure 4‑15: Class 2 Device Recall Baxter SIGMA Spectrum Infusion Pump |
64 |
| Figure 4‑16: Class 2 Device Recall B. Braun |
64 |
| Figure 4‑17: Class 2 Device Recall Infusomat Space Volumetric Pump Administration Set |
64 |
| Figure 4‑18: Class 1 Device Recall Infusomat Space Volumetric Infusion Pump Administration Set |
65 |
| Figure 4‑19: Class 2 Device Recall Alaris PC Unit |
65 |
| Figure 4‑20: Class 1 Device Recall Alaris Infusion Pump Module |
65 |
| Figure 4‑21: Class 1 Device Recall Alaris Pump Module |
65 |
| Figure 4‑22: Class 1 Device Recall Alaris Pump Module |
66 |
| Figure 4‑23: Class 1 Device Recall Alaris Pump |
66 |
| Figure 4‑24: Class 1 Device Recall BD Alaris Pump Module |
66 |
| Figure 4‑25: Class 1 Device Recall BD Alaris System PC Unit |
67 |
| Figure 4‑26: Class 1 Device Recall Alaris System PC Unit |
67 |
| Figure 4‑27: Class 1 Device Recall Alaris Infusion Pump System |
67 |
| Figure 4‑28: Class 2 Device Recall BD Alaris" System |
67 |
| Figure 4‑29: Class 2 Device Recall Alaris Pump Module |
68 |
| Figure 4‑30: Class 2 Device Recall Alaris Syringe Module |
68 |
| Figure 4‑31: Class 2 Device Recall Alaris PCA Module |
68 |
| Figure 4‑32: Class 1 Device Recall CareFusion Alaris Pump |
69 |
| Figure 4‑33: Class 2 Device Recall Plum 360 Infusion System with MedNet/Smart Card Plug n Play Module |
69 |
| Figure 4‑34: Class 1 Device Recall Medfusion Model 4000 Pump |
69 |
| Figure 4‑35: Class 2 Device Recall Medfusion Model 4000 Syringe Infusion Pump |
70 |
| Figure 4‑36: Class 2 Device Recall Clearlink System ContinuFlo Administration Sets |
71 |
| Figure 4‑37: Class 2 Device Recall Infusomat Space Volumetric Pump Administration Set |
71 |
| Figure 4‑38: Class 1 Device Recall Infusomat Space Volumetric Infusion Pump Administration Set |
71 |
| Figure 4‑39: Class 2 Device Recall BD Extension Set SMALLBORE Tubing with 2 SmartSite VALVES |
72 |
| Figure 4‑40: Class 2 Device Recall BD SmartSite 'Y' Extension Set 2 NeedleFree Valves |
72 |
| Figure 4‑41: Class 2 Device Recall BD Extension Set SMALLBORE Tubing SmartSite VALVE |
72 |
| Figure 4‑42: Class 2 Device Recall BD Gravity IV Set 3port Closed Manifold Back Check Valve 3 NeedleFree Ysites |
73 |
| Figure 4‑43: Class 2 Device Recall MaxPlus Bi Fuse Extension Set with 2 Clear Needleless Connectors |
73 |
| Figure 4‑44: Class 2 Device Recall BD Alaris PCEA Administration Set |
73 |
| Figure 4‑45: Class 2 Device Recall MaxZero |
74 |
| Figure 4‑46: Class 1 Device Recall SmartSite Syringe Administration Set |
74 |
| Figure 4‑47: Class 2 Device Recall Plum 360 Infusion System |
74 |
| Figure 4‑48: Class 2 Device Recall Sapphire Primary 1.2 Micron Filter Set Microbore Plum Microbore Infusion Sets with Inline Filter |
74 |
| Figure 4‑49: Class 2 Device Recall ONELINK Needlefree IV Connector |
75 |
| Figure 4‑50: Class 2 Device Recall MicroClave Clear Neutral Connector |
75 |
| Figure 4‑51: Class 2 Device Recall BD SmartSite |
75 |
| Figure 4‑52: Class 2 Device Recall ONELINK Needlefree IV Connector |
76 |
| Figure 4‑53: Class 2 Device Recall Argon Medical Devices Stopcocks |
77 |
| Figure 4‑54: Class 2 Device Recall BD Connecta Stopcocks |
77 |
| Figure 4‑55: Class 2 Device Recall IV Administration Set |
78 |
| Figure 4‑56: Class 2 Device Recall NAMIC Stopcocks |
78 |
| Figure 4‑57: Class 2 Device Recall Infusion Stopcock |
78 |
| Figure 4‑58: Class 2 Device Recall Medex stopcocks and manifolds |
78 |
| Figure 4‑59: Class 1 Device Recall Fresh Whole Blood Transfusion Set |
79 |
| Figure 4‑60: Class 1 Device Recall Low Titer Type O FWB Transfusion Set |
79 |
| Figure 4‑61: Hepatic Artery Infusion Pump Chemotherapy with Floxuridine and Dexamethasone in Combination with Systemic Chemotherapy for Patients with Colorectal Cancer Metastatic to the Liver |
81 |
| Figure 4‑62: Patient Outcomes After Hepatic Artery Infusion Pump Placement |
81 |
| Figure 4‑63: Evaluate Real-World Use of Next Generation Infusion Pumps to Administer Remodulin (EVOLVE) |
82 |
| Figure 4‑64: ElastoMeric Infusion Pumps for Hospital AntibioTICs (EMPHATIC) |
82 |
| Figure 4‑65: Prometra Post-Approval Study |
82 |
| Figure 4‑66: Hepatic Arterial Infusion Pump Chemotherapy Combined with Systemic Chemotherapy (PUMP-IT) |
83 |
| Figure 4‑67: Treatment of (IDA) by (FPC) Delivered via Infusion Pump in Patients Receiving Home Infusion Therapy |
83 |
| Figure 4‑68: An Observational Study to Evaluate BD PureHub™ Disinfecting Cap Use on Needle-Free Connectors |
84 |
| Figure 4‑69: Blood Transfusion in Patients with Lung Cancer |
85 |
| Figure 4‑70: Effect of Indication Based Blood Product Transfusion in Patients Undergoing Major Oncological Surgery |
85 |
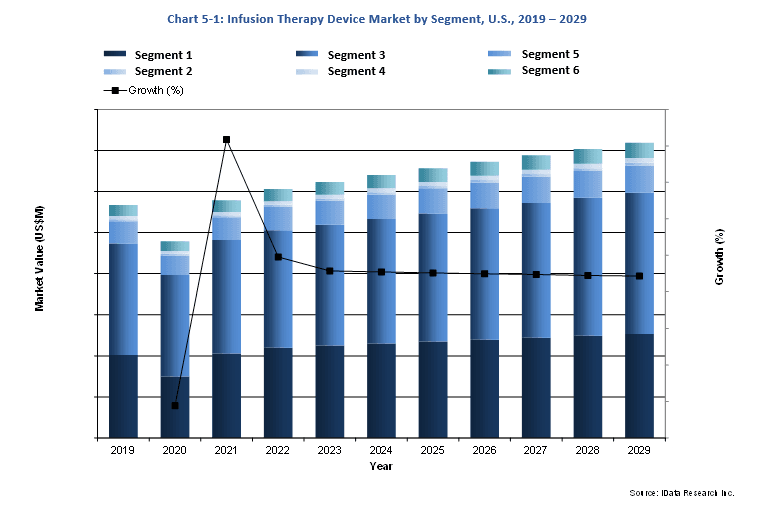
| Figure 5‑1: Infusion Therapy Device Market by Segment, U.S., 2019 – 2029 (US$M) |
90 |
| Figure 5‑2: Leading Competitors, Infusion Therapy Device Market, U.S., 2022 |
101 |
| Figure 5‑3: SWOT Analysis, Avanos Medical |
117 |
| Figure 5‑4: SWOT Analysis, B. Braun |
118 |
| Figure 5‑5: SWOT Analysis, Baxter |
119 |
| Figure 5‑6: SWOT Analysis, Becton Dickinson |
120 |
| Figure 5‑7: SWOT Analysis, Belmont Medical |
121 |
| Figure 5‑8: SWOT Analysis, CODAN |
122 |
| Figure 5‑9: SWOT Analysis, Fresenius |
123 |
| Figure 5‑10: SWOT Analysis, GVS Group |
124 |
| Figure 5‑11: SWOT Analysis, ICU Medical |
125 |
| Figure 5‑12: SWOT Analysis, Vygon |
126 |
| Figure 6‑1: Infusion Pump Market by Segment, U.S., 2019 – 2029 (US$M) |
130 |
| Figure 6‑2: Total Large-Volume Infusion Pump Market, U.S., 2019 – 2029 |
133 |
| Figure 6‑3: Large-Volume Infusion Pump Market by Care Setting, U.S., 2019 – 2029 (US$M) |
135 |
| Figure 6‑4: Hospital Large-Volume Infusion Pump Market, U.S., 2019 – 2029 |
137 |
| Figure 6‑5: Specialty Clinics Care Large-Volume Infusion Pump Market, U.S., 2019 – 2029 |
138 |
| Figure 6‑6: Ambulatory Surgical Center Large-Volume Infusion Pump Market, U.S., 2019 – 2029 |
139 |
| Figure 6‑7: Home Care Setting Large-Volume Infusion Pump Market, U.S., 2019 – 2029 |
140 |
| Figure 6‑8: Large-Volume Infusion Pump Market by Modularity, U.S., 2019 – 2029 (US$M) |
142 |
| Figure 6‑9: Modular Large-Volume Infusion Pump Market, U.S., 2019 – 2029 |
143 |
| Figure 6‑10: Non-Modular Large-Volume Infusion Pump Market, U.S., 2019 – 2029 |
144 |
| Figure 6‑11: Large-Volume Infusion Pump Market by MRI Compatibility, U.S., 2019 – 2029 (US$M) |
146 |
| Figure 6‑12: MRI-Compatible Large-Volume Infusion Pump Market, U.S., 2019 – 2029 |
147 |
| Figure 6‑13: Non-MRI-Compatible Large-Volume Infusion Pump Market, U.S., 2019 – 2029 |
148 |
| Figure 6‑14: Total Syringe Infusion Pump Market, U.S., 2019 – 2029 |
150 |
| Figure 6‑15: Syringe Infusion Pump Market by Care Setting, U.S., 2019 – 2029 (US$M) |
152 |
| Figure 6‑16: Hospital Syringe Infusion Pump Market, U.S., 2019 – 2029 |
153 |
| Figure 6‑17: Specialty Clinics Care Syringe Infusion Pump Market, U.S., 2019 – 2029 |
154 |
| Figure 6‑18: Ambulatory Surgical Center Syringe Infusion Pump Market, U.S., 2019 – 2029 |
155 |
| Figure 6‑19: Home Care Setting Syringe Infusion Pump Market, U.S., 2019 – 2029 |
156 |
| Figure 6‑20: Syringe Infusion Pump Market by Modularity, U.S., 2019 – 2029 (US$M) |
158 |
| Figure 6‑21: Modular Syringe Infusion Pump Market, U.S., 2019 – 2029 |
159 |
| Figure 6‑22: Non-Modular Syringe Infusion Pump Market, U.S., 2019 – 2029 |
160 |
| Figure 6‑23: Total Patient-Controlled Analgesia Infusion Pump Market, U.S., 2019 – 2029 |
162 |
| Figure 6‑24: Patient-Controlled Analgesia Infusion Pump Market by Care Setting, U.S., 2019 – 2029 (US$M) |
164 |
| Figure 6‑25: Hospital Patient-Controlled Analgesia Infusion Pump Market, U.S., 2019 – 2029 |
165 |
| Figure 6‑26: Specialty Clinics Patient-Controlled Analgesia Infusion Pump Market, U.S., 2019 – 2029 |
166 |
| Figure 6‑27: Ambulatory Surgical Center Patient-Controlled Analgesia Infusion Pump Market, U.S., 2019 – 2029 |
167 |
| Figure 6‑28: Home Care Setting Patient-Controlled Analgesia Infusion Pump Market, U.S., 2019 – 2029 |
168 |
| Figure 6‑29: Total Electronic Ambulatory Infusion Pump Market, U.S., 2019 – 2029 |
169 |
| Figure 6‑30: Electronic Ambulatory Infusion Pump Market by Care Setting, U.S., 2019 – 2029 (US$M) |
171 |
| Figure 6‑31: Hospital Electronic Ambulatory Infusion Pump Market, U.S., 2019 – 2029 |
172 |
| Figure 6‑32: Specialty Clinics Electronic Ambulatory Infusion Pump Market, U.S., 2019 – 2029 |
173 |
| Figure 6‑33: Ambulatory Surgical Center Electronic Ambulatory Infusion Pump Market, U.S., 2019 – 2029 |
174 |
| Figure 6‑34: Home Care Setting Electronic Ambulatory Infusion Pump Market, U.S., 2019 – 2029 |
175 |
| Figure 6‑35: Total Disposable Ambulatory Infusion Pump Market, U.S., 2019 – 2029 |
176 |
| Figure 6‑36: Disposable Ambulatory Infusion Pump Market by Type, U.S., 2019 – 2029 (US$M) |
177 |
| Figure 6‑37: Disposable Ambulatory Non-Pain Infusion Pump Market, U.S., 2019 – 2029 |
178 |
| Figure 6‑38: Disposable Ambulatory Pain Infusion Pump Market by Type, U.S., 2019 – 2029 (US$M) |
179 |
| Figure 6‑39: Total Disposable Ambulatory Pain Infusion Pump Market, U.S., 2019 – 2029 |
180 |
| Figure 6‑40: Surgical Post-Operative Disposable Ambulatory Pain Infusion Pump Market, U.S., 2019 – 2029 |
181 |
| Figure 6‑41: Peripheral Nerve Block Disposable Ambulatory Pain Infusion Pump Market, U.S., 2019 – 2029 |
182 |
| Figure 6‑42: Disposable Ambulatory Infusion Pump Market by Care Setting, U.S., 2019 – 2029 (US$M) |
184 |
| Figure 6‑43: Hospital Disposable Ambulatory Infusion Pump Market, U.S., 2019 – 2029 |
185 |
| Figure 6‑44: Specialty Clinics Disposable Ambulatory Infusion Pump Market, U.S., 2019 – 2029 |
186 |
| Figure 6‑45: Ambulatory Surgical Center Disposable Ambulatory Infusion Pump Market, U.S., 2019 – 2029 |
187 |
| Figure 6‑46: Home Care Setting Disposable Ambulatory Infusion Pump Market, U.S., 2019 – 2029 |
188 |
| Figure 6‑47: Leading Competitors, Infusion Pump Market, U.S., 2022 |
199 |
| Figure 7‑1: Intravenous Set Market by Device Type, U.S., 2019 – 2029 (US$M) |
203 |
| Figure 7‑2: Intravenous Set Market by Material, U.S., 2019 – 2029 (US$M) |
205 |
| Figure 7‑3: Total Pump Set Market, U.S., 2019 – 2029 |
208 |
| Figure 7‑4: Pump Set Market by Device Type, U.S., 2019 – 2029 (US$M) |
209 |
| Figure 7‑5: Dedicated Pump Set Market by Application, U.S., 2019 – 2029 (US$M) |
211 |
| Figure 7‑6: Total Dedicated Pump Set Market, U.S., 2019 – 2029 |
211 |
| Figure 7‑7: General Ward Dedicated Pump Set Market, U.S., 2019 – 2029 |
212 |
| Figure 7‑8: Burette Dedicated Pump Set Market, U.S., 2019 – 2029 |
213 |
| Figure 7‑9: Oncology Dedicated Pump Set Market, U.S., 2019 – 2029 |
214 |
| Figure 7‑10: Total Parenteral Nutrition Dedicated Pump Set Market, U.S., 2019 – 2029 |
215 |
| Figure 7‑11: Non-Dedicated Pump Set Market, U.S., 2019 – 2029 |
216 |
| Figure 7‑12: Pump Set Market by Light Protection, U.S., 2019 – 2029 (US$M) |
217 |
| Figure 7‑13: Light-Protected Pump Set Market, U.S., 2019 – 2029 |
218 |
| Figure 7‑14: Non-Light-Protected Pump Set Market, U.S., 2019 – 2029 |
219 |
| Figure 7‑15: Pump Set Market by Patient Age, U.S., 2019 – 2029 (US$M) |
220 |
| Figure 7‑16: Pediatric and Neonatal Pump Set Market, U.S., 2019 – 2029 |
221 |
| Figure 7‑17: Adult Pump Set Market, U.S., 2019 – 2029 |
222 |
| Figure 7‑18: Pump Set Market by Care Setting, U.S., 2019 – 2029 (US$M) |
223 |
| Figure 7‑19: Hospital Pump Set Market, U.S., 2019 – 2029 |
224 |
| Figure 7‑20: Specialty Clinics Pump Set Market, U.S., 2019 – 2029 |
225 |
| Figure 7‑21: Ambulatory Surgical Center Pump Set Market, U.S., 2019 – 2029 |
226 |
| Figure 7‑22: Home Care Setting Pump Set Market, U.S., 2019 – 2029 |
227 |
| Figure 7‑23: Total Gravity Set Market, U.S., 2019 – 2029 |
228 |
| Figure 7‑24: Gravity Set Market by Application, U.S., 2019 – 2029 (US$M) |
229 |
| Figure 7‑25: General Ward Gravity Set Market, U.S., 2019 – 2029 |
230 |
| Figure 7‑26: General Ward Set Market by Y-Site, U.S., 2019 – 2029 (US$M) |
231 |
| Figure 7‑27: General Ward Gravity Set Market by Needle-Free Access Port, U.S., 2019 – 2029 (US$M) |
232 |
| Figure 7‑28: General Ward Gravity Set with Y-Site Market, U.S., 2019 – 2029 |
233 |
| Figure 7‑29: General Ward Gravity Set with Y-Site with Needle-Free Access Port Market, U.S., 2019 – 2029 |
234 |
| Figure 7‑30: General Ward Gravity Set with Y-Site without Needle-Free Access Port Market, U.S., 2019 – 2029 |
235 |
| Figure 7‑31: General Ward Gravity Set without Y-Site Market, U.S., 2019 – 2029 |
236 |
| Figure 7‑32: General Ward Gravity Set Market by Filter, U.S., 2019 – 2029 (US$M) |
237 |
| Figure 7‑33: General Ward Gravity Set with Filter Market, U.S., 2019 – 2029 |
238 |
| Figure 7‑34: General Ward Gravity Set without Filter Market, U.S., 2019 – 2029 |
239 |
| Figure 7‑35: General Ward Gravity Set Market by Stopcock, U.S., 2019 – 2029 (US$M) |
240 |
| Figure 7‑36: General Ward Gravity Set with Stopcock Market, U.S., 2019 – 2029 |
241 |
| Figure 7‑37: General Ward Gravity Set without Stopcock Market, U.S., 2019 – 2029 |
242 |
| Figure 7‑38: General Ward Gravity Set Market by Flow Control, U.S., 2019 – 2029 (US$M) |
243 |
| Figure 7‑39: General Ward Gravity Set with Flow Control Market, U.S., 2019 – 2029 |
244 |
| Figure 7‑40: General Ward Gravity Set without Flow Control Market, U.S., 2019 – 2029 |
245 |
| Figure 7‑41: Burette Gravity Set Market, U.S., 2019 – 2029 |
246 |
| Figure 7‑42: Oncology Gravity Set Market, U.S., 2019 – 2029 |
247 |
| Figure 7‑43: Gravity Set Market by Care Setting, U.S., 2019 – 2029 (US$M) |
248 |
| Figure 7‑44: Hospital Gravity Set Market, U.S., 2019 – 2029 |
249 |
| Figure 7‑45: Specialty Clinics Gravity Set Market, U.S., 2019 – 2029 |
250 |
| Figure 7‑46: Ambulatory Surgical Center Gravity Set Market, U.S., 2019 – 2029 |
251 |
| Figure 7‑47: Home Care Setting Gravity Set Market, U.S., 2019 – 2029 |
252 |
| Figure 7‑48: Total Secondary Set Market, U.S., 2019 – 2029 |
253 |
| Figure 7‑49: Secondary Set Market by Care Setting, U.S., 2019 – 2029 |
254 |
| Figure 7‑50: Hospital Secondary Set Market, U.S., 2019 – 2029 |
255 |
| Figure 7‑51: Specialty Clinics Secondary Set Market, U.S., 2019 – 2029 |
256 |
| Figure 7‑52: Ambulatory Surgical Center Secondary Set Market, U.S., 2019 – 2029 |
257 |
| Figure 7‑53: Home Care Setting Secondary Set Market, U.S., 2019 – 2029 |
258 |
| Figure 7‑54: Total Extension Set Market, U.S., 2019 – 2029 |
260 |
| Figure 7‑55: Extension Set Market by Configuration, U.S., 2019 – 2029 (US$M) |
261 |
| Figure 7‑56: Standard Extension Set Market, U.S., 2019 – 2029 |
262 |
| Figure 7‑57: Multi-Way Extension Set Market, U.S., 2019 – 2029 |
263 |
| Figure 7‑58: Extension Set Market by IV Filter, U.S., 2019 – 2029 (US$M) |
265 |
| Figure 7‑59: Extension Set with Built-in IV Filter Market, U.S., 2019 – 2029 |
266 |
| Figure 7‑60: Extension Set without Built-in IV Filter Market, U.S., 2019 – 2029 |
267 |
| Figure 7‑61: Extension Set Market by Stopcock, U.S., 2019 – 2029 (US$M) |
268 |
| Figure 7‑62: Extension Set with Built-in Stopcock Market, U.S., 2019 – 2029 |
269 |
| Figure 7‑63: Extension Set without Built-in Stopcock Market, U.S., 2019 – 2029 |
270 |
| Figure 7‑64: Extension Set Market by Flow Control, U.S., 2019 – 2029 (US$M) |
272 |
| Figure 7‑65: Extension Set with Flow Control Market, U.S., 2019 – 2029 |
273 |
| Figure 7‑66: Extension Set without Flow Control Market, U.S., 2019 – 2029 |
274 |
| Figure 7‑67: Extension Set Market by Care Setting, U.S., 2019 – 2029 (US$M) |
275 |
| Figure 7‑68: Hospital Extension Set Market, U.S., 2019 – 2029 |
276 |
| Figure 7‑69: Specialty Clinics Extension Set Market, U.S., 2019 – 2029 |
277 |
| Figure 7‑70: Ambulatory Surgical Center Extension Set Market, U.S., 2019 – 2029 |
278 |
| Figure 7‑71: Home Care Setting Extension Set Market, U.S., 2019 – 2029 |
279 |
| Figure 7‑72: DEHP IV Set Market, U.S., 2019 – 2029 |
280 |
| Figure 7‑73: Non-DEHP IV Set Market, U.S., 2019 – 2029 |
281 |
| Figure 7‑74: Leading Competitors, Intravenous Set Market, U.S., 2022 |
287 |
| Figure 8‑1: Needleless Connector Market by Valve Type, U.S., 2019 – 2029 (US$M) |
291 |
| Figure 8‑2: Needleless Connector Market by Device Type, U.S., 2019 – 2029 (US$M) |
293 |
| Figure 8‑3: Needleless Connector Market by Antimicrobial Coating, U.S., 2019 – 2029 (US$M) |
295 |
| Figure 8‑4: Needleless Connector Market by Care Setting, U.S., 2019 – 2029 (US$M) |
297 |
| Figure 8‑5: Total Needleless Connector Market, U.S., 2019 – 2029 |
299 |
| Figure 8‑6: Split Septum & Blunt Cannula Needleless Connector Market, U.S., 2019 – 2029 |
301 |
| Figure 8‑7: Mechanical Valve Needleless Connector Market by Device Type, U.S., 2019 – 2029 (US$M) |
303 |
| Figure 8‑8: Total Mechanical Valve Needleless Connector Market, U.S., 2019 – 2029 |
304 |
| Figure 8‑9: Negative Displacement Mechanical Valve Needleless Connector Market, U.S., 2019 – 2029 |
305 |
| Figure 8‑10: Positive Displacement Mechanical Valve Needleless Connector Market, U.S., 2019 – 2029 |
306 |
| Figure 8‑11: Neutral Displacement Mechanical Valve Needleless Connector Market, U.S., 2019 – 2029 |
307 |
| Figure 8‑12: Anti-Reflux Neutral Displacement Mechanical Valve Needleless Connector Market, U.S., 2019 – 2029 |
308 |
| Figure 8‑13: Standalone Needleless Connector Market, U.S., 2019 – 2029 |
310 |
| Figure 8‑14: Integrated Needleless Connector Market, U.S., 2019 – 2029 |
311 |
| Figure 8‑15: Needleless Connector Market by Antimicrobial Coating, U.S., 2019 – 2029 (US$M) |
313 |
| Figure 8‑16: Antimicrobial Needleless Connector Market, U.S., 2019 – 2029 |
314 |
| Figure 8‑17: Conventional Needleless Connector Market, U.S., 2019 – 2029 |
315 |
| Figure 8‑18: Needleless Connector Market by Care Setting, U.S., 2019 – 2029 (US$M) |
316 |
| Figure 8‑19: Hospital Needleless Connector Market, U.S., 2019 – 2029 |
317 |
| Figure 8‑20: Specialty Clinics Needleless Connector Market, U.S., 2019 – 2029 |
318 |
| Figure 8‑21: Ambulatory Surgical Center Needleless Connector Market, U.S., 2019 – 2029 |
320 |
| Figure 8‑22: Home Care Setting Needleless Connector Market, U.S., 2019 – 2029 |
321 |
| Figure 8‑23: Leading Competitors, Needleless Connector Market, U.S., 2022 |
326 |
| Figure 9‑1: Stopcock Market by Flow Type, U.S., 2019 – 2029 (US$M) |
330 |
| Figure 9‑2: Stopcock Market by Care Setting, U.S., 2019 – 2029 (US$M) |
332 |
| Figure 9‑3: Total Stopcock Market, U.S., 2019 – 2029 |
334 |
| Figure 9‑4: One-Way Stopcock Market, U.S., 2019 – 2029 |
336 |
| Figure 9‑5: Two-Way Stopcock Market, U.S., 2019 – 2029 |
337 |
| Figure 9‑6: Three-Way Stopcock Market, U.S., 2019 – 2029 |
338 |
| Figure 9‑7: Four-Way Stopcock Market, U.S., 2019 – 2029 |
339 |
| Figure 9‑8: Stopcock Market by Care Setting, U.S., 2019 – 2029 (US$M) |
341 |
| Figure 9‑9: Hospital Stopcock Market, U.S., 2019 – 2029 |
342 |
| Figure 9‑10: Specialty Clinics Stopcock Market, U.S., 2019 – 2029 |
343 |
| Figure 9‑11: Ambulatory Surgical Center Stopcock Market, U.S., 2019 – 2029 |
344 |
| Figure 9‑12: Home Care Setting Stopcock Market, U.S., 2019 – 2029 |
345 |
| Figure 9‑13: Leading Competitors, Stopcock Market, U.S., 2022 |
350 |
| Figure 10‑1: Intravenous Filter Market by Care Setting, U.S., 2019 – 2029 (US$M) |
354 |
| Figure 10‑2: Total Intravenous Filter Market, U.S., 2019 – 2029 |
357 |
| Figure 10‑3: Hospital Intravenous Filter Market, U.S., 2019 – 2029 |
360 |
| Figure 10‑4: Specialty Clinics Intravenous Filter Market, U.S., 2019 – 2029 |
362 |
| Figure 10‑5: Ambulatory Surgical Center Intravenous Filter Market, U.S., 2019 – 2029 |
364 |
| Figure 10‑6: Home Care Setting Intravenous Filter Market, U.S., 2019 – 2029 |
366 |
| Figure 10‑7: Leading Competitors, Intravenous Filter Market, U.S., 2022 |
370 |
| Figure 11‑1: Blood Transfusion Device Market by Chamber Type, U.S., 2019 – 2029 (US$M) |
374 |
| Figure 11‑2: Blood Transfusion Device Market by Care Setting, U.S., 2019 – 2029 (US$M) |
376 |
| Figure 11‑3: Total Blood Transfusion Device Market, U.S., 2019 – 2029 |
378 |
| Figure 11‑4: Single-Chamber Blood Transfusion Device Market, U.S., 2019 – 2029 |
380 |
| Figure 11‑5: Dual-Chamber Blood Transfusion Device Market, U.S., 2019 – 2029 |
381 |
| Figure 11‑6: Hospital Blood Transfusion Device Market, U.S., 2019 – 2029 |
384 |
| Figure 11‑7: Specialty Clinics Blood Transfusion Device Market, U.S., 2019 – 2029 |
386 |
| Figure 11‑8 Other Blood Transfusion Device Market, U.S., 2019 – 2029 |
388 |
| Figure 11‑9: Leading Competitors, Blood Transfusion Device Market, U.S., 2022 |
392 |