Dental Prosthetics Market Size, Share & Trends Analysis | United States | 2026-2032 | MedSuite | Includes: Crowns and Bridges, Inlays and Onlays, and 4 more

  • Year: 2026
  • Scope: 10 Years
  • Region: United States
  • Pages: 343
  • Published Date: 03/27/2026
  • Type: MedSuite

Product Description

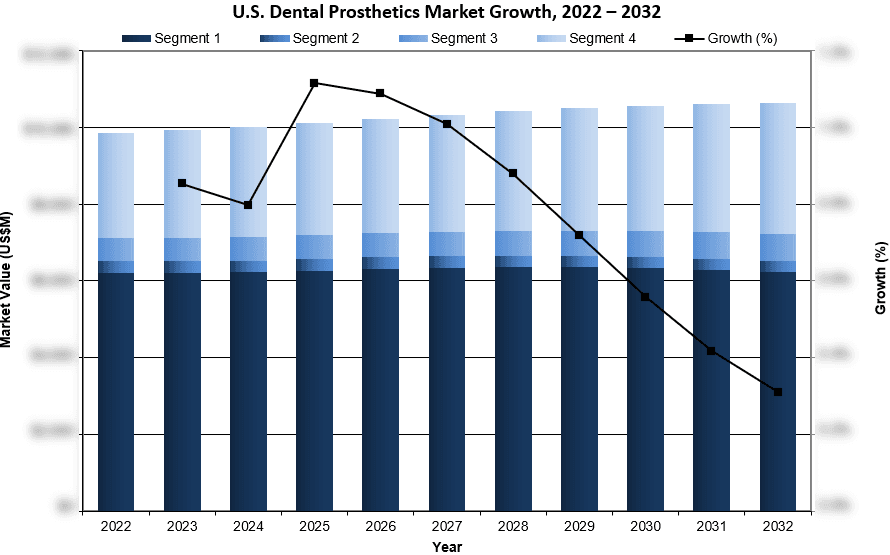
Overall, the U.S. dental prosthetics market was valued at $10.1 billion in 2025. This is expected to increase over the forecast period at a CAGR of 0.7% to reach $10.6 billion.

The U.S. dental prosthetics market encompasses crowns and bridges, inlays and onlays, veneers, dentures, denture teeth and computer-aided design/computer-aided manufacturing (CAD/CAM) milled prosthetics. These product categories collectively represent the restorative solutions used to address tooth loss, structural damage and aesthetic requirements across both clinical and laboratory settings.

Data Types Included

  • Unit SalesAverage Selling PricesMarket Size & Growth Trends
  • Market Drivers & Limiters
  • Market Forecasts Until 2032, and Historical Data to 2022
  • Recent Mergers & Acquisitions
  • Company Profiles and Product Portfolios
  • Leading Competitors

U.S. Dental Prosthetics Market Trends

U.S. Dental Prosthetics Market Growth, 2022-2032 - iData Research

Digital dentistry remains a central transformative force within the U.S. dental prosthetics market and is increasingly embedded across laboratory and clinical workflows. CAD/CAM systems enable higher precision, improved consistency and faster turnaround times compared to traditional fabrication methods, while chairside systems allow for same-day restorations in select indications. Adoption of digital dentures continues to increase, offering improved fit, reproducibility and reduced chair time relative to conventional workflows. Dental 3D printing is also gaining traction across prosthetic applications, including dentures, crowns and bridges, primarily for provisional and transitional restorations.

U.S. Dental Prosthetics Market Share Insights

Top U.S. Dental Prosthetics Market Share Leaders - Data Research

  • Glidewell Dental was the leading competitor in the U.S. dental prosthetics market in 2025. The company maintains a strong presence across crowns and bridges, inlays and onlays, veneers and dentures, supported by its scale, vertically integrated manufacturing capabilities and broad digital product ecosystem. In addition to being the largest dental laboratory in the U.S., Glidewell continues to invest heavily in digital workflows, proprietary CAD/CAM materials and chairside solutions, reinforcing its competitive positioning across both laboratory and clinical channels. Glidewell’s extensive zirconia portfolio, digital denture offerings and integrated in-office solutions are expected to support continued leadership as digital adoption accelerates.
  • National Dentex remained one of the largest competitors in the U.S. dental prosthetics market in 2025, operating across all major prosthetic segments. The company benefits from the largest network of affiliated laboratories in the U.S. and continues to pursue a growth strategy centered on laboratory acquisitions and operational scale. National Dentex’s competitive strengths include broad product coverage, pricing flexibility and the ability to serve dental service organizations (DSOs), group practices and independent dentists. Its vertically coordinated laboratory network and continued consolidation strategy are expected to sustain its position as a leading national laboratory operator.
  • Aspen Dental was also a notable competitor in the U.S. dental prosthetics market in 2025, with its position supported primarily by the denture segment. Unlike laboratory-focused competitors, Aspen Dental’s presence is driven by its large clinic network and strong exposure to removable prosthetics through integrated patient care and high-volume general dentistry services. The company’s scale in the denture market reflects its broad geographic footprint, strong brand visibility and ability to serve a large base of edentulous and aging patients. Although Aspen Dental has more limited participation across fixed prosthetic categories, its established role in removable restorations is expected to support its continued relevance in the broader dental prosthetics market.

U.S. Dental Prosthetics Market Segmentation Summary

  • Crown and Bridge Market – Further Segmented Into:
    • Prosthetic Type: Crown, and Bridge.
    • Material Type: Full-Cast, PFM, and Ceramic.
    • Fabrication Method: Traditional, and Digital.
  • Inlay and Onlay Market – Further Segmented Into:
    • Material Type: Gold, Zirconia, Other Ceramic, Composite Resin.
    • Technique Type: Direct, and Indirect.
    • Fabrication Method: Traditional, and Digital.
  • Veneer Market – Further Segmented Into:
    • Material Type: Porcelain/Ceramic, Composite Resin, and Zirconia.
    • Fabrication Method: Traditional, and Digital.
  • Denture Market – Further Segmented Into:
    • Denture Type: Full, and Partial.
  • Denture Teeth Market – Further Segmented Into:
    • Grade: Premium, Standard, and Economy.
    • Material: Acrylic, Porcelain/Ceramic, and Composite Resin.
  • CAD/CAM Milled Prosthetics Market – Further Segmented Into:
    • Device Type: Crown and Bridge, Inlay and Onlay, Veneer, and Denture.

Research Scope Summary

Report Attribute Details
Region United States
Base Year 2025
Forecast 2026-2032
Historical Data 2022-2024
Quantitative Coverage Market Size, Market Shares, Market Forecasts, Market Growth Rates, Units Sold, and Average Selling Prices.
Qualitative Coverage Market Growth Trends, Market Limiters, Competitive Analysis & SWOT for Top Competitors, Mergers & Acquisitions, Company Profiles, Product Portfolios, FDA Recalls, Disruptive Technologies, Disease Overviews.
Data Sources Primary Interviews with Industry Leaders, Government Physician Data, Regulatory Data, Hospital Private Data, Import & Export Data, iData Research Internal Database.

CONTACT US FOR ADDITIONAL INFORMATION

For full segmentation and any questions regarding research coverage, please contact us for a complimentary demo of the full report.

FREE Sample Report

Table of Contents

TABLE of CONTENTS
List of Figures
List of Charts
executive summary
U.S. Dental Prosthetics Market Overview
Competitive Analysis
Market Trends
Market Developments
Markets Included
Key Analysis Updates
Key Report Updates
Version History
research methodology
Step 1: Project Initiation & Team Selection
Step 2: Prepare Data Systems and Perform Secondary Research
Step 3: Preparation for Interviews & Questionnaire Design
Step 4: Performing Primary Research
Step 5: Research Analysis: Establishing Baseline Estimates
Step 6: Market Forecast and Analysis
Step 7: Identify Strategic Opportunities
Step 8: Final Review and Market Release
Step 9: Customer Feedback and Market Monitoring
Impact of Global Tariffs
U.S. DENTAL PROSTHETICs Market Overview
3.1 Introduction
3.2 Market Overview & Trend Analysis
3.3 Drivers and Limiters
3.3.1 Market Drivers
3.3.2 Market Limiters
3.4 Competitive Market Share Analysis
3.5 Mergers and Acquisitions
Crown and Bridge Market
4.1 Introduction
4.1.1 Crowns
4.1.2 Bridges
4.2 Market Overview
4.3 Market Analysis and Forecast
4.3.1 Total Crown and Bridge Market
4.3.1.1 Crown Market
4.3.1.2 Bridge Market
4.3.2 Full-Cast Crown and Bridge Market
4.3.2.1 Full-Cast Crown Market
4.3.2.2 Full-Cast Bridge Market
4.3.3 PFM Crown and Bridge Market
4.3.3.1 Non-Precious PFM Crown and Bridge Market
4.3.3.1.1 Non-Precious PFM Crown Market
4.3.3.1.2 Non-Precious PFM Bridge Market
4.3.3.2 Semi-Precious PFM Crown and Bridge Market
4.3.3.2.1 Semi-Precious PFM Crown Market
4.3.3.2.2 Semi-Precious PFM Bridge Market
4.3.3.3 Precious PFM Crown and Bridge Market
4.3.3.3.1 Precious PFM Crown Market
4.3.3.3.2 Precious PFM Bridge Market
4.3.4 Ceramic Crown and Bridge Market
4.3.4.1 Ceramic Crown Market
4.3.4.2 Ceramic Bridge Market
4.3.4.3 Zirconia Crown and Bridge Market
4.3.4.3.1 Layered Zirconia Crown and Bridge Market
4.3.4.3.2 Monolithic Zirconia Crown and Bridge Market
4.3.4.4 Other Ceramic Crown and Bridge Market
4.3.4.4.1 Layered Other Ceramic Crown and Bridge Market
4.3.4.4.2 Monolithic Other Ceramic Crown and Bridge Market
4.3.5 Traditional Crown and Bridge Market
4.3.5.1 Traditional Crown Market
4.3.5.2 Traditional Bridge Market
4.3.6 Digital Crown and Bridge Market
4.3.6.1 Digital Crown Market
4.3.6.2 Digital Bridge Market
4.4 Drivers and Limiters
4.4.1 Market Drivers
4.4.2 Market Limiters
4.5 Competitive Market Share Analysis
Inlay and Onlay Market
5.1 Introduction
5.2 Market Overview
5.3 Market Analysis and Forecast
5.3.1 Total Inlay and Onlay Market
5.3.2 Inlay and Onlay Market by Material Type
5.3.2.1 Gold Inlay and Onlay Market
5.3.2.2 Zirconia Inlay and Onlay Market
5.3.2.3 Other Ceramic Inlay and Onlay Market
5.3.2.4 Composite Resin Inlay and Onlay Market
5.3.3 Inlay and Onlay Market by Technique
5.3.3.1 Direct Inlay and Onlay Market
5.3.3.2 Indirect Inlay and Onlay Market
5.3.4 Inlay and Onlay Market by Fabrication Method
5.3.4.1 Traditional Inlay and Onlay Market
5.3.4.2 Digital Inlay and Onlay Market
5.4 Drivers and Limiters
5.4.1 Market Drivers
5.4.2 Market Limiters
5.5 Competitive Market Share Analysis
Veneer Market
6.1 Introduction
6.2 Market Overview
6.3 Market Analysis and Forecast
6.3.1 Total Veneer Market
6.3.2 Porcelain/Ceramic Veneer Market
6.3.2.1 Lithium Disilicate Veneer Market
6.3.2.2 Porcelain Veneer Market
6.3.3 Composite Resin Veneer Market
6.3.4 Zirconia Veneer Market
6.3.5 Traditional Veneer Market
6.3.6 Digital Veneer Market
6.4 Drivers and Limiters
6.4.1 Market Drivers
6.4.2 Market Limiters
6.5 Competitive Market Share Analysis
DENTURE Market
7.1 Introduction
7.2 Market Overview
7.3 Market Analysis and Forecast
7.3.1 Total Denture Market
7.3.2 Total Full Denture Market
7.3.2.1 Full Denture Market by Grade
7.3.2.1.1 Premium Full Denture Market
7.3.2.1.2 Standard Full Denture Market
7.3.2.1.3 Economy Full Denture Market
7.3.2.2 Full Denture Market by Product Type
7.3.2.2.1 Conventional Full Denture Market
7.3.2.2.2 Immediate Full Denture Market
7.3.2.3 Full Denture Market by Fabrication Type
7.3.2.3.1 Traditional Full Denture Market
7.3.2.3.2 Digital Full Denture Market
7.3.2.4 Full Denture Market by Case Type
7.3.2.4.1 Single Arch Full Denture Market
7.3.2.4.2 Full Mouth Full Denture Market
7.3.3 Total Partial Denture Market
7.3.3.1 Partial Denture Market by Material Type
7.3.3.1.1 Cast Metal Partial Denture Market
7.3.3.1.2 Acrylic Partial Denture Market
7.3.3.1.3 Flexible Partial Denture Market
7.3.3.2 Partial Denture Market by Fabrication Type
7.3.3.2.1 Traditional Partial Denture Market
7.3.3.2.2 Digital Partial Denture Market
7.4 Drivers and Limiters
7.4.1 Market Drivers
7.4.2 Market Limiters
7.5 Competitive Market Share Analysis
Denture Teeth Market
8.1 Introduction
8.2 Market Overview
8.2.1 Denture Teeth Market by Grade
8.2.2 Denture Teeth Market by Material Type
8.3 Market Analysis and Forecast
8.3.1 Total Denture Teeth Market
8.3.2 Denture Teeth Market by Grade
8.3.2.1 Premium Denture Teeth Market
8.3.2.2 Standard Denture Teeth Market
8.3.2.3 Economy Denture Teeth Market
8.3.3 Denture Teeth Market by Material Type
8.3.3.1 Acrylic Denture Teeth Market
8.3.3.2 Porcelain/Ceramic Denture Teeth Market
8.3.3.3 Composite Resin Denture Teeth Market
8.4 Drivers and Limiters
8.4.1 Market Drivers
8.4.2 Market Limiters
8.5 Competitive Market Share Analysis
CAD/CAM Milled Prosthetics Market
9.1 Introduction
9.2 Market Overview
9.3 Market Analysis and Forecast
9.3.1 Total CAD/CAM Milled Prosthetics Market
9.3.2 CAD/CAM Milled Crown and Bridge Market
9.3.3 CAD/CAM Milled Inlay and Onlay Market
9.3.4 CAD/CAM Milled Veneer Market
9.3.5 CAD/CAM Milled Denture Market
9.4 Unit Analysis
9.4.1 CAD/CAM Milled Crown and Bridge Market Units Sold by Setting
9.4.2 CAD/CAM Milled Inlay and Onlay Market Units Sold by Setting
9.4.3 CAD/CAM Milled Veneer Market Units Sold by Setting
9.4.4 CAD/CAM Milled Denture Market Units Sold by Setting
9.5 Drivers and Limiters
9.5.1 Market Drivers
9.5.2 Market Limiters
Abbreviations

Companies Included

• ADL Dental Lab • Myerson
• Affordable Dentures • National Dentex
• American Tooth Industries • NDX Pacific
• Aspen Dental • Next Dental Lab
• AvaDent • Nobilium
• Candulor • Pearson Dental Supply
• Cera Tech Lab • Precision Dental Arts
• CoLab Dental • R-Dent Dental Lab
• DDS Lab • Riverside Dental
• Dental Services Group • ROE Lab
• DenMat • RPD Lab
• Dentsply Sirona • SILCOX Dental Supply
• Enigma Cosmetic Dentures • Specialty Tooth Supply
• Glidewell Dental • Swan Dental Lab
• Henry Schein • Toros Dental
• Ivoclar • Uhler Dental Supply
• Kulzer • VITA North America
• MicroDental Laboratories • Wiedent
• Modern Dental • Yamahachi

Chart List

Chart 1‑1: Dental Prosthetics Market by Segment, U.S., 2025 – 2032
Chart 1‑2: Dental Prosthetics Market Overview, U.S., 2025 & 2032
Chart 3‑1: Dental Prosthetics Market by Segment, U.S., 2022 – 2032
Chart 3‑2: Leading Competitors, Dental Prosthetics Market, U.S., 2025
Chart 4‑1: Crown and Bridge Market by Segment, U.S., 2022 – 2032
Chart 4‑2: Leading Competitors, Crown and Bridge Market, U.S., 2025
Chart 5‑1: Inlay and Onlay Market by Segment, U.S., 2022 – 2032
Chart 5‑2: Leading Competitors, Inlay and Onlay Market, U.S., 2025
Chart 6‑1: Veneer Market by Segment, U.S., 2022 – 2032
Chart 6‑2: Leading Competitors, Veneer Market, U.S., 2025
Chart 7‑1: Denture Market by Segment, U.S., 2022 – 2032
Chart 7‑2: Leading Competitors, Denture Market, U.S., 2025
Chart 8‑1: Denture Teeth Market by Grade, U.S., 2022 – 2032
Chart 8‑2: Leading Competitors, Denture Teeth Market, U.S., 2025
Chart 9‑1: CAD/CAM Milled Prosthetics Market by Segment, U.S., 2022 – 2032

Figure List

Figure 1‑1: Dental Prosthetics Market Share Ranking by Segment, U.S., 2025
Figure 1‑2: Companies Researched in This Report
Figure 1‑3: Factors Impacting the Dental Prosthetics Market by Segment, U.S.
Figure 1‑4: Recent Events in the Dental Prosthetics Market, U.S., 2023 – 2026 (1 of 2)
Figure 1‑5: Recent Events in the Dental Prosthetics Market, U.S., 2023 – 2026 (2 of 2)
Figure 1‑6: Dental Prosthetics Markets Covered (1 of 5)
Figure 1‑7: Dental Prosthetics Markets Covered (2 of 5)
Figure 1‑8: Dental Prosthetics Markets Covered (3 of 5)
Figure 1‑9: Dental Prosthetics Markets Covered (4 of 5)
Figure 1‑10: Dental Prosthetics Markets Covered (5 of 5)
Figure 1‑11: Key Analysis Updates
Figure 1‑12: Key Report Updates
Figure 1‑13: Version History
Figure 3‑1: Dental Prosthetics Market by Segment, U.S., 2022 – 2032 (US$M)
Figure 3‑2: Leading Competitors, Dental Prosthetics Market, U.S., 2025
Figure 4‑1: Crown and Bridge Market by Segment, U.S., 2022 – 2032 (US$M)
Figure 4‑2: Crown and Bridge Market, U.S., 2022 – 2032
Figure 4‑3: Crown Market by Material Type, U.S., 2022 – 2032 (US$M)
Figure 4‑4: Total Crown Market, U.S., 2022 – 2032
Figure 4‑5: Bridge Market by Material Type, U.S., 2022 – 2032 (US$M)
Figure 4‑6: Total Bridge Market, U.S., 2022 – 2032
Figure 4‑7: Full-Cast Crown and Bridge Market by Prosthetic Type, U.S., 2022 – 2032 (US$M)
Figure 4‑8: Total Full-Cast Crown and Bridge Market, U.S., 2022 – 2032
Figure 4‑9: Full-Cast Crown Market, U.S., 2022– 2032
Figure 4‑10: Full-Cast Bridge Market, U.S., 2022 – 2032
Figure 4‑11: PFM Crown and Bridge Market by Segment, U.S., 2022 – 2032 (US$M)
Figure 4‑12: Total PFM Crown and Bridge Market, U.S., 2022 – 2032
Figure 4‑13: Non-Precious PFM Crown and Bridge Market by Prosthetic Type, U.S., 2022 – 2032 (US$M)
Figure 4‑14: Total Non-Precious PFM Crown and Bridge Market, U.S., 2022 – 2032
Figure 4‑15: Total Non-Precious PFM Crown Market, U.S., 2022 – 2032
Figure 4‑16: Non-Precious PFM Bridge Market, U.S., 2022 – 2032
Figure 4‑17: Semi-Precious PFM Crown and Bridge Market by Prosthetic Type, U.S., 2022 – 2032 (US$M)
Figure 4‑18: Total Semi-Precious PFM Crown and Bridge Market, U.S., 2022 – 2032
Figure 4‑19: Semi-Precious PFM Crown Market, U.S., 2022 – 2032
Figure 4‑20: Semi-Precious PFM Bridge Market, U.S., 2022 – 2032
Figure 4‑21: Precious PFM Crown and Bridge Market by Prosthetic Type, U.S., 2022 – 2032 (US$M)
Figure 4‑22: Total Precious PFM Crown and Bridge Market, U.S., 2022 – 2032
Figure 4‑23: Precious PFM Crown Market, U.S., 2022 – 2032
Figure 4‑24: Precious PFM Bridge Market, U.S., 2022 – 2032
Figure 4‑25: Ceramic Crown and Bridge Market by Prosthetic Type, U.S., 2022 – 2032 (US$M)
Figure 4‑26: Ceramic Crown and Bridge Market by Material Type, U.S., 2022 – 2032 (US$M)
Figure 4‑27: Total Ceramic Crown and Bridge Market, U.S., 2022 – 2032
Figure 4‑28: Ceramic Crown Market, U.S., 2022 – 2032
Figure 4‑29: Ceramic Bridge Market, U.S., 2022 – 2032
Figure 4‑30: Zirconia Crown and Bridge Market by Material Type, U.S., 2022 – 2032 (US$M)
Figure 4‑31: Total Zirconia Crown and Bridge Market, U.S., 2022 – 2032
Figure 4‑32: Layered Zirconia Crown and Bridge Market by Prosthetic Type, U.S., 2022 – 2032 (US$M)
Figure 4‑33: Total Layered Zirconia Crown and Bridge Market, U.S., 2022 – 2032
Figure 4‑34: Layered Zirconia Crown Market, U.S., 2022 – 2032
Figure 4‑35: Layered Zirconia Bridge Market, U.S., 2022 – 2032
Figure 4‑36: Monolithic Zirconia Crown and Bridge Market by Prosthetic Type, U.S., 2022 – 2032 (US$M)
Figure 4‑37: Total Monolithic Zirconia Crown and Bridge Market, U.S., 2022 – 2032
Figure 4‑38: Monolithic Zirconia Crown Market, U.S., 2022 – 2032
Figure 4‑39: Monolithic Zirconia Bridge Market, U.S., 2022 – 2032
Figure 4‑40: Other Ceramic Crown and Bridge Market by Material Type, U.S., 2022 – 2032 (US$M)
Figure 4‑41: Total Other Ceramic Crown and Bridge Market, U.S., 2022 – 2032
Figure 4‑42: Layered Other Ceramic Crown and Bridge Market by Prosthetic Type, U.S., 2022 – 2032 (US$M)
Figure 4‑43: Total Layered Other Ceramic Crown and Bridge Market, U.S., 2022 – 2032
Figure 4‑44: Layered Other Ceramic Crown Market, U.S., 2022 – 2032
Figure 4‑45: Layered Other Ceramic Bridge Market, U.S., 2022 – 2032
Figure 4‑46: Monolithic Other Ceramic Crown and Bridge Market by Prosthetic Type, U.S., 2022 – 2032 (US$M)
Figure 4‑47: Total Monolithic Other Ceramic Crown and Bridge Market, U.S., 2022 – 2032
Figure 4‑48: Monolithic Other Ceramic Crown Market, U.S., 2022 – 2032
Figure 4‑49: Monolithic Other Ceramic Bridge Market, U.S., 2022 – 2032
Figure 4‑50: Traditional Crown and Bridge Market, U.S., 2022 – 2032
Figure 4‑51: Traditional Crown Market, U.S., 2022 – 2032
Figure 4‑52: Traditional Bridge Market, U.S., 2022 – 2032
Figure 4‑53: Digital Crown and Bridge Market, U.S., 2022 – 2032
Figure 4‑54: Digital Crown Market, U.S., 2022 – 2032
Figure 4‑55: Digital Bridge Market, U.S., 2022 – 2032
Figure 4‑56: Leading Competitors, Crown and Bridge Market, U.S., 2025
Figure 5‑1: Inlay and Onlay Market by Segment, U.S., 2022 – 2032 (US$M)
Figure 5‑2: Total Inlay and Onlay Market, U.S., 2022 – 2032
Figure 5‑3: Gold Inlay and Onlay Market, U.S., 2022 – 2032
Figure 5‑4: Zirconia Inlay and Onlay Market, U.S., 2022 – 2032
Figure 5‑5: Other Ceramic Inlay and Onlay Market, U.S., 2022 – 2032
Figure 5‑6: Composite Resin Inlay and Onlay Market, U.S., 2022 – 2032
Figure 5‑7: Inlay and Onlay Market by Technique, U.S., 2022 – 2032 (US$M)
Figure 5‑8: Direct Inlay and Onlay Market, U.S., 2022 – 2032
Figure 5‑9: Indirect Inlay and Onlay Market, U.S., 2022 – 2032
Figure 5‑10: Inlay and Onlay Market by Fabrication Method, U.S., 2022 – 2032 (US$M)
Figure 5‑11: Traditional Inlay and Onlay Market, U.S., 2022 – 2032
Figure 5‑12: Digital Inlay and Onlay Market, U.S., 2022 – 2032
Figure 5‑13: Leading Competitors, Inlay and Onlay Market, U.S., 2025
Figure 6‑1: Veneer Market by Segment, U.S., 2022 – 2032 (US$M)
Figure 6‑2: Total Veneer Market, U.S., 2022 – 2032
Figure 6‑3: Porcelain/Ceramic Veneer Market by Type, U.S., 2022 – 2032 (US$M)
Figure 6‑4: Lithium Disilicate Veneer Market, U.S., 2022 – 2032
Figure 6‑5: Porcelain Veneer Market, U.S., 2022 – 2032
Figure 6‑6: Composite Resin Veneer Market, U.S., 2022 – 2032
Figure 6‑7: Total Zirconia Veneer Market, U.S., 2022 – 2032
Figure 6‑8: Traditional Veneer Market, U.S., 2022 – 2032
Figure 6‑9: Digital Veneer Market, U.S., 2022 – 2032
Figure 6‑10: Leading Competitors, Veneer Market, U.S., 2025
Figure 7‑1: Denture Market by Segment, U.S., 2022 – 2032 (US$M)
Figure 7‑2: Total Denture Market, U.S., 2022 – 2032
Figure 7‑3: Total Full Denture Market, U.S., 2022 – 2032
Figure 7‑4: Full Denture Market by Grade, U.S., 2022 – 2032 (US$M)
Figure 7‑5: Premium Full Denture Market, U.S., 2022 – 2032
Figure 7‑6: Standard Full Denture Market, U.S., 2022 – 2032
Figure 7‑7: Economy Full Denture Market, U.S., 2022 – 2032
Figure 7‑8: Full Denture Market by Product Type, U.S., 2022 – 2032 (US$M)
Figure 7‑9: Conventional Full Denture Market, U.S., 2022 – 2032
Figure 7‑10: Immediate Full Denture Market, U.S., 2022 – 2032
Figure 7‑11: Full Denture Market by Fabrication Type, U.S., 2022 – 2032 (US$M)
Figure 7‑12: Traditional Full Denture Market, U.S., 2022 – 2032
Figure 7‑13: Digital Full Denture Market, U.S., 2022 – 2032
Figure 7‑14: Full Denture Market by Case Type, U.S., 2022 – 2032 (US$M)
Figure 7‑15: Single Arch Full Denture Market, U.S., 2022 – 2032
Figure 7‑16: Full Mouth Full Denture Market, U.S., 2022 – 2032
Figure 7‑17: Total Partial Denture Market, U.S., 2022 – 2032
Figure 7‑18: Partial Denture Market by Material Type, U.S., 2022 – 2032 (US$M)
Figure 7‑19: Cast Metal Partial Denture Market, U.S., 2022 – 2032
Figure 7‑20: Acrylic Partial Denture Market, U.S., 2022 – 2032
Figure 7‑21: Flexible Partial Denture Market, U.S., 2022 – 2032
Figure 7‑22: Partial Denture Market by Case Type, U.S., 2022 – 2032 (US$M)
Figure 7‑23: Traditional Partial Denture Market, U.S., 2022 – 2032
Figure 7‑24: Digital Partial Denture Market, U.S., 2022 – 2032
Figure 7‑25: Leading Competitors, Denture Market, U.S., 2025
Figure 8‑1: Denture Teeth Market by Grade, U.S., 2022 – 2032 (US$M)
Figure 8‑2: Denture Teeth Market by Material Type, U.S., 2022 – 2032 (US$M)
Figure 8‑3: Total Denture Teeth Market, U.S., 2022 – 2032
Figure 8‑4: Premium Denture Teeth Market, U.S., 2022 – 2032
Figure 8‑5: Standard Denture Teeth Market, U.S., 2022 – 2032
Figure 8‑6: Economy Denture Teeth Market, U.S., 2022 – 2032
Figure 8‑7: Acrylic Denture Teeth Market, U.S., 2022 – 2032
Figure 8‑8: Porcelain/Ceramic Denture Teeth Market, U.S., 2022 – 2032
Figure 8‑9: Composite Resin Denture Teeth Market, U.S., 2022 – 2032
Figure 8‑10: Leading Competitors, Denture Teeth Market, U.S., 2025
Figure 9‑1: CAD/CAM Milled Prosthetics Market by Segment, U.S., 2022 – 2032 (US$M)
Figure 9‑2: Total CAD/CAM Milled Prosthetics Market, U.S., 2022 – 2032
Figure 9‑3: CAD/CAM Milled Crown and Bridge Market, U.S., 2022 – 2032
Figure 9‑4: CAD/CAM Milled Inlay and Onlay Market, U.S., 2022 – 2032
Figure 9‑5: CAD/CAM Milled Veneer Market, U.S., 2022 – 2032
Figure 9‑6: CAD/CAM Milled Denture Market, U.S., 2022 – 2032
Figure 9‑7: CAD/CAM Milled Crown and Bridge Market Units Sold by Setting, U.S., 2022 – 2032
Figure 9‑8: CAD/CAM Milled Inlay and Onlay Market Units Sold by Setting, U.S., 2022 – 2032
Figure 9‑9: CAD/CAM Milled Veneer Market Units Sold by Setting, U.S., 2022 – 2032
Figure 9‑10: CAD/CAM Milled Denture Market Units Sold by Setting, U.S., 2022 – 2032

iData’s 9-Step Research Methodology

Our reports follow an in-depth 9-step methodology which focuses on the following research systems:

  • Original primary research that consists of the most up-to-date market data
  • Strong foundation of quantitative and qualitative research
  • Focused on the needs and strategic challenges of the industry participants

Step 1: Project Initiation & Team Selection During this preliminary investigation, all staff members involved in the industry discusses the topic in detail.

Step 2: Prepare Data Systems and Perform Secondary Research The first task of the research team is to prepare for the data collection process: Filing systems and relational databases are developed as needed.

Step 3: Preparation for Interviews & Questionnaire Design The core of all iData research reports is primary market research. Interviews with industry insiders represent the single most reliable way to obtain accurate, current data about market conditions, trends, threats and opportunities.

Step 4: Performing Primary Research At this stage, interviews are performed using contacts and information acquired in the secondary research phase.

Step 5: Research Analysis: Establishing Baseline Estimates Following the completion of the primary research phase, the collected information must be synthesized into an accurate view of the market status. The most important question is the current state of the market.

Step 6: Market Forecast and Analysis iData Research uses a proprietary method to combine statistical data and opinions of industry experts to forecast future market values.

Step 7: Identify Strategic Opportunities iData analysts identify in broad terms why some companies are gaining or losing share within a given market segment.

Step 8: Final Review and Market Release An integral part of the iData research methodology is a built-in philosophy of quality control and continuing improvement is integral to the iData philosophy.

Step 9: Customer Feedback and Market Monitoring iData philosophy of continuous improvement requires that reports and consulting projects be monitored after release for customer feedback and market accuracy.

Click Here to Read More About Our Methodology