Infusion Therapy Market Size, Share & Trends Analysis | United States | 2026-2032 | MedSuite | Includes: Irrigation Solutions, Drug Reconstitution, and 3 more

  • Year: 2026
  • Scope: 10 Years
  • Region: United States
  • Pages: 363
  • Published Date: 10/10/2025
  • Type: MedSuite

Product Description

Overall, the U.S. infusion therapy device market was valued at over $4.1 billion in 2025. This is expected to increase over the forecast period at a CAGR of 2.3% to reach over $4.8 billion.

The full report suite on the U.S. market for infusion therapy devices includes infusion pumps, infusion sets (IV sets), needleless connectors, stopcocks for infusion systems, intravenous filters and devices designed for blood transfusion.

Data Types Included

  • Unit SalesAverage Selling PricesMarket Size & Growth Trends
  • Market Drivers & Limiters
  • Market Forecasts Until 2032, and Historical Data to 2022
  • Recent Mergers & Acquisitions
  • Company Profiles and Product Portfolios
  • Leading Competitors

U.S. Infusion Therapy Market Trends

U.S. Infusion Therapy Device Market Growth, 2022 – 2032 - iData Research

Rising healthcare costs are driving growth for infusion therapy devices in outpatient settings. More patients are receiving treatments in homecare, specialty clinics and ambulatory surgical centers, where purchasing power is lower than in large group purchasing organizations. This reduced leverage results in higher per-device costs, and the increased demand for these higher-priced products is a significant contributor to overall market expansion.

U.S. Infusion Therapy Market Share Insights

Top U.S. Orthopedic Soft Tissue Repair Market Share Leaders - iData Research

  • Becton Dickinson led the U.S. infusion therapy device and consumables market in 2025. Becton Dickinson entered the market via its acquisition of CareFusion in 2015 and has gradually expanded its market share in IV devices since then. The company was present in almost every major market segment and leads in the two largest: IV sets and needleless connectors.
  • ICU Medical was the second-leading competitor in the total infusion therapy device market. The company held this position with major market shares in infusion pump, IV set and needleless connector markets. The company was the leading player in the stopcock market in the United States. In 2022, ICU Medical acquired Smiths Medical, and it is projected that its market share will grow over the forecast period due to expected future product launches in the infusion therapy device market.
  • Baxter was the third-largest competitor in the U.S. infusion therapy device and consumables market. The company offers a comprehensive range of products in the infusion pump, IV set, needleless connector, stopcock and blood transfusion set markets. However, it does not hold a leading market share in any of these segments. Despite not being a market leader, Baxter has maintained its position as a strong player in the infusion therapy device market by offering a broad portfolio of high-quality products. Baxter has also been able to leverage its extensive distribution network to reach a broad range of customers.

U.S. Infusion Therapy Market Segmentation Summary

  • Infusion Pump Market – Further Segmented Into:
    • Device Type: Large Volume, Syringe, Patient-Controlled Analgesia, Electronic Ambulatory, and Disposable Ambulatory Pumps.
    • Smart Capability: Smart Pump and Non-Smart Pump.
    • EMR Integration: EMR Integrated and Non-EMR Integrated
  • Intravenous Set Market – Further Segmented Into:
    • Device Type: Pump Set, Gravity Set and Secondary Set, Extension Set
    • Material: DEHP IV Sets and Non-DEHP IV Sets.
  • Needleless Connector – Further Segmented Into:
    • Valve Type: Split Septum & Blunt Cannula and Mechanical Valve
    • Device Type:  Standalone and Integrated.
    • By Antimicrobial Coating:  Antimicrobial and Conventional.
    • Care Setting: Hospital, Ambulatory Surgical Center and Home Care Setting.
  • Stopcock – Further Segmented Into:
    • By Flow Type: One-Way, Two-Way, Three-Way and Four-Way.
    • Care Setting: Hospital, Ambulatory Surgical Center and Home Care Setting.
  • Intravenous Filter – Further Segmented Into:
    • Care Setting: Hospital, Ambulatory Surgical Center and Home Care Setting.
  • Blood Transfusion Set – Further Segmented Into:
    • By Chamber: Single-Chamber and Dual-Chamber
    • Care Setting: Hospital, Ambulatory Surgical Center and Home Care Setting.
  • Blood Warmer – Further Segmented Into:
    • Device Type: Capital Equipment and  Disposable.

Research Scope Summary

Report Attribute Details
Regions United States
Base Year 2025
Forecast 2026-2032
Historical Data 2022-2024
Quantitative Coverage Market Size, Market Shares, Market Forecasts, Market Growth Rates, Units Sold, and Average Selling Prices.
Qualitative Coverage Market Growth Trends, Market Limiters, Competitive Analysis & SWOT for Top Competitors, Mergers & Acquisitions, Company Profiles, Product Portfolios, FDA Recalls, Disruptive Technologies, Disease Overviews.
Data Sources Primary Interviews with Industry Leaders, Government Physician Data, Regulatory Data, Hospital Private Data, Import & Export Data, iData Research Internal Database.

CONTACT US FOR ADDITIONAL INFORMATION

For full segmentation and any questions regarding research coverage, please contact us for a complimentary demo of the full report.

FREE Sample Report

Table of Contents

List of Figures
List of Charts
executive summary
U.S. Infusion Therapy Device Market Overview
Competitive Analysis
Emerging Markets and Technologies
Market Trends
Market Developments
Market Segmentation
Key Report Updates
Version History
research methodology
Step 1: Project Initiation & Team Selection
Step 2: Prepare Data Systems and Perform Secondary Research
Step 3: Preparation for Interviews & Questionnaire Design
Step 4: Performing Primary Research
Step 5: Research Analysis: Establishing Baseline Estimates
Step 6: Market Forecast and Analysis
Step 7: Identify Strategic Opportunities
Step 8: Final Review and Market Release
Step 9: Customer Feedback and Market Monitoring
Impact of Global Tariffs
U.S. Infusion Therapy Device Market Overview
3.1 Introduction
3.2 Market Overview & Trend Analysis
3.3 Drivers and Limiters
3.3.1 Market Drivers
3.3.2 Market Limiters
3.4 Competitive Market Share Analysis
3.5 Mergers and Acquisitions
INFUSION PUMP Market
4.1 Introduction
4.2 Market Overview
4.3 Market Analysis and Forecast
4.3.1 Large-Volume Infusion Pump Market
4.3.1.1 Large-Volume Infusion Pump Market by Care Setting
4.3.1.1.1 Hospital Large-Volume Infusion Pump Market
4.3.1.1.2 Specialty Clinics Large-Volume Infusion Pump Market
4.3.1.1.3 Ambulatory Surgical Center Large-Volume Infusion Pump Market
4.3.1.1.4 Home Care Setting Large-Volume Infusion Pump Market
4.3.1.2 Large-Volume Infusion Pump Market by Modularity
4.3.1.2.1 Modular Large-Volume Infusion Pump Market
4.3.1.2.2 Non-Modular Large-Volume Infusion Pump Market
4.3.1.3 Large-Volume Infusion Pump Market by MRI Compatibility
4.3.1.3.1 MRI-Compatible Large-Volume Infusion Pump Market
4.3.1.3.2 Non-MRI-Compatible Large-Volume Infusion Pump Market
4.3.2 Syringe Infusion Pump Market
4.3.2.1 Syringe Infusion Pump Market by Care Setting
4.3.2.1.1 Hospital Syringe Infusion Pump Market
4.3.2.1.2 Specialty Clinics Syringe Infusion Pump Market
4.3.2.1.3 Ambulatory Surgical Center Syringe Infusion Pump Market
4.3.2.1.4 Home Care Setting Syringe Infusion Pump Market
4.3.2.2 Syringe Infusion Pump Market by Modularity
4.3.2.2.1 Modular Syringe Infusion Pump Market
4.3.2.2.2 Non-Modular Syringe Infusion Pump Market
4.3.3 Patient-Controlled Analgesia Infusion Pump Market
4.3.3.1 Patient-Controlled Analgesia Infusion Pump Market by Care Setting
4.3.3.1.1 Hospital Patient-Controlled Analgesia Infusion Pump Market
4.3.3.1.2 Specialty Clinics Patient-Controlled Analgesia Infusion Pump Market
4.3.3.1.3 Ambulatory Surgical Center Patient-Controlled Analgesia Infusion Pump Market
4.3.3.1.4 Home Care Setting Patient-Controlled Analgesia Infusion Pump Market
4.3.4 Electronic Ambulatory Infusion Pump Market
4.3.4.1 Electronic Ambulatory Infusion Pump Market by Care Setting
4.3.4.1.1 Hospital Electronic Ambulatory Infusion Pump Market
4.3.4.1.2 Specialty Clinics Electronic Ambulatory Infusion Pump Market
4.3.4.1.3 Ambulatory Surgical Center Electronic Ambulatory Infusion Pump Market
4.3.4.1.4 Home Care Setting Electronic Ambulatory Infusion Pump Market
4.3.5 Disposable Ambulatory Infusion Pump Market
4.3.5.1 Disposable Ambulatory Infusion Pump Market by Type
4.3.5.1.1 Disposable Ambulatory Non-Pain Infusion Pump Market
4.3.5.1.2 Disposable Ambulatory Pain Infusion Pump Market by Type
4.3.5.2 Disposable Ambulatory Infusion Pump Market by Care Setting
4.3.5.2.1 Hospital Disposable Ambulatory Infusion Pump Market
4.3.5.2.2 Specialty Clinics Disposable Ambulatory Infusion Pump Market
4.3.5.2.3 Ambulatory Surgical Center Disposable Ambulatory Infusion Pump Market
4.3.5.2.4 Home Care Setting Disposable Ambulatory Infusion Pump Market
4.3.6 Smart Infusion Pump Market
4.4 Drivers and Limiters
4.4.1 Market Drivers
4.4.2 Market Limiters
4.5 Competitive Market Share Analysis
Intravenous Set Market
5.1 Introduction
5.2 Market Overview
5.2.1 Market Overview by Device Type
5.2.2 Market Overview by Material
5.3 Market Analysis and Forecast
5.3.1 Intravenous Set Market by Device Type
5.3.1.1 Pump Set Market
5.3.1.1.1 Pump Set Market by Device Type
5.3.1.1.2 Pump Set Market by Light Protection
5.3.1.1.3 Pump Set Market by Patient Age
5.3.1.1.4 Pump Set Market by Care Setting
5.3.1.2 Gravity Set Market
5.3.1.2.1 Gravity Set Market by Application
5.3.1.2.2 Gravity Set Market by Care Setting
5.3.1.3 Secondary Set Market
5.3.1.3.1 Secondary Set Market by Care Setting
5.3.1.4 Extension Set Market
5.3.1.4.1 Extension Set Market by Configuration
5.3.1.4.2 Extension Set Market by IV Filter
5.3.1.4.3 Extension Set Market by Stopcock
5.3.1.4.4 Extension Set Market by Flow Control
5.3.1.4.5 Extension Set Market by Care Setting
5.3.2 Intravenous Set Market by Material
5.3.2.1 DEHP IV Set Market
5.3.2.2 Non-DEHP IV Set Market
5.4 Drivers and Limiters
5.4.1 Market Drivers
5.4.2 Market Limiters
5.5 Competitive Market Share Analysis
Needleless Connector Market
6.1 Introduction
6.2 Market Overview
6.2.1 Market Overview by Valve Type
6.2.2 Market Overview by Device Type
6.2.3 Market Overview by Antimicrobial Coating
6.2.4 Market Overview by Care Setting
6.3 Market Analysis and Forecast
6.3.1 Total Needleless Connector Market
6.3.2 Needleless Connector Market by Valve Type
6.3.2.1 Split Septum and Blunt Cannula Needleless Connector Market
6.3.2.2 Mechanical Valve Needleless Connector Market by Device Type
6.3.2.2.1 Negative Displacement Mechanical Valve Needleless Connector Market
6.3.2.2.2 Positive Displacement Mechanical Valve Needleless Connector Market
6.3.2.2.3 Neutral Displacement Mechanical Valve Needleless Connector Market
6.3.2.2.4 Anti-Reflux Neutral Displacement Mechanical Valve Needleless Connector Market
6.3.3 Needleless Connector Market by Device Type
6.3.3.1 Standalone Needleless Connector Market
6.3.3.2 Integrated Needleless Connector Market
6.3.4 Needleless Connector Market by Antimicrobial Coating
6.3.4.1 Antimicrobial Needleless Connector Market
6.3.4.2 Conventional Needleless Connector Market
6.3.5 Needleless Connector Market by Care Setting
6.3.5.1 Hospital Needleless Connector Market
6.3.5.2 Specialty Clinics Needleless Connector Market
6.3.5.3 Ambulatory Surgical Center Needleless Connector Market
6.3.5.4 Home Care Setting Needleless Connector Market
6.4 Drivers and Limiters
6.4.1 Market Drivers
6.4.2 Market Limiters
6.5 Competitive Market Share Analysis
Stopcock Market
7.1 Introduction
7.2 Market Overview
7.2.1 Market Overview by Flow Type
7.2.2 Market Overview by Care Setting
7.3 Market Analysis and Forecast
7.3.1 Total Stopcock Market
7.3.2 Stopcock Market by Flow Type
7.3.2.1 One-Way Stopcock Market
7.3.2.2 Two-Way Stopcock Market
7.3.2.3 Three-Way Stopcock Market
7.3.2.4 Four-Way Stopcock Market
7.3.3 Stopcock Market by Care Setting
7.3.3.1 Hospital Stopcock Market
7.3.3.2 Specialty Clinics Stopcock Market
7.3.3.3 Ambulatory Surgical Center Stopcock Market
7.3.3.4 Home Care Setting Stopcock Market
7.4 Drivers and Limiters
7.4.1 Market Drivers
7.4.2 Market Limiters
7.5 Competitive Market Share Analysis
Intravenous Filter Market
8.1 Introduction
8.2 Market Overview
8.2.1 Market Overview by Care Setting
8.3 Market Analysis and Forecast
8.3.1 Total Intravenous Filter Market
8.3.2 Intravenous Filter Market by Care Setting
8.3.2.1 Hospital Intravenous Filter Market
8.3.2.2 Specialty Clinics Intravenous Filter Market
8.3.2.3 Ambulatory Surgical Center Intravenous Filter Market
8.3.2.4 Home Care Setting Intravenous Filter Market
8.4 Drivers and Limiters
8.4.1 Market Drivers
8.4.2 Market Limiters
8.5 Competitive Market Share Analysis
Blood Transfusion Device Market
9.1 Introduction
9.2 Market Overview
9.2.1 Market Overview by Chamber Type
9.2.2 Market Overview by Care Setting
9.3 Market Analysis and Forecast
9.3.1 Total Blood Transfusion Device Market
9.3.2 Blood Transfusion Device Market by Chamber Type
9.3.2.1 Single-Chamber Blood Transfusion Device Market
9.3.2.2 Dual-Chamber Blood Transfusion Device Market
9.3.3 Blood Transfusion Device Market by Care Setting
9.3.3.1 Hospital Blood Transfusion Device Market
9.3.3.2 ASC Blood Transfusion Device Market
9.3.3.3 Other Blood Transfusion Device Market
9.4 Drivers and Limiters
9.4.1 Market Drivers
9.4.2 Market Limiters
9.5 Competitive Market Share Analysis
Blood Warmer Market
10.1 Introduction
10.2 Market Overview
10.3 Market Analysis and Forecast
10.3.1 Total Blood Warmer Capital Equipment Market
10.3.1.1 Blood Warmer Capital Equipment Market by Flow Rate
10.3.1.1.1 Standard Flow Blood Warmer Market
10.3.1.1.2 Rapid Infusion Blood Warmer Market
10.3.1.2 Blood Warmer Capital Equipment Market by Care Setting
10.3.1.2.1 Hospital Blood Warmer Market
10.3.1.2.2 Ambulatory Surgical Center Market
10.3.1.2.3 Other Care Setting Blood Warmer Market
10.3.2 Total Disposable Blood Warmer Market
10.3.2.1 Disposable Blood Warmer Market by Device Type
10.3.2.1.1 Administration Set Disposable Blood Warmer Market
10.3.2.1.2 Reservoir Disposable Blood Warmer Market
10.3.2.1.3 Other Disposable Blood Warmer Market
10.3.2.2 Disposable Blood Warmer Market by Care Setting
10.3.2.2.1 Hospital Disposable Blood Warmer Market
10.3.2.2.2 Ambulatory Surgical Center Disposable Blood Warmer Market
10.3.2.2.3 Other Care Setting Disposable Blood Warmer Market
10.4 Drivers and Limiters
10.4.1 Market Drivers
10.4.2 Market Limiters
10.5 Competitive Market Share Analysis
Abbreviations

Companies Included

·         3M ·         ITW Filtertek
·         Ace Medical ·         Ivenix
·         Actimed ·         Medcaptain
·         Ambu ·         Medline
·         Amsino ·         Mediplast
·         Argon Medical Devices ·         Mindray
·         Avanos Medical ·         Moog
·         B. Braun ·         Merit Medical
·         Baxter ·         Nexus Medical
·         Becton Dickinson ·         Nipro Medical
·         Belmont Medical Technologies ·         Nordson Medical
·         CODAN USA ·         NP Medical
·         Cook Medical ·         Pall Corporation
·         CoMedical ·         Promed
·         Eitan Medical ·         QinFlow
·         Elcam ·         Qosina
·         Fresenius ·         Rymed Technologies
·         FutureMed America ·         Samtronic
·         GVS Group ·         Smisson-Cartledge Biomedical
·         Halkey Roberts ·         Vygon
·         Hospira ·         Walkmed Infusion
·         ICU Medical ·         Zyno Medical
·         IRadimed

Chart List

Chart 1‑1: Infusion Therapy Device Market by Segment, U.S., 2025 – 2032
Chart 1‑2: Infusion Therapy Device Market Overview, U.S., 2025 & 2032
Chart 3‑1: Infusion Therapy Device Market by Segment, U.S., 2022 – 2032
Chart 3‑2: Leading Competitors, Infusion Therapy Device Market, U.S., 2025
Chart 4‑1: Infusion Pump Market by Segment, U.S., 2022 – 2032
Chart 4‑2: Leading Competitors, Infusion Pump Market, U.S., 2025
Chart 5‑1: Intravenous Set Market by Device Type, U.S., 2022 – 2032
Chart 5‑2: Intravenous Set Market by Material, U.S., 2022 – 2032
Chart 5‑3: Leading Competitors, Intravenous Set Market, U.S., 2025
Chart 6‑1: Needleless Connector Market by Valve Type, U.S., 2022 – 2032
Chart 6‑2: Needleless Connector Market by Device Type, U.S., 2022 – 2032
Chart 6‑3: Needleless Connector Market by Antimicrobial Coating, U.S., 2022 – 2032
Chart 6‑4: Needleless Connector Market by Care Setting, U.S., 2022 – 2032
Chart 6‑5: Leading Competitors, Needleless Connector Market, U.S., 2025
Chart 7‑1: Stopcock Market by Segment, U.S., 2022 – 2032
Chart 7‑2: Stopcock Market by Care Setting, U.S., 2022 – 2032
Chart 7‑3: Leading Competitors, Stopcock Market, U.S., 2025
Chart 8‑1: Intravenous Filter Market by Care Setting, U.S., 2022 – 2032
Chart 8‑2: Leading Competitors, Intravenous Filter Market, U.S., 2025
Chart 9‑1: Blood Transfusion Device Market by Chamber Type, U.S., 2022 – 2032
Chart 9‑2: Blood Transfusion Device Market by Care Setting, U.S., 2022 – 2032
Chart 9‑3: Leading Competitors, Blood Transfusion Device Market, U.S., 2025
Chart 10‑1: Blood Warmer Market by Device Type, U.S., 2022-2032
Chart 10‑2: Leading Competitors, Blood Warmer Market, U.S., 2025

Figure List

Figure 1‑1: Infusion Therapy Device Market Share Ranking by Segment, U.S., 2025 (1 of 2)
Figure 1‑2: Infusion Therapy Device Market Share Ranking by Segment, U.S., 2025 (2 of 2)
Figure 1‑3: Companies Researched in This Report
Figure 1‑4: Factors Impacting the Infusion Therapy Device Market by Segment, U.S. (1 of 2)
Figure 1‑5: Factors Impacting the Infusion Therapy Device Market by Segment, U.S. (2 of 2)
Figure 1‑6: Recent Events in the Infusion Therapy Device Market, U.S., 2022 – 2025 (1 of 2)
Figure 1‑7: Recent Events in the Infusion Therapy Device Market, U.S., 2022 – 2025 (2 of 2)
Figure 1‑8: Infusion Therapy Device Market Segmentation (1 of 5)
Figure 1‑9: Infusion Therapy Device Market Segmentation (2 of 5)
Figure 1‑10: Infusion Therapy Device Market Segmentation (3 of 5)
Figure 1‑11: Infusion Therapy Device Market Segmentation (4 of 5)
Figure 1‑12: Infusion Therapy Device Market Segmentation (5 of 5)
Figure 1‑13: Key Report Updates
Figure 1‑14: Version History
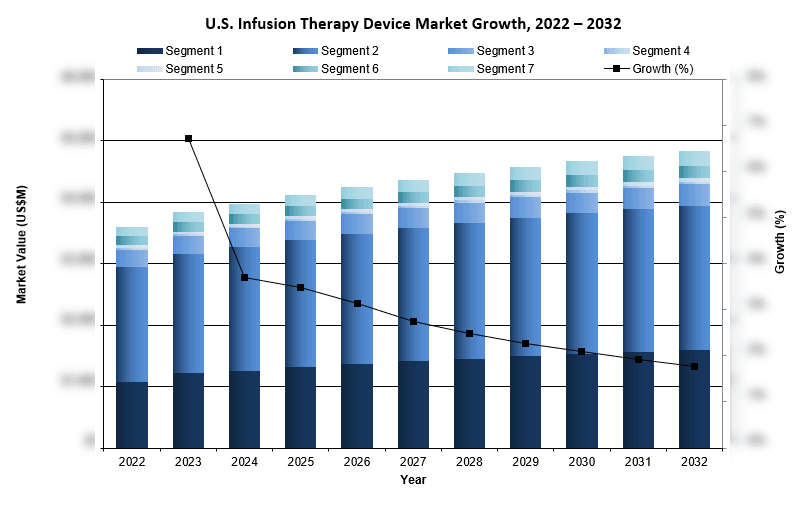
Figure 3‑1: Infusion Therapy Device Market by Segment, U.S., 2022 – 2032 (US$M)
Figure 3‑2: Leading Competitors, Infusion Therapy Device Market, U.S., 2025
Figure 4‑1: Infusion Pump Market by Segment, U.S., 2022 – 2032 (US$M)
Figure 4‑2: Total Large-Volume Infusion Pump Market, U.S., 2022 – 2032
Figure 4‑3: Large-Volume Infusion Pump Market by Care Setting, U.S., 2022 – 2032 (US$M)
Figure 4‑4: Hospital Large-Volume Infusion Pump Market, U.S., 2022 – 2032
Figure 4‑5: Specialty Clinics Care Large-Volume Infusion Pump Market, U.S., 2022 – 2032
Figure 4‑6: Ambulatory Surgical Center Large-Volume Infusion Pump Market, U.S., 2022 – 2032
Figure 4‑7: Home Care Setting Large-Volume Infusion Pump Market, U.S., 2022 – 2032
Figure 4‑8: Large-Volume Infusion Pump Market by Modularity, U.S., 2022 – 2032 (US$M)
Figure 4‑9: Modular Large-Volume Infusion Pump Market, U.S., 2022 – 2032
Figure 4‑10: Non-Modular Large-Volume Infusion Pump Market, U.S., 2022 – 2032
Figure 4‑11: Large-Volume Infusion Pump Market by MRI Compatibility, U.S., 2022 – 2032 (US$M)
Figure 4‑12: MRI-Compatible Large-Volume Infusion Pump Market, U.S., 2022 – 2032
Figure 4‑13: Non-MRI-Compatible Large-Volume Infusion Pump Market, U.S., 2022 – 2032
Figure 4‑14: Total Syringe Infusion Pump Market, U.S., 2022 – 2032
Figure 4‑15: Syringe Infusion Pump Market by Care Setting, U.S., 2022 – 2032 (US$M)
Figure 4‑16: Hospital Syringe Infusion Pump Market, U.S., 2022 – 2032
Figure 4‑17: Specialty Clinics Care Syringe Infusion Pump Market, U.S., 2022 – 2032
Figure 4‑18: Ambulatory Surgical Center Syringe Infusion Pump Market, U.S., 2022 – 2032
Figure 4‑19: Home Care Setting Syringe Infusion Pump Market, U.S., 2022 – 2032
Figure 4‑20: Syringe Infusion Pump Market by Modularity, U.S., 2022 – 2032 (US$M)
Figure 4‑21: Modular Syringe Infusion Pump Market, U.S., 2022 – 2032
Figure 4‑22: Non-Modular Syringe Infusion Pump Market, U.S., 2022 – 2032
Figure 4‑23: Total Patient-Controlled Analgesia Infusion Pump Market, U.S., 2022 – 2032
Figure 4‑24: Patient-Controlled Analgesia Infusion Pump Market by Care Setting, U.S.,2022 – 2032 (US$M)
Figure 4‑25: Hospital Patient-Controlled Analgesia Infusion Pump Market, U.S., 2022 – 2032
Figure 4‑26: Specialty Clinics Patient-Controlled Analgesia Infusion Pump Market, U.S., 2022 – 2032
Figure 4‑27: Ambulatory Surgical Center Patient-Controlled Analgesia Infusion Pump Market, U.S., 2022 – 2032
Figure 4‑28: Home Care Setting Patient-Controlled Analgesia Infusion Pump Market, U.S., 2022 – 2032
Figure 4‑29: Total Electronic Ambulatory Infusion Pump Market, U.S., 2022 – 2032
Figure 4‑30: Electronic Ambulatory Infusion Pump Market by Care Setting, U.S.,2022 – 2032 (US$M)
Figure 4‑31: Hospital Electronic Ambulatory Infusion Pump Market, U.S., 2022 – 2032
Figure 4‑32: Specialty Clinics Electronic Ambulatory Infusion Pump Market, U.S., 2022 – 2032
Figure 4‑33: Ambulatory Surgical Center Electronic Ambulatory Infusion Pump Market, U.S., 2022 – 2032
Figure 4‑34: Home Care Setting Electronic Ambulatory Infusion Pump Market, U.S., 2022 – 2032
Figure 4‑35: Total Disposable Ambulatory Infusion Pump Market, U.S., 2022 – 2032
Figure 4‑36: Disposable Ambulatory Infusion Pump Market by Type, U.S., 2022 – 2032 (US$M)
Figure 4‑37: Disposable Ambulatory Non-Pain Infusion Pump Market, U.S., 2022 – 2032
Figure 4‑38: Disposable Ambulatory Pain Infusion Pump Market by Type, U.S., 2022 – 2032 (US$M)
Figure 4‑39: Total Disposable Ambulatory Pain Infusion Pump Market, U.S., 2022 – 2032
Figure 4‑40: Surgical Post-Operative Disposable Ambulatory Pain Infusion Pump Market, U.S., 2022 – 2032
Figure 4‑41: Peripheral Nerve Block Disposable Ambulatory Pain Infusion Pump Market, U.S., 2022 – 2032
Figure 4‑42: Disposable Ambulatory Infusion Pump Market by Care Setting, U.S., 2022 – 2032 (US$M)
Figure 4‑43: Hospital Disposable Ambulatory Infusion Pump Market, U.S., 2022 – 2032
Figure 4‑44: Specialty Clinics Disposable Ambulatory Infusion Pump Market, U.S., 2022 – 2032
Figure 4‑45: Ambulatory Surgical Center Disposable Ambulatory Infusion Pump Market, U.S., 2022 – 2032
Figure 4‑46: Home Care Setting Disposable Ambulatory Infusion Pump Market, U.S., 2022 – 2032
Figure 4‑47: Smart/ Non-Smart Infusion Pumps, U.S., 2022 – 2032
Figure 4‑48: Integrations in Infusion Pumps, U.S., 2022 – 2032
Figure 4‑49: Leading Competitors, Infusion Pump Market, U.S., 2025
Figure 5‑1: Intravenous Set Market by Device Type, U.S., 2022 – 2032 (US$M)
Figure 5‑2: Intravenous Set Market by Material, U.S., 2022 – 2032 (US$M)
Figure 5‑3: Total Pump Set Market, U.S., 2022 – 2032
Figure 5‑4: Pump Set Market by Device Type, U.S., 2022 – 2032 (US$M)
Figure 5‑5: Dedicated Pump Set Market by Application, U.S., 2022 – 2032 (US$M)
Figure 5‑6: Total Dedicated Pump Set Market, U.S., 2022 – 2032
Figure 5‑7: General Ward Dedicated Pump Set Market, U.S., 2022 – 2032
Figure 5‑8: Burette Dedicated Pump Set Market, U.S., 2022 – 2032
Figure 5‑9: Oncology Dedicated Pump Set Market, U.S., 2022 – 2032
Figure 5‑10: Total Parenteral Nutrition Dedicated Pump Set Market, U.S., 2022 – 2032
Figure 5‑11: Non-Dedicated Pump Set Market, U.S., 2022 – 2032
Figure 5‑12: Pump Set Market by Light Protection, U.S., 2022 – 2032 (US$M)
Figure 5‑13: Light-Protected Pump Set Market, U.S., 2022 – 2032
Figure 5‑14: Non-Light-Protected Pump Set Market, U.S., 2022 – 2032
Figure 5‑15: Pump Set Market by Patient Age, U.S., 2022 – 2032 (US$M)
Figure 5‑16: Pediatric and Neonatal Pump Set Market, U.S., 2022 – 2032
Figure 5‑17: Adult Pump Set Market, U.S., 2022 – 2032
Figure 5‑18: Pump Set Market by Care Setting, U.S., 2022 – 2032 (US$M)
Figure 5‑19: Hospital Pump Set Market, U.S., 2022 – 2032
Figure 5‑20: Specialty Clinics Pump Set Market, U.S., 2022 – 2032
Figure 5‑21: Ambulatory Surgical Center Pump Set Market, U.S., 2022 – 2032
Figure 5‑22: Home Care Setting Pump Set Market, U.S., 2022 – 2032
Figure 5‑23: Total Gravity Set Market, U.S., 2022 – 2032
Figure 5‑24: Gravity Set Market by Application, U.S., 2022 – 2032 (US$M)
Figure 5‑25: General Ward Gravity Set Market, U.S., 2022 – 2032
Figure 5‑26: General Ward Set Market by Y-Site, U.S., 2022 – 2032 (US$M)
Figure 5‑27: General Ward Gravity Set Market by Needle-Free Access Port, U.S., 2022 – 2032 (US$M)
Figure 5‑28: General Ward Gravity Set with Y-Site Market, U.S., 2022 – 2032
Figure 5‑29: General Ward Gravity Set with Y-Site with Needle-Free Access Port Market, U.S., 2022 – 2032
Figure 5‑30: General Ward Gravity Set with Y-Site without Needle-Free Access Port Market, U.S., 2022 – 2032
Figure 5‑31: General Ward Gravity Set without Y-Site Market, U.S., 2022 – 2032
Figure 5‑32: General Ward Gravity Set Market by Filter, U.S., 2022 – 2032 (US$M)
Figure 5‑33: General Ward Gravity Set with Filter Market, U.S., 2022 – 2032
Figure 5‑34: General Ward Gravity Set without Filter Market, U.S., 2022 – 2032
Figure 5‑35: General Ward Gravity Set Market by Stopcock, U.S., 2022 – 2032 (US$M)
Figure 5‑36: General Ward Gravity Set with Stopcock Market, U.S., 2022 – 2032
Figure 5‑37: General Ward Gravity Set without Stopcock Market, U.S., 2022 – 2032
Figure 5‑38: General Ward Gravity Set Market by Flow Control, U.S., 2022 – 2032 (US$M)
Figure 5‑39: General Ward Gravity Set with Flow Control Market, U.S., 2022 – 2032
Figure 5‑40: General Ward Gravity Set without Flow Control Market, U.S., 2022 – 2032
Figure 5‑41: Burette Gravity Set Market, U.S., 2022 – 2032
Figure 5‑42: Oncology Gravity Set Market, U.S., 2022 – 2032
Figure 5‑43: Gravity Set Market by Care Setting, U.S., 2022 – 2032 (US$M)
Figure 5‑44: Hospital Gravity Set Market, U.S., 2022 – 2032
Figure 5‑45: Specialty Clinics Gravity Set Market, U.S., 2022 – 2032
Figure 5‑46: Ambulatory Surgical Center Gravity Set Market, U.S., 2022 – 2032
Figure 5‑47: Home Care Setting Gravity Set Market, U.S., 2022 – 2032
Figure 5‑48: Total Secondary Set Market, U.S., 2022 – 2032
Figure 5‑49: Secondary Set Market by Care Setting, U.S., 2022 – 2032
Figure 5‑50: Hospital Secondary Set Market, U.S., 2022 – 2032
Figure 5‑51: Specialty Clinics Secondary Set Market, U.S., 2022 – 2032
Figure 5‑52: Ambulatory Surgical Center Secondary Set Market, U.S., 2022 – 2032
Figure 5‑53: Home Care Setting Secondary Set Market, U.S., 2022 – 2032
Figure 5‑54: Total Extension Set Market, U.S., 2022 – 2032
Figure 5‑55: Extension Set Market by Configuration, U.S., 2022 – 2032 (US$M)
Figure 5‑56: Standard Extension Set Market, U.S., 2022 – 2032
Figure 5‑57: Multi-Way Extension Set Market, U.S., 2022 – 2032
Figure 5‑58: Extension Set Market by IV Filter, U.S., 2022 – 2032 (US$M)
Figure 5‑59: Extension Set with Built-in IV Filter Market, U.S., 2022 – 2032
Figure 5‑60: Extension Set without Built-in IV Filter Market, U.S., 2022 – 2032
Figure 5‑61: Extension Set Market by Stopcock, U.S., 2022 – 2032 (US$M)
Figure 5‑62: Extension Set with Built-in Stopcock Market, U.S., 2022 – 2032
Figure 5‑63: Extension Set without Built-in Stopcock Market, U.S., 2022 – 2032
Figure 5‑64: Extension Set Market by Flow Control, U.S., 2022 – 2032 (US$M)
Figure 5‑65: Extension Set with Flow Control Market, U.S., 2022 – 2032
Figure 5‑66: Extension Set without Flow Control Market, U.S., 2022 – 2032
Figure 5‑67: Extension Set Market by Care Setting, U.S., 2022 – 2032 (US$M)
Figure 5‑68: Hospital Extension Set Market, U.S., 2022 – 2032
Figure 5‑69: Specialty Clinics Extension Set Market, U.S., 2022 – 2032
Figure 5‑70: Ambulatory Surgical Center Extension Set Market, U.S., 2022 – 2032
Figure 5‑71: Home Care Setting Extension Set Market, U.S., 2022 – 2032
Figure 5‑72: DEHP IV Set Market, U.S., 2022 – 2032
Figure 5‑73: Non-DEHP IV Set Market, U.S., 2022 – 2032
Figure 5‑74: Leading Competitors, Intravenous Set Market, U.S., 2025
Figure 6‑1: Needleless Connector Market by Valve Type, U.S., 2022 – 2032 (US$M)
Figure 6‑2: Needleless Connector Market by Device Type, U.S., 2022 – 2032 (US$M)
Figure 6‑3: Needleless Connector Market by Antimicrobial Coating, U.S., 2022 – 2032 (US$M)
Figure 6‑4: Needleless Connector Market by Care Setting, U.S., 2022 – 2032 (US$M)
Figure 6‑5: Total Needleless Connector Market, U.S., 2022 – 2032
Figure 6‑6: Split Septum & Blunt Cannula Needleless Connector Market, U.S., 2022 – 2032
Figure 6‑7: Mechanical Valve Needleless Connector Market by Device Type, U.S., 2022 – 2032 (US$M)
Figure 6‑8: Total Mechanical Valve Needleless Connector Market, U.S., 2022 – 2032
Figure 6‑9: Negative Displacement Mechanical Valve Needleless Connector Market, U.S., 2022 – 2032
Figure 6‑10: Positive Displacement Mechanical Valve Needleless Connector Market, U.S., 2022 – 2032
Figure 6‑11: Neutral Displacement Mechanical Valve Needleless Connector Market, U.S., 2022 – 2032
Figure 6‑12: Anti-Reflux Neutral Displacement Mechanical Valve Needleless Connector Market, U.S., 2022 – 2032
Figure 6‑13: Standalone Needleless Connector Market, U.S., 2022 – 2032
Figure 6‑14: Integrated Needleless Connector Market, U.S., 2022 – 2032
Figure 6‑15: Needleless Connector Market by Antimicrobial Coating, U.S., 2022 – 2032 (US$M)
Figure 6‑16: Antimicrobial Needleless Connector Market, U.S., 2022 – 2032
Figure 6‑17: Conventional Needleless Connector Market, U.S., 2022 – 2032
Figure 6‑18: Needleless Connector Market by Care Setting, U.S., 2022 – 2032 (US$M)
Figure 6‑19: Hospital Needleless Connector Market, U.S., 2022 – 2032
Figure 6‑20: Specialty Clinics Needleless Connector Market, U.S., 2022 – 2032
Figure 6‑21: Ambulatory Surgical Center Needleless Connector Market, U.S., 2022 – 2032
Figure 6‑22: Home Care Setting Needleless Connector Market, U.S., 2022 – 2032
Figure 6‑23: Leading Competitors, Needleless Connector Market, U.S., 2025
Figure 7‑1: Stopcock Market by Flow Type, U.S., 2022 – 2032 (US$M)
Figure 7‑2: Stopcock Market by Care Setting, U.S., 2022 – 2032 (US$M)
Figure 7‑3: Total Stopcock Market, U.S., 2022 – 2032
Figure 7‑4: One-Way Stopcock Market, U.S., 2022 – 2032
Figure 7‑5: Two-Way Stopcock Market, U.S., 2022 – 2032
Figure 7‑6: Three-Way Stopcock Market, U.S., 2022 – 2032
Figure 7‑7: Four-Way Stopcock Market, U.S., 2022 – 2032
Figure 7‑8: Stopcock Market by Care Setting, U.S., 2022 – 2032 (US$M)
Figure 7‑9: Hospital Stopcock Market, U.S., 2022 – 2032
Figure 7‑10: Specialty Clinics Stopcock Market, U.S., 2022 – 2032
Figure 7‑11: Ambulatory Surgical Center Stopcock Market, U.S., 2022 – 2032
Figure 7‑12: Home Care Setting Stopcock Market, U.S., 2022 – 2032
Figure 7‑13: Leading Competitors, Stopcock Market, U.S., 2025
Figure 8‑1: Intravenous Filter Market by Care Setting, U.S., 2022 – 2032 (US$M)
Figure 8‑2: Total Intravenous Filter Market, U.S., 2022 – 2032
Figure 8‑3: Hospital Intravenous Filter Market, U.S., 2022 – 2032
Figure 8‑4: Specialty Clinics Intravenous Filter Market, U.S., 2022 – 2032
Figure 8‑5: Ambulatory Surgical Center Intravenous Filter Market, U.S., 2022 – 2032
Figure 8‑6: Home Care Setting Intravenous Filter Market, U.S., 2022 – 2032
Figure 8‑7: Leading Competitors, Intravenous Filter Market, U.S., 2025
Figure 9‑1: Blood Transfusion Device Market by Chamber Type, U.S., 2022 – 2032 (US$M)
Figure 9‑2: Blood Transfusion Device Market by Care Setting, U.S., 2022 – 2032 (US$M)
Figure 9‑3: Total Blood Transfusion Device Market, U.S., 2022 – 2032
Figure 9‑4: Single-Chamber Blood Transfusion Device Market, U.S., 2022 – 2032
Figure 9‑5: Dual-Chamber Blood Transfusion Device Market, U.S., 2022 – 2032
Figure 9‑6: Hospital Blood Transfusion Device Market, U.S., 2022 – 2032
Figure 9‑7: ASC Blood Transfusion Device Market, U.S., 2022 – 2032
Figure 9‑8 Other Blood Transfusion Device Market, U.S., 2022 – 2032
Figure 9‑9: Leading Competitors, Blood Transfusion Device Market, U.S., 2025
Figure 10‑1: Blood Warmer Market by Device Type, U.S., 2022 – 2032 (US$M)
Figure 10‑2: Total Blood Warmer Capital Equipment Market, U.S., 2022-2032
Figure 10‑3: Blood Warmer Capital Equipment Market by Flow Rate, U.S., 2022-2032 (US$M)
Figure 10‑4: Standard Flow Blood Warmer Market, U.S., 2022-2032
Figure 10‑5: Rapid Infusion Blood Warmer Market, U.S., 2022-2032
Figure 10‑6: Blood Warmer Capital Equipment Market by Care Setting, U.S., 2022-2032 (US$M)
Figure 10‑7: Hospital Blood Warmer Market, U.S., 2022-2032
Figure 10‑8: Ambulatory Surgical Center Market, U.S., 2022-2032
Figure 10‑9: Other Care Setting Blood Warmer Market, U.S., 2022-2032
Figure 10‑10: Total Disposable Blood Warmer Market, U.S., 2022-2032
Figure 10‑11: Disposable Blood Warmer Market by Device Type, U.S., 2022-2032 (US$M)
Figure 10‑12: Administration Set Disposable Blood Warmer Market, U.S., 2022-2032
Figure 10‑13: Reservoir Disposable Blood Warmer Market, U.S., 2022-2032
Figure 10‑14: Other Disposable Blood Warmer Market, U.S., 2022-2032
Figure 10‑15: Disposable Blood Warmer Market by Care Setting, U.S., 2022-2032 (US$M)
Figure 10‑16: Hospital Disposable Blood Warmer Market, U.S., 2022-2032
Figure 10‑17: Ambulatory Surgical Center Disposable Blood Warmer Market, U.S., 2022-2032
Figure 10‑18: Other Care Setting Disposable Blood Warmer Market, U.S., 2022-2032
Figure 10‑19: Leading Competitors, Blood Warmer Market, U.S., 2025

iData’s 9-Step Research Methodology

Our reports follow an in-depth 9-step methodology which focuses on the following research systems:

  • Original primary research that consists of the most up-to-date market data
  • Strong foundation of quantitative and qualitative research
  • Focused on the needs and strategic challenges of the industry participants

Step 1: Project Initiation & Team Selection During this preliminary investigation, all staff members involved in the industry discusses the topic in detail.

Step 2: Prepare Data Systems and Perform Secondary Research The first task of the research team is to prepare for the data collection process: Filing systems and relational databases are developed as needed.

Step 3: Preparation for Interviews & Questionnaire Design The core of all iData research reports is primary market research. Interviews with industry insiders represent the single most reliable way to obtain accurate, current data about market conditions, trends, threats and opportunities.

Step 4: Performing Primary Research At this stage, interviews are performed using contacts and information acquired in the secondary research phase.

Step 5: Research Analysis: Establishing Baseline Estimates Following the completion of the primary research phase, the collected information must be synthesized into an accurate view of the market status. The most important question is the current state of the market.

Step 6: Market Forecast and Analysis iData Research uses a proprietary method to combine statistical data and opinions of industry experts to forecast future market values.

Step 7: Identify Strategic Opportunities iData analysts identify in broad terms why some companies are gaining or losing share within a given market segment.

Step 8: Final Review and Market Release An integral part of the iData research methodology is a built-in philosophy of quality control and continuing improvement is integral to the iData philosophy.

Step 9: Customer Feedback and Market Monitoring iData philosophy of continuous improvement requires that reports and consulting projects be monitored after release for customer feedback and market accuracy.

Click Here to Read More About Our Methodology