Surgical Graft Market Size, Share & Analysis | Global | 2025-2032 | MedCore | Includes: Lower Limb Surgical Grafts, and 2 more

  • Year: 2026
  • Scope: 10 Years
  • Region: Global
  • Published Date: 12/05/2025
  • Type: MedCore

Product Description

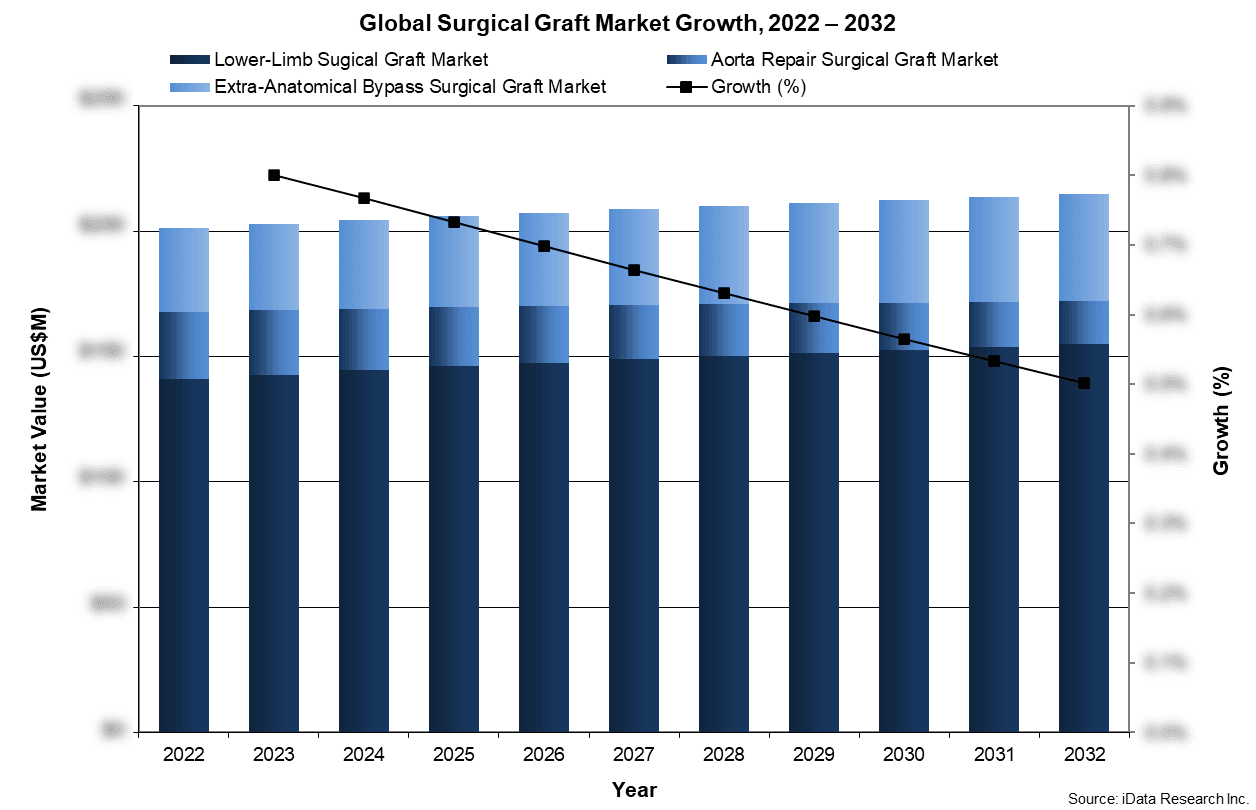
The global surgical graft market was valued at $206 million in 2025. This is expected to increase over the forecast period at a CAGR of 0.6% to reach $215 million by 2032.

The full report on the global surgical graft market includes lower limb surgical grafts, aorta repair surgical grafts, and extra-anatomical bypass surgical grafts.

The report includes data for 65 countries across 7 different regions which include North America, Latin America, Western Europe, Central & Eastern Europe, Middle East, Asia-Pacific, and Africa.

Data Types Included

  • Unit SalesAverage Selling PricesMarket Size & Growth Trends
  • Procedure Numbers
  • Market Drivers & Limiters
  • Market Forecasts Until 2032, and Historical Data to 2022
  • Recent Mergers & Acquisitions
  • Company Profiles and Product Portfolios
  • Leading Competitors

Global Surgical Graft Market Trends

Global Surgical Graft Market Growth, 2022-2032
An ongoing trend in the vascular surgical graft market is the growing adoption of endovascular techniques and minimally invasive procedures. As medical technology advances, there is a noticeable shift toward using endovascular grafts and stent grafts as alternatives to traditional open surgical procedures. These minimally invasive approaches offer benefits such as reduced patient trauma, shorter hospital stays, quicker recovery times and potentially fewer complications. This trend is driven by advancements in graft materials, improved delivery systems and the preference of both patients and physicians for less invasive treatment options. As these technologies continue to evolve and gain acceptance, they are likely to reshape the landscape of vascular surgical procedures on a global scale.

Global Surgical Graft Market Share Insights

Top Global Surgical Graft Market Share Leaders

  • W.L. Gore held a prominent position in the ATK and BTK surgical graft markets, largely attributed to its PROPATEN® line, particularly within the BTK subsegment in 2025. Their PROPATEN® vascular graft has gained remarkable traction in the market due to its distinctive attributes, cost-effectiveness and robust clinical evidence. The graft is coated with heparin, an anticoagulant, which minimizes thrombus formation on its surface.
  • Terumo help the second leading position throughout 2025 due to the Gelsoft™ and Gelweave™ product lines, which incorporate hydrolyzable gelatin impregnated into the coating. Gelsoft™ is made using sealed polyester, while Gelweave™ is made using a woven polyester covering. Terumo’s broad portfolio offers extensive options for both cardiac and peripheral applications.
  • Maquet held the third position in the market through it’s HEMASHIELD® products are among the most popular abdominal aortic aneurysm (AAA) grafts. The HEMASHIELD® Gold device has high patency rates and improved biocompatibility, while the HEMASHIELD® Platinum is a woven branch graft that has superior healing rates and years of proven effectiveness. The company also offers an extensive range of heparin-coated, anti-microbial and collagen-coated stent grafts.

Global Surgical Graft Market Segmentation Summary

  • Lower Limb Surgical Graft Market
  • Aorta Repair Surgical Graft Market – Further Segmented Into:
    • Anatomy: Abdominal Aortic Aneurysm Surgical Grafts and Thoracic Aortic Aneurysm Surgical Grafts.
  • Extra-Anatomical Bypass Surgical Graft Market

Research Scope Summary

Report Attribute Details
Regions North America  (Canada, United States)
Latin America  (Argentina, Bolivia, Brazil, Chile, Colombia, Costa Rica, Dominican Republic, Ecuador, Guatemala, Mexico, Panama, Paraguay, Peru, Puerto Rico, Uruguay, Venezuela)
Western Europe  (Austria, Benelux, France, Germany, Italy, Portugal, Scandinavia, Spain, Switzerland, United Kingdom)
Central & Eastern Europe  (Azerbaijan, Baltic States, Belarus, Bulgaria, Croatia, Czech Republic, Georgia, Greece, Hungary, Kazakhstan, Poland, Romania, Russia, Serbia, Slovakia, Slovenia, Turkey, Ukraine)
Middle East  (Bahrain, Iran, Israel, Kuwait, Oman, Qatar, Saudi Arabia, United Arab Emirates)
Asia Pacific  (Australia, Cambodia, China, Hong Kong, India, Indonesia, Japan, Kyrgyzstan, Macao, Malaysia, Mongolia, Myanmar, New Zealand, Pakistan, Philippines, Singapore, South Korea, Sri Lanka, Taiwan, Thailand, Uzbekistan, Vietnam)
Africa  (Algeria, Egypt, Ethiopia, Ghana, Kenya, Libya, Morocco, Nigeria, South Africa, Sudan, Uganda)
Base Year 2025
Forecast 2026-2032
Historical Data 2022-2024
Quantitative Coverage Procedure Numbers, Market Size, Market Shares, Market Forecasts, Market Growth Rates, Units Sold, and Average Selling Prices.
Qualitative Coverage Market Growth Trends, Market Limiters, Competitive Analysis & SWOT for Top Competitors, Mergers & Acquisitions, Company Profiles, Product Portfolios, FDA Recalls, Disruptive Technologies, Disease Overviews.
Data Sources Primary Interviews with Industry Leaders, Government Physician Data, Regulatory Data, Hospital Private Data, Import & Export Data,  iData Research Internal Database.

CONTACT US FOR ADDITIONAL INFORMATION

For full segmentation and any questions regarding research coverage, please contact us for a complimentary demo of the full report.

FREE Sample Report

Table of Contents

List Of Figures
List Of Charts
Research Methodology
Step 1: Project Initiation & Team Selection
Step 2: Prepare Data Systems And Perform Secondary Research
Step 3: Preparation For Interviews & Questionnaire Design
Step 4: Performing Primary Research
Step 5: Research Analysis: Establishing Baseline Estimates
Step 6: Market Forecast And Analysis
Step 7: Identify Strategic Opportunities
Step 8: Final Review And Market Release
Step 9: Customer Feedback And Market Monitoring
Impact Of Global Tariffs
Surgical Graft Market
10.1 Executive Summary
10.1.1 Global Surgical Graft Market Overview
10.1.2 Competitive Analysis
10.1.3 Procedures Included
10.1.4 Markets Included
10.1.5 Regions Included
10.2 Introduction
10.3 Procedure Numbers
10.3.1 Total Surgical Graft Procedures
10.3.2 Lower-Limb Surgical Graft Procedures
10.3.3 Aorta Repair Surgical Graft Procedures
10.3.4 Extra-Anatomical Bypass Surgical Graft Procedures
10.4 Market Overview
10.4.1 By Segment
10.4.2 By Region
10.5 Market Analysis And Forecast
10.5.1 Total Surgical Graft Market
10.5.2 Lower-Limb Surgical Graft Market
10.5.3 Aorta Repair Surgical Graft Market
10.5.3.1 AAA Surgical Graft Market
10.5.4 Extra-Anatomical Bypass Surgical Graft Market
10.6 Drivers And Limiters
10.6.1 Market Drivers
10.6.2 Market Limiters
10.7 Competitive Market Share Analysis
Abbreviations

Companies Included

·       Aachen Resonance GmbH ·       LeMaitre Vascular
·       Abbott Vascular ·       Maquet
·       Acandis GmbH ·       Medtronic
·       ACIST Medical ·       Merit Medical Systems
·       Acrostak ·       MiCroPort
·       Affluent Medical ·       Natec Medical Ltd.
·       AngioDynamics ·       Nordion
·       Argon Medical ·       Optimed
·       Asahi Intecc ·       Oscor Inc.
·       Avimedica ·       Penumbra
·       Avinger ·       Philips
·       B. Braun ·       plus Medica
·       Becton Dickinson ·       Ra Medical
·       Biosensors International Group Ltd. ·       Rafael Medical Technologies
·       BIOTRONIK ·       Reva Medical
·       Biovic ·       Rex Medical
·       Blockade Medical ·       Scitech Medical
·       Boston Scientific ·       Shockwave Medical
·       Cardinal Health ·       Sirtex
·       Cardionovum GmbH ·       SoundBite Medical Solutions
·       Cardiovascular Systems Inc. ·       Straub Medical
·       Cardiva ·       Teleflex
·       Celenova Biosciences Inc. ·       Terumo
·       Concept Medical ·       Theragenics
·       Contego Medical ·       Vascular Solutions
·       Control Medical Technology ·       Vascular Flow Technologies
·       Cook Medical ·       Vasorum
·       Endospan ·       Varian Medical Systems
·       Eurocor ·       Vivasure Medical
·       Infraredx Inc. ·       W.L. Gore
·       InSeal Medical ·       Walk Vascular
·       Jotec

Chart List

Chart 10-1: Surgical Graft Market, Global, 2025 & 2032
Chart 10-2: Surgical Graft Procedures, Global, 2025
Chart 10-3: Surgical Graft Procedures by Region, Global, 2022 – 2032
Chart 10-4: Surgical Graft Market by Segment, Global, 2022 – 2032
Chart 10-5: Surgical Graft Market by Region, Global, 2022 – 2032
Chart 10-6: Leading Competitors, Surgical Graft Market, Global, 2025

Figure List

Figure 10-1: Surgical Graft Procedures Covered
Figure 10-2: Surgical Graft Markets Covered
Figure 10-3: Surgical Graft Regions Covered, Global (1 of 2)
Figure 10-4: Surgical Graft Regions Covered, Global (2 of 2)
Figure 10-5: Surgical Graft Procedures by Segment, Global, 2022 – 2032
Figure 10-6: Surgical Graft Procedures by Region, Global, 2022 – 2032
Figure 10-7: Surgical Graft Procedures by Country, North America, 2022 – 2032
Figure 10-8: Surgical Graft Procedures by Country, Latin America, 2022 – 2032 (1 of 2)
Figure 10-9: Surgical Graft Procedures by Country, Latin America, 2022 – 2032 (2 of 2)
Figure 10-10: Surgical Graft Procedures by Country, Western Europe, 2022 – 2032
Figure 10-11: Surgical Graft Procedures by Country, Central & Eastern Europe, 2022 – 2032 (1 of 2)
Figure 10-12: Surgical Graft Procedures by Country, Central & Eastern Europe, 2022 – 2032 (2 of 2)
Figure 10-13: Surgical Graft Procedures by Country, Middle East, 2022 – 2032
Figure 10-14: Surgical Graft Procedures by Country, Asia-Pacific, 2022 – 2032 (1 of 3)
Figure 10-15: Surgical Graft Procedures by Country, Asia-Pacific, 2022 – 2032 (2 of 3)
Figure 10-16: Surgical Graft Procedures by Country, Asia-Pacific, 2022 – 2032 (3 of 3)
Figure 10-17: Surgical Graft Procedures by Country, Africa, 2022 – 2032
Figure 10-18: Lower-Limb Surgical Graft Procedures by Region, Global, 2022 – 2032
Figure 10-19: Lower-Limb Surgical Graft Procedures by Country, North America, 2022 – 2032
Figure 10-20: Lower-Limb Surgical Graft Procedures by Country, Latin America, 2022 – 2032 (1 of 2)
Figure 10-21: Lower-Limb Surgical Graft Procedures by Country, Latin America, 2022 – 2032 (2 of 2)
Figure 10-22: Lower-Limb Surgical Graft Procedures by Country, Western Europe, 2022 – 2032
Figure 10-23: Lower-Limb Surgical Graft Procedures by Country, Central & Eastern Europe, 2022 – 2032 (1 of 2)
Figure 10-24: Lower-Limb Surgical Graft Procedures by Country, Central & Eastern Europe, 2022 – 2032 (2 of 2)
Figure 10-25: Lower-Limb Surgical Graft Procedures by Country, Middle East, 2022 – 2032
Figure 10-26: Lower-Limb Surgical Graft Procedures by Country, Asia-Pacific, 2022 – 2032 (1 of 3)
Figure 10-27: Lower-Limb Surgical Graft Procedures by Country, Asia-Pacific, 2022 – 2032 (2 of 3)
Figure 10-28: Lower-Limb Surgical Graft Procedures by Country, Asia-Pacific, 2022 – 2032 (3 of 3)
Figure 10-29: Lower-Limb Surgical Graft Procedures by Country, Africa, 2022 – 2032
Figure 10-30: Aorta Repair Surgical Graft Procedures by Segment, Global, 2022 – 2032
Figure 10-31: Aorta Repair Surgical Graft Procedures by Region, Global, 2022 – 2032
Figure 10-32: Aorta Repair Surgical Graft Procedures by Country, North America, 2022 – 2032
Figure 10-33: Aorta Repair Surgical Graft Procedures by Country, Latin America, 2022 – 2032 (1 of 2)
Figure 10-34: Aorta Repair Surgical Graft Procedures by Country, Latin America, 2022 – 2032 (2 of 2)
Figure 10-35: Aorta Repair Surgical Graft Procedures by Country, Western Europe, 2022 – 2032
Figure 10-36: Aorta Repair Surgical Graft Procedures by Country, Central & Eastern Europe, 2022 – 2032 (1 of 2)
Figure 10-37: Aorta Repair Surgical Graft Procedures by Country, Central & Eastern Europe, 2022 – 2032 (2 of 2)
Figure 10-38: Aorta Repair Surgical Graft Procedures by Country, Middle East, 2022 – 2032
Figure 10-39: Aorta Repair Surgical Graft Procedures by Country, Asia-Pacific, 2022 – 2032 (1 of 3)
Figure 10-40: Aorta Repair Surgical Graft Procedures by Country, Asia-Pacific, 2022 – 2032 (2 of 3)
Figure 10-41: Aorta Repair Surgical Graft Procedures by Country, Asia-Pacific, 2022 – 2032 (3 of 3)
Figure 10-42: Aorta Repair Surgical Graft Procedures by Country, Africa, 2022 – 2032
Figure 10-43: AAA Surgical Graft Procedures by Region, Global, 2022 – 2032
Figure 10-44: AAA Surgical Graft Procedures by Country, North America, 2022 – 2032
Figure 10-45: AAA Surgical Graft Procedures by Country, Latin America, 2022 – 2032 (1 of 2)
Figure 10-46: AAA Surgical Graft Procedures by Country, Latin America, 2022 – 2032 (2 of 2)
Figure 10-47: AAA Surgical Graft Procedures by Country, Western Europe, 2022 – 2032
Figure 10-48: AAA Surgical Graft Procedures by Country, Central & Eastern Europe, 2022 – 2032 (1 of 2)
Figure 10-49: AAA Surgical Graft Procedures by Country, Central & Eastern Europe, 2022 – 2032 (2 of 2)
Figure 10-50: AAA Surgical Graft Procedures by Country, Middle East, 2022 – 2032
Figure 10-51: AAA Surgical Graft Procedures by Country, Asia-Pacific, 2022 – 2032 (1 of 3)
Figure 10-52: AAA Surgical Graft Procedures by Country, Asia-Pacific, 2022 – 2032 (2 of 3)
Figure 10-53: AAA Surgical Graft Procedures by Country, Asia-Pacific, 2022 – 2032 (3 of 3)
Figure 10-54: AAA Surgical Graft Procedures by Country, Africa, 2022 – 2032
Figure 10-55: TAA Surgical Graft Procedures by Region, Global, 2022 – 2032
Figure 10-56: TAA Surgical Graft Procedures by Country, North America, 2022 – 2032
Figure 10-57: TAA Surgical Graft Procedures by Country, Latin America, 2022 – 2032 (1 of 2)
Figure 10-58: TAA Surgical Graft Procedures by Country, Latin America, 2022 – 2032 (2 of 2)
Figure 10-59: TAA Surgical Graft Procedures by Country, Western Europe, 2022 – 2032
Figure 10-60: TAA Surgical Graft Procedures by Country, Central & Eastern Europe, 2022 – 2032 (1 of 2)
Figure 10-61: TAA Surgical Graft Procedures by Country, Central & Eastern Europe, 2022 – 2032 (2 of 2)
Figure 10-62: TAA Surgical Graft Procedures by Country, Middle East, 2022 – 2032
Figure 10-63: TAA Surgical Graft Procedures by Country, Asia-Pacific, 2022 – 2032 (1 of 3)
Figure 10-64: TAA Surgical Graft Procedures by Country, Asia-Pacific, 2022 – 2032 (2 of 3)
Figure 10-65: TAA Surgical Graft Procedures by Country, Asia-Pacific, 2022 – 2032 (3 of 3)
Figure 10-66: TAA Surgical Graft Procedures by Country, Africa, 2022 – 2032
Figure 10-67: Extra-Anatomical Bypass Surgical Graft Procedures by Region, Global, 2022 – 2032
Figure 10-68: Extra-Anatomical Bypass Surgical Graft Procedures by Country, North America, 2022 – 2032
Figure 10-69: Extra-Anatomical Bypass Surgical Graft Procedures by Country, Latin America, 2022 – 2032 (1 of 2)
Figure 10-70: Extra-Anatomical Bypass Surgical Graft Procedures by Country, Latin America, 2022 – 2032 (2 of 2)
Figure 10-71: Extra-Anatomical Bypass Surgical Graft Procedures by Country, Western Europe, 2022 – 2032
Figure 10-72: Extra-Anatomical Bypass Surgical Graft Procedures by Country, Central & Eastern Europe, 2022 – 2032 (1 of 2)
Figure 10-73: Extra-Anatomical Bypass Surgical Graft Procedures by Country, Central & Eastern Europe, 2022 – 2032 (2 of 2)
Figure 10-74: Extra-Anatomical Bypass Surgical Graft Procedures by Country, Middle East, 2022 – 2032
Figure 10-75: Extra-Anatomical Bypass Surgical Graft Procedures by Country, Asia-Pacific, 2022 – 2032 (1 of 3)
Figure 10-76: Extra-Anatomical Bypass Surgical Graft Procedures by Country, Asia-Pacific, 2022 – 2032 (2 of 3)
Figure 10-77: Extra-Anatomical Bypass Surgical Graft Procedures by Country, Asia-Pacific, 2022 – 2032 (3 of 3)
Figure 10-78: Extra-Anatomical Bypass Surgical Graft Procedures by Country, Africa, 2022 – 2032
Figure 10-79: Surgical Graft Market by Segment, Global, 2022 – 2032 (US$M)
Figure 10-80: Surgical Graft Market by Region, Global, 2022 – 2032 (US$M)
Figure 10-81: Total Surgical Graft Market, Global, 2022 – 2032
Figure 10-82: Units Sold by Region, Surgical Graft Market, Global, 2022 – 2032
Figure 10-83: Average Selling Price by Region, Surgical Graft Market, Global, 2022 – 2032 (US$)
Figure 10-84: Market Value by Region, Surgical Graft Market, Global, 2022 – 2032 (US$M)
Figure 10-85: Lower-Limb Surgical Graft Market, Global, 2022 – 2032
Figure 10-86: Units Sold by Region, Lower-Limb Surgical Graft Market, Global, 2022 – 2032
Figure 10-87: Average Selling Price by Region, Lower-Limb Surgical Graft Market, Global, 2022 – 2032 (US$)
Figure 10-88: Market Value by Region, Lower-Limb Surgical Graft Market, Global, 2022 – 2032 (US$M)
Figure 10-89: Aorta Repair Surgical Graft Market by Segment, Global, 2022 – 2032 (US$M)
Figure 10-90: Total Aorta Repair Surgical Graft Market, Global, 2022 – 2032
Figure 10-91: Units Sold by Region, Aorta Repair Surgical Graft Market, Global, 2022 – 2032
Figure 10-92: Average Selling Price by Region, Aorta Repair Surgical Graft Market, Global, 2022 – 2032 (US$)
Figure 10-93: Market Value by Region, Aorta Repair Surgical Graft Market, Global, 2022 – 2032 (US$M)
Figure 10-94: AAA Surgical Graft Surgical Graft Market, Global, 2022 – 2032
Figure 10-95: Units Sold by Region, AAA Surgical Graft Surgical Graft Market, Global, 2022 – 2032
Figure 10-96: Average Selling Price by Region, AAA Surgical Graft Surgical Graft Market, Global, 2022 – 2032 (US$)
Figure 10-97: Market Value by Region, AAA Surgical Graft Surgical Graft Market, Global, 2022 – 2032 (US$M)
Figure 10-98: TAA Surgical Graft Surgical Graft Market, Global, 2022 – 2032
Figure 10-99: Units Sold by Region, TAA Surgical Graft Surgical Graft Market, Global, 2022 – 2032
Figure 10-100: Average Selling Price by Region, TAA Surgical Graft Surgical Graft Market, Global, 2022 – 2032 (US$)
Figure 10-101: Market Value by Region, TAA Surgical Graft Surgical Graft Market, Global, 2022 – 2032 (US$M)
Figure 10-102: Extra-Anatomical Bypass Surgical Graft Market, Global, 2022 – 2032
Figure 10-103: Units Sold by Region, Extra-Anatomical Bypass Surgical Graft Market, Global, 2022 – 2032
Figure 10-104: Average Selling Price by Region, Extra-Anatomical Bypass Surgical Graft Market, Global, 2022 – 2032 (US$)
Figure 10-105: Market Value by Region, Extra-Anatomical Bypass Surgical Graft Market, Global, 2022 – 2032 (US$M)
Figure 10-106: Leading Competitors, Surgical Graft Market, Global, 2025

iData’s 9-Step Research Methodology

Our reports follow an in-depth 9-step methodology which focuses on the following research systems:

  • Original primary research that consists of the most up-to-date market data
  • Strong foundation of quantitative and qualitative research
  • Focused on the needs and strategic challenges of the industry participants

Step 1: Project Initiation & Team Selection During this preliminary investigation, all staff members involved in the industry discusses the topic in detail.

Step 2: Prepare Data Systems and Perform Secondary Research The first task of the research team is to prepare for the data collection process: Filing systems and relational databases are developed as needed.

Step 3: Preparation for Interviews & Questionnaire Design The core of all iData research reports is primary market research. Interviews with industry insiders represent the single most reliable way to obtain accurate, current data about market conditions, trends, threats and opportunities.

Step 4: Performing Primary Research At this stage, interviews are performed using contacts and information acquired in the secondary research phase.

Step 5: Research Analysis: Establishing Baseline Estimates Following the completion of the primary research phase, the collected information must be synthesized into an accurate view of the market status. The most important question is the current state of the market.

Step 6: Market Forecast and Analysis iData Research uses a proprietary method to combine statistical data and opinions of industry experts to forecast future market values.

Step 7: Identify Strategic Opportunities iData analysts identify in broad terms why some companies are gaining or losing share within a given market segment.

Step 8: Final Review and Market Release An integral part of the iData research methodology is a built-in philosophy of quality control and continuing improvement is integral to the iData philosophy.

Step 9: Customer Feedback and Market Monitoring iData philosophy of continuous improvement requires that reports and consulting projects be monitored after release for customer feedback and market accuracy.

Click Here to Read More About Our Methodology

Explore Report Options

Report Summary

FREE

Select License Type

Overall, the global surgical graft market was valued at $202 million in 2023. This is expected to increase over the forecast period at a CAGR of 1.0% to reach $217 million.

  • 2026
  • 10 Years
  • Global
  • MedCore
  • 120
  • 12/05/2025