| Figure 1‑1: Neurological Device Market Share Ranking by Segment, Global, 2025 (1 of 2) |
| Figure 1‑2: Neurological Device Market Share Ranking by Segment, Global, 2025 (2 of 2) |
| Figure 1‑3: Companies Researched in This Report (1 of 2) |
| Figure 1‑4: Companies Researched in This Report (2 of 2) |
| Figure 1‑5: Factors Impacting the Neurological Device Market by Segment, Global (1 of 3) |
| Figure 1‑6: Factors Impacting the Neurological Device Market by Segment, Global (2 of 3) |
| Figure 1‑7: Factors Impacting the Neurological Device Market by Segment, Global (3 of 3) |
| Figure 1‑8: Recent Events in the Neurological Device Market, Global, 2022 – 2026 |
| Figure 1‑9: Global Neurological Device Procedures Covered |
| Figure 1‑10: Global Neurological Device Markets Covered (1 of 2) |
| Figure 1‑11: Global Neurological Device Markets Covered (2 of 2) |
| Figure 1‑12: Neurological Device Regions Covered, Global (1 of 2) |
| Figure 1‑13: Neurological Device Regions Covered, Global (2 of 2) |
| Figure 1‑14: Key Analysis Updates |
| Figure 1‑15: Key Report Updates |
| Figure 1‑16: Version History |
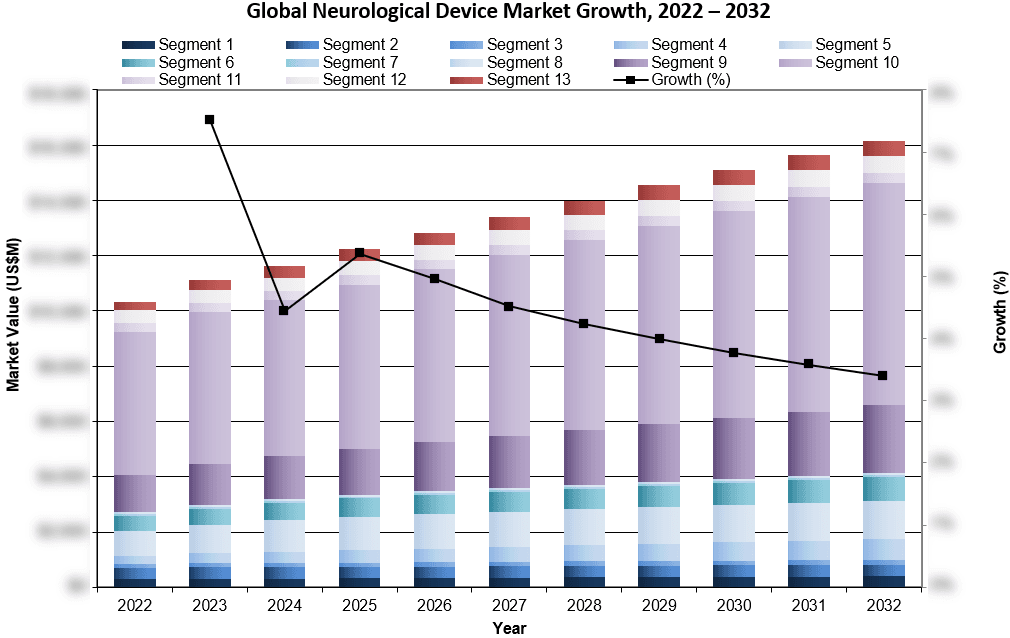
| Figure 3‑1: Neurological Device Market by Segment, Global, 2022 – 2032 (US$M) (1 of 2) |
| Figure 3‑2: Neurological Device Market by Segment, Global, 2022 – 2032 (US$M) (2 of 2) |
| Figure 3‑3: Neurological Device Market by Region, Global, 2022 – 2032 (US$M) |
| Figure 3‑4: Leading Competitors, Neurological Device Market by Segment, Global, 2025 (1 of 2) |
| Figure 3‑5: Leading Competitors, Neurological Device Market by Segment, Global, 2025 (2 of 2) |
| Figure 4‑1: Cerebrospinal Fluid Management Procedures Covered |
| Figure 4‑2: Cerebrospinal Fluid Management Markets Covered |
| Figure 4‑3: Cerebrospinal Fluid Management Regions Covered, Global (1 of 2) |
| Figure 4‑4: Cerebrospinal Fluid Management Regions Covered, Global (2 of 2) |
| Figure 4‑5: CFS Procedures by Segment, Global, 2022 – 2032 |
| Figure 4‑6: CFS Procedures by Region, Global, 2022 – 2032 |
| Figure 4‑7: CFS Procedures by Country, North America, 2022 – 2032 |
| Figure 4‑8: CFS Procedures by Country, Latin America, 2022 – 2032 (1 of 2) |
| Figure 4‑9: CFS Procedures by Country, Latin America, 2022 – 2032 (2 of 2) |
| Figure 4‑10: CFS Procedures by Country, Western Europe, 2022 – 2032 |
| Figure 4‑11: CFS Procedures by Country, Central & Eastern Europe, 2022 – 2032 (1 of 2) |
| Figure 4‑12: CFS Procedures by Country, Central & Eastern Europe, 2022 – 2032 (2 of 2) |
| Figure 4‑13: CFS Procedures by Country, Middle East, 2022 – 2032 |
| Figure 4‑14: CFS Procedures by Country, Asia-Pacific, 2022 – 2032 (1 of 3) |
| Figure 4‑15: CFS Procedures by Country, Asia-Pacific, 2022 – 2032 (2 of 3) |
| Figure 4‑16: CFS Procedures by Country, Asia-Pacific, 2022 – 2032 (3 of 3) |
| Figure 4‑17: CFS Procedures by Country, Africa, 2022 – 2032 |
| Figure 4‑18: Shunt Implantation Procedures by Region, Global, 2022 – 2032 |
| Figure 4‑19: Shunt Implantation Procedures by Country, North America, 2022 – 2032 |
| Figure 4‑20: Shunt Implantation Procedures by Country, Latin America, 2022 – 2032 (1 of 2) |
| Figure 4‑21: Shunt Implantation Procedures by Country, Latin America, 2022 – 2032 (2 of 2) |
| Figure 4‑22: Shunt Implantation Procedures by Country, Western Europe, 2022 – 2032 |
| Figure 4‑23: Shunt Implantation Procedures by Country, Central & Eastern Europe, 2022 – 2032 (1 of 2) |
| Figure 4‑24: Shunt Implantation Procedures by Country, Central & Eastern Europe, 2022 – 2032 (2 of 2) |
| Figure 4‑25: Shunt Implantation Procedures by Country, Middle East, 2022 – 2032 |
| Figure 4‑26: Shunt Implantation Procedures by Country, Asia-Pacific, 2022 – 2032 (1 of 3) |
| Figure 4‑27: Shunt Implantation Procedures by Country, Asia-Pacific, 2022 – 2032 (2 of 3) |
| Figure 4‑28: Shunt Implantation Procedures by Country, Asia-Pacific, 2022 – 2032 (3 of 3) |
| Figure 4‑29: Shunt Implantation Procedures by Country, Africa, 2022 – 2032 |
| Figure 4‑30: Shunt Replacement Procedures by Region, Global, 2022 – 2032 |
| Figure 4‑31: Shunt Replacement Procedures by Country, North America, 2022 – 2032 |
| Figure 4‑32: Shunt Replacement Procedures by Country, Latin America, 2022 – 2032 (1 of 2) |
| Figure 4‑33: Shunt Replacement Procedures by Country, Latin America, 2022 – 2032 (2 of 2) |
| Figure 4‑34: Shunt Replacement Procedures by Country, Western Europe, 2022 – 2032 |
| Figure 4‑35: Shunt Replacement Procedures by Country, Central & Eastern Europe, 2022 – 2032 (1 of 2) |
| Figure 4‑36: Shunt Replacement Procedures by Country, Central & Eastern Europe, 2022 – 2032 (2 of 2) |
| Figure 4‑37: Shunt Replacement Procedures by Country, Middle East, 2022 – 2032 |
| Figure 4‑38: Shunt Replacement Procedures by Country, Asia-Pacific, 2022 – 2032 (1 of 3) |
| Figure 4‑39: Shunt Replacement Procedures by Country, Asia-Pacific, 2022 – 2032 (2 of 3) |
| Figure 4‑40: Shunt Replacement Procedures by Country, Asia-Pacific, 2022 – 2032 (3 of 3) |
| Figure 4‑41: Shunt Replacement Procedures by Country, Africa, 2022 – 2032 |
| Figure 4‑42: Cerebrospinal Fluid Management Market by Segment, Global, 2022 – 2032 (US$M) |
| Figure 4‑43: Cerebrospinal Fluid Management Market by Region, Global, 2022 – 2032 (US$M) |
| Figure 4‑44: Cerebrospinal Fluid Management Market, Global, 2022 – 2032 |
| Figure 4‑45: Units Sold by Region, Cerebrospinal Fluid Management Market, Global, 2022 – 2032 |
| Figure 4‑46: Average Selling Price by Region, Cerebrospinal Fluid Management Market, Global, 2022 – 2032 (US$) |
| Figure 4‑47: Market Value by Region, Cerebrospinal Fluid Management Market, Global, 2022 – 2032 (US$M) |
| Figure 4‑48: Cerebrospinal Fluid Shunt Market by Segment, Global, 2022 – 2032 (US$M) |
| Figure 4‑49: Total Cerebrospinal Fluid Shunt Market, Global, 2022 – 2032 |
| Figure 4‑50: Units Sold by Region, Cerebrospinal Fluid Shunt Market, Global, 2022 – 2032 |
| Figure 4‑51: Average Selling Price by Region, Cerebrospinal Fluid Shunt Market, Global, 2022 – 2032 (US$) |
| Figure 4‑52: Market Value by Region, Cerebrospinal Fluid Shunt Market, Global, 2022 – 2032 (US$M) |
| Figure 4‑53: Adjustable Pressure Surgical Graft Market, Global, 2022 – 2032 |
| Figure 4‑54: Units Sold by Region, Adjustable Pressure Surgical Graft Market, Global, 2022 – 2032 |
| Figure 4‑55: Average Selling Price by Region, Adjustable Pressure Surgical Graft Market, Global, 2022 – 2032 (US$) |
| Figure 4‑56: Market Value by Region, Adjustable Pressure Surgical Graft Market, Global, 2022 – 2032 (US$M) |
| Figure 4‑57: Fixed Pressure Surgical Graft Market, Global, 2022 – 2032 |
| Figure 4‑58: Units Sold by Region, Fixed Pressure Surgical Graft Market, Global, 2022 – 2032 |
| Figure 4‑59: Average Selling Price by Region, Fixed Pressure Surgical Graft Market, Global, 2022 – 2032 (US$) |
| Figure 4‑60: Market Value by Region, Fixed Pressure Surgical Graft Market, Global, 2022 – 2032 (US$M) |
| Figure 4‑61: Cerebrospinal Fluid Drainage System Graft Market by Segment, Global, 2022 – 2032 (US$M) |
| Figure 4‑62: Total Cerebrospinal Fluid Drainage System Graft Market, Global, 2022 – 2032 |
| Figure 4‑63: Units Sold by Region, Cerebrospinal Fluid Drainage System Graft Market, Global, 2022 – 2032 |
| Figure 4‑64: Average Selling Price by Region, Cerebrospinal Fluid Drainage System Graft Market, Global, 2022 – 2032 (US$) |
| Figure 4‑65: Market Value by Region, Cerebrospinal Fluid Drainage System Graft Market, Global, 2022 – 2032 (US$M) |
| Figure 4‑66: Ventricular Market, Global, 2022 – 2032 |
| Figure 4‑67: Units Sold by Region, Ventricular Market, Global, 2022 – 2032 |
| Figure 4‑68: Average Selling Price by Region, Ventricular Market, Global, 2022 – 2032 (US$) |
| Figure 4‑69: Market Value by Region, Ventricular Market, Global, 2022 – 2032 (US$M) |
| Figure 4‑70: Lumbar Market, Global, 2022 – 2032 |
| Figure 4‑71: Units Sold by Region, Lumbar Market, Global, 2022 – 2032 |
| Figure 4‑72: Average Selling Price by Region, Lumbar Market, Global, 2022 – 2032 (US$) |
| Figure 4‑73: Market Value by Region, Lumbar Market, Global, 2022 – 2032 (US$M) |
| Figure 4‑74: Ventricular/Lumbar Market, Global, 2022 – 2032 |
| Figure 4‑75: Units Sold by Region, Ventricular/Lumbar Market, Global, 2022 – 2032 |
| Figure 4‑76: Average Selling Price by Region, Ventricular/Lumbar Market, Global, 2022 – 2032 (US$) |
| Figure 4‑77: Market Value by Region, Ventricular/Lumbar Market, Global, 2022 – 2032 (US$M) |
| Figure 4‑78: Leading Competitors, Cerebrospinal Fluid Management Market, Global, 2025 |
| Figure 5‑1: Detachable Coil Procedures Covered |
| Figure 5‑2: Detachable Coil Markets Covered |
| Figure 5‑3: Detachable Coil Regions Covered, Global (1 of 2) |
| Figure 5‑4: Detachable Coil Regions Covered, Global (2 of 2) |
| Figure 5‑5: Total Detachable Coil Procedures, Global, 2022 – 2032 |
| Figure 5‑6: Detachable Coil Procedures by Region, Global, 2022 – 2032 |
| Figure 5‑7: Detachable Coil Procedures by Country, North America, 2022 – 2032 |
| Figure 5‑8: Detachable Coil Procedures by Country, Latin America, 2022 – 2032 (1 of 2) |
| Figure 5‑9: Detachable Coil Procedures by Country, Latin America, 2022 – 2032 (2 of 2) |
| Figure 5‑10: Detachable Coil Procedures by Country, Western Europe, 2022 – 2032 |
| Figure 5‑11: Detachable Coil Procedures by Country, Central & Eastern Europe, 2022 – 2032 (1 of 2) |
| Figure 5‑12: Detachable Coil Procedures by Country, Central & Eastern Europe, 2022 – 2032 (2 of 2) |
| Figure 5‑13: Detachable Coil Procedures by Country, Middle East, 2022 – 2032 |
| Figure 5‑14: Detachable Coil Procedures by Country, Asia-Pacific, 2022 – 2032 (1 of 3) |
| Figure 5‑15: Detachable Coil Procedures by Country, Asia-Pacific, 2022 – 2032 (2 of 3) |
| Figure 5‑16: Detachable Coil Procedures by Country, Asia-Pacific, 2022 – 2032 (3 of 3) |
| Figure 5‑17: Detachable Coil Procedures by Country, Africa, 2022 – 2032 |
| Figure 5‑18: Detachable Coil Market by Segment, Global, 2022 – 2032 (US$M) |
| Figure 5‑19: Detachable Coil Market by Region, Global, 2022 – 2032 (US$M) |
| Figure 5‑20: Total Detachable Coil Market, Global, 2022 – 2032 |
| Figure 5‑21: Units Sold by Region, Detachable Coil Market, Global, 2022 – 2032 |
| Figure 5‑22: Average Selling Price by Region, Detachable Coil Market, Global, 2022 – 2032 (US$) |
| Figure 5‑23: Market Value by Region, Detachable Coil Market, Global, 2022 – 2032 (US$M) |
| Figure 5‑24: Bare Platinum Detachable Coil Market, Global, 2022 – 2032 |
| Figure 5‑25: Units Sold by Region, Bare Platinum Detachable Coil Market, Global, 2022 – 2032 |
| Figure 5‑26: Average Selling Price by Region, Bare Platinum Detachable Coil Market, Global, 2022 – 2032 (US$) |
| Figure 5‑27: Market Value by Region, Bare Platinum Detachable Coil Market, Global, 2022 – 2032 (US$M) |
| Figure 5‑28: Coated Detachable Coil Market, Global, 2022 – 2032 |
| Figure 5‑29: Units Sold by Region, Coated Detachable Coil Market, Global, 2022 – 2032 |
| Figure 5‑30: Average Selling Price by Region, Coated Detachable Coil Market, Global, 2022 – 2032 (US$) |
| Figure 5‑31: Market Value by Region, Coated Detachable Coil Market, Global, 2022 – 2032 (US$M) |
| Figure 5‑32: Leading Competitors, Detachable Coil Market, Global, 2025 |
| Figure 6‑1: Liquid Embolic Procedures Covered |
| Figure 6‑2: Liquid Embolic Markets Covered |
| Figure 6‑3: Liquid Embolic Regions Covered, Global (1 of 2) |
| Figure 6‑4: Liquid Embolic Regions Covered, Global (2 of 2) |
| Figure 6‑5: Total Liquid Embolic Procedures, Global, 2022 – 2032 |
| Figure 6‑6: Liquid Embolic Procedures by Region, Global, 2022 – 2032 |
| Figure 6‑7: Liquid Embolic Procedures by Country, North America, 2022 – 2032 |
| Figure 6‑8: Liquid Embolic Procedures by Country, Latin America, 2022 – 2032 (1 of 2) |
| Figure 6‑9: Liquid Embolic Procedures by Country, Latin America, 2022 – 2032 (2 of 2) |
| Figure 6‑10: Liquid Embolic Procedures by Country, Western Europe, 2022 – 2032 |
| Figure 6‑11: Liquid Embolic Procedures by Country, Central & Eastern Europe, 2022 – 2032 (1 of 2) |
| Figure 6‑12: Liquid Embolic Procedures by Country, Central & Eastern Europe, 2022 – 2032 (2 of 2) |
| Figure 6‑13: Liquid Embolic Procedures by Country, Middle East, 2022 – 2032 |
| Figure 6‑14: Liquid Embolic Procedures by Country, Asia-Pacific, 2022 – 2032 (1 of 3) |
| Figure 6‑15: Liquid Embolic Procedures by Country, Asia-Pacific, 2022 – 2032 (2 of 3) |
| Figure 6‑16: Liquid Embolic Procedures by Country, Asia-Pacific, 2022 – 2032 (3 of 3) |
| Figure 6‑17: Liquid Embolic Procedures by Country, Africa, 2022 – 2032 |
| Figure 6‑18: Liquid Embolic Market, Global, 2022 – 2032 |
| Figure 6‑19: Units Sold by Region, Liquid Embolic Market, Global, 2022 – 2032 |
| Figure 6‑20: Average Selling Price by Region, Liquid Embolic Market, Global, 2022 – 2032 (US$) |
| Figure 6‑21: Market Value by Region, Liquid Embolic Market, Global, 2022 – 2032 (US$M) |
| Figure 6‑22: Leading Competitors, Liquid Embolic Market, Global, 2025 |
| Figure 7‑1: Neurovascular Guidewire Markets Covered |
| Figure 7‑2: Neurovascular Guidewire Regions Covered, Global (1 of 2) |
| Figure 7‑3: Neurovascular Guidewire Regions Covered, Global (2 of 2) |
| Figure 7‑4: Neurovascular Guidewire Market, Global, 2022 – 2032 |
| Figure 7‑5: Units Sold by Region, Neurovascular Guidewire Market, Global, 2022 – 2032 |
| Figure 7‑6: Average Selling Price by Region, Neurovascular Guidewire Market, Global, 2022 – 2032 (US$) |
| Figure 7‑7: Market Value by Region, Neurovascular Guidewire Market, Global, 2022 – 2032 (US$M) |
| Figure 7‑8: Leading Competitors, Neurovascular Guidewire Market, Global, 2025 |
| Figure 8‑1: Neurovascular Catheter Markets Covered |
| Figure 8‑2: Neurovascular Catheter Regions Covered, Global (1 of 2) |
| Figure 8‑3: Neurovascular Catheter Regions Covered, Global (2 of 2) |
| Figure 8‑4: Neurovascular Catheter Market by Segment, Global, 2022 – 2032 (US$M) |
| Figure 8‑5: Neurovascular Catheter Market by Region, Global, 2022 – 2032 (US$M) |
| Figure 8‑6: Neurovascular Catheter Market, Global, 2022 – 2032 |
| Figure 8‑7: Units Sold by Region, Neurovascular Catheter Market, Global, 2022 – 2032 |
| Figure 8‑8: Average Selling Price by Region, Neurovascular Catheter Market, Global, 2022 – 2032 (US$) |
| Figure 8‑9: Market Value by Region, Neurovascular Catheter Market, Global, 2022 – 2032 (US$M) |
| Figure 8‑10: Over-the-Wire Microcatheter Market, Global, 2022 – 2032 |
| Figure 8‑11: Units Sold by Region, Over-the-Wire Microcatheter Market, Global, 2022 – 2032 |
| Figure 8‑12: Average Selling Price by Region, Over-the-Wire Microcatheter Market, Global, 2022 – 2032 (US$) |
| Figure 8‑13: Market Value by Region, Over-the-Wire Microcatheter Market, Global, 2022 – 2032 (US$M) |
| Figure 8‑14: Flow-Directed Microcatheter Market, Global, 2022 – 2032 |
| Figure 8‑15: Units Sold by Region, Flow-Directed Microcatheter Market, Global, 2022 – 2032 |
| Figure 8‑16: Average Selling Price by Region, Flow-Directed Microcatheter Market, Global, 2022 – 2032 (US$) |
| Figure 8‑17: Market Value by Region, Flow-Directed Microcatheter Market, Global, 2022 – 2032 (US$M) |
| Figure 8‑18: Neurovascular Guiding Catheter Market, Global, 2022 – 2032 |
| Figure 8‑19: Units Sold by Region, Neurovascular Guiding Catheter Market, Global, 2022 – 2032 |
| Figure 8‑20: Average Selling Price by Region, Neurovascular Guiding Catheter Market, Global, 2022 – 2032 (US$) |
| Figure 8‑21: Market Value by Region, Neurovascular Guiding Catheter Market, Global, 2022 – 2032 (US$M) |
| Figure 8‑22: Leading Competitors, Neurovascular Catheter Market, Global, 2025 |
| Figure 9‑1: Neurovascular Stent Procedures Covered |
| Figure 9‑2: Neurovascular Stent Markets Covered |
| Figure 9‑3: Neurovascular Stent Regions Covered, Global (1 of 2) |
| Figure 9‑4: Neurovascular Stent Regions Covered, Global (2 of 2) |
| Figure 9‑5: Neurovascular Stent Procedures by Segment, Global, 2022 – 2032 |
| Figure 9‑6: Neurovascular Stent Procedures by Region, Global, 2022 – 2032 |
| Figure 9‑7: Neurovascular Stent Procedures by Country, North America, 2022 – 2032 |
| Figure 9‑8: Neurovascular Stent Procedures by Country, Latin America, 2022 – 2032 (1 of 2) |
| Figure 9‑9: Neurovascular Stent Procedures by Country, Latin America, 2022 – 2032 (2 of 2) |
| Figure 9‑10: Neurovascular Stent Procedures by Country, Western Europe, 2022 – 2032 |
| Figure 9‑11: Neurovascular Stent Procedures by Country, Central & Eastern Europe, 2022 – 2032 (1 of 2) |
| Figure 9‑12: Neurovascular Stent Procedures by Country, Central & Eastern Europe, 2022 – 2032 (2 of 2) |
| Figure 9‑13: Neurovascular Stent Procedures by Country, Middle East, 2022 – 2032 |
| Figure 9‑14: Neurovascular Stent Procedures by Country, Asia-Pacific, 2022 – 2032 (1 of 3) |
| Figure 9‑15: Neurovascular Stent Procedures by Country, Asia-Pacific, 2022 – 2032 (2 of 3) |
| Figure 9‑16: Neurovascular Stent Procedures by Country, Asia-Pacific, 2022 – 2032 (3 of 3) |
| Figure 9‑17: Neurovascular Stent Procedures by Country, Africa, 2022 – 2032 |
| Figure 9‑18: Traditional Stent Procedures by Region, Global, 2022 – 2032 |
| Figure 9‑19: Traditional Stent Procedures by Country, North America, 2022 – 2032 |
| Figure 9‑20: Traditional Stent Procedures by Country, Latin America, 2022 – 2032 (1 of 2) |
| Figure 9‑21: Traditional Stent Procedures by Country, Latin America, 2022 – 2032 (2 of 2) |
| Figure 9‑22: Traditional Stent Procedures by Country, Western Europe, 2022 – 2032 |
| Figure 9‑23: Traditional Stent Procedures by Country, Central & Eastern Europe, 2022 – 2032 (1 of 2) |
| Figure 9‑24: Traditional Stent Procedures by Country, Central & Eastern Europe, 2022 – 2032 (2 of 2) |
| Figure 9‑25: Traditional Stent Procedures by Country, Middle East, 2022 – 2032 |
| Figure 9‑26: Traditional Stent Procedures by Country, Asia-Pacific, 2022 – 2032 (1 of 3) |
| Figure 9‑27: Traditional Stent Procedures by Country, Asia-Pacific, 2022 – 2032 (2 of 3) |
| Figure 9‑28: Traditional Stent Procedures by Country, Asia-Pacific, 2022 – 2032 (3 of 3) |
| Figure 9‑29: Traditional Stent Procedures by Country, Africa, 2022 – 2032 |
| Figure 9‑30: Flow Diversion Stent Procedures by Region, Global, 2022 – 2032 |
| Figure 9‑31: Flow Diversion Stent Procedures by Country, North America, 2022 – 2032 |
| Figure 9‑32: Flow Diversion Stent Procedures by Country, Latin America, 2022 – 2032 (1 of 2) |
| Figure 9‑33: Flow Diversion Stent Procedures by Country, Latin America, 2022 – 2032 (2 of 2) |
| Figure 9‑34: Flow Diversion Stent Procedures by Country, Western Europe, 2022 – 2032 |
| Figure 9‑35: Flow Diversion Stent Procedures by Country, Central & Eastern Europe, 2022 – 2032 (1 of 2) |
| Figure 9‑36: Flow Diversion Stent Procedures by Country, Central & Eastern Europe, 2022 – 2032 (2 of 2) |
| Figure 9‑37: Flow Diversion Stent Procedures by Country, Middle East, 2022 – 2032 |
| Figure 9‑38: Flow Diversion Stent Procedures by Country, Asia-Pacific, 2022 – 2032 (1 of 3) |
| Figure 9‑39: Flow Diversion Stent Procedures by Country, Asia-Pacific, 2022 – 2032 (2 of 3) |
| Figure 9‑40: Flow Diversion Stent Procedures by Country, Asia-Pacific, 2022 – 2032 (3 of 3) |
| Figure 9‑41: Flow Diversion Stent Procedures by Country, Africa, 2022 – 2032 |
| Figure 9‑42: Intrasaccular Stent Procedures by Region, Global, 2022 – 2032 |
| Figure 9‑43: Intrasaccular Stent Procedures by Country, North America, 2022 – 2032 |
| Figure 9‑44: Intrasaccular Stent Procedures by Country, Latin America, 2022 – 2032 (1 of 2) |
| Figure 9‑45: Intrasaccular Stent Procedures by Country, Latin America, 2022 – 2032 (2 of 2) |
| Figure 9‑46: Intrasaccular Stent Procedures by Country, Western Europe, 2022 – 2032 |
| Figure 9‑47: Intrasaccular Stent Procedures by Country, Central & Eastern Europe, 2022 – 2032 (1 of 2) |
| Figure 9‑48: Intrasaccular Stent Procedures by Country, Central & Eastern Europe, 2022 – 2032 (2 of 2) |
| Figure 9‑49: Intrasaccular Stent Procedures by Country, Middle East, 2022 – 2032 |
| Figure 9‑50: Intrasaccular Stent Procedures by Country, Asia-Pacific, 2022 – 2032 (1 of 3) |
| Figure 9‑51: Intrasaccular Stent Procedures by Country, Asia-Pacific, 2022 – 2032 (2 of 3) |
| Figure 9‑52: Intrasaccular Stent Procedures by Country, Asia-Pacific, 2022 – 2032 (3 of 3) |
| Figure 9‑53: Intrasaccular Stent Procedures by Country, Africa, 2022 – 2032 |
| Figure 9‑54: Neurovascular Stent Market by Segment, Global, 2022 – 2032 (US$M) |
| Figure 9‑55: Neurovascular Stent Market by Region, Global, 2022 – 2032 (US$M) |
| Figure 9‑56: Neurovascular Stent Market, Global, 2022 – 2032 |
| Figure 9‑57: Units Sold by Region, Neurovascular Stent Market, Global, 2022 – 2032 |
| Figure 9‑58: Average Selling Price by Region, Neurovascular Stent Market, Global, 2022 – 2032 (US$) |
| Figure 9‑59: Market Value by Region, Neurovascular Stent Market, Global, 2022 – 2032 (US$M) |
| Figure 9‑60: Traditional Neurovascular Stent Market, Global, 2022 – 2032 |
| Figure 9‑61: Units Sold by Region, Traditional Neurovascular Stent Market, Global, 2022 – 2032 |
| Figure 9‑62: Average Selling Price by Region, Traditional Neurovascular Stent Market, Global, 2022 – 2032 (US$) |
| Figure 9‑63: Market Value by Region, Traditional Neurovascular Stent Market, Global, 2022 – 2032 (US$M) |
| Figure 9‑64: Flow Diversion Stent Market, Global, 2022 – 2032 |
| Figure 9‑65: Units Sold by Region, Flow Diversion Stent Market, Global, 2022 – 2032 |
| Figure 9‑66: Average Selling Price by Region, Flow Diversion Stent Market, Global, 2022 – 2032 (US$) |
| Figure 9‑67: Market Value by Region, Flow Diversion Stent Market, Global, 2022 – 2032 (US$M) |
| Figure 9‑68: Intrasaccular Stent Market, Global, 2022 – 2032 |
| Figure 9‑69: Units Sold by Region, Intrasaccular Stent Market, Global, 2022 – 2032 |
| Figure 9‑70: Average Selling Price by Region, Intrasaccular Stent Market, Global, 2022 – 2032 (US$) |
| Figure 9‑71: Market Value by Region, Intrasaccular Stent Market, Global, 2022 – 2032 (US$M) |
| Figure 9‑72: Leading Competitors, Neurovascular Stent Market, Global, 2025 |
| Figure 10‑1: Balloon Occlusion Markets Covered |
| Figure 10‑2: Balloon Occlusion Regions Covered, Global (1 of 2) |
| Figure 10‑3: Balloon Occlusion Regions Covered, Global (2 of 2) |
| Figure 10‑4: Balloon Occlusion Market, Global, 2022 – 2032 |
| Figure 10‑5: Units Sold by Region, Balloon Occlusion Market, Global, 2022 – 2032 |
| Figure 10‑6: Average Selling Price by Region, Balloon Occlusion Market, Global, 2022 – 2032 (US$) |
| Figure 10‑7: Market Value by Region, Balloon Occlusion Market, Global, 2022 – 2032 (US$M) |
| Figure 10‑8: Leading Competitors, Balloon Occlusion Market, Global, 2025 |
| Figure 11‑1: Aneurysm Clip Procedures Covered |
| Figure 11‑2: Aneurysm Clip Markets Covered |
| Figure 11‑3: Aneurysm Clip Regions Covered, Global (1 of 2) |
| Figure 11‑4: Aneurysm Clip Regions Covered, Global (2 of 2) |
| Figure 11‑5: Total Aneurysm Treatment Procedures by Region, Global, 2022 – 2032 |
| Figure 11‑6: Total Aneurysm Treatment Procedures by Country, North America, 2022 – 2032 |
| Figure 11‑7: Total Aneurysm Treatment Procedures by Country, Latin America, 2022 – 2032 (1 of 2) |
| Figure 11‑8: Total Aneurysm Treatment Procedures by Country, Latin America, 2022 – 2032 (2 of 2) |
| Figure 11‑9: Total Aneurysm Treatment Procedures by Country, Western Europe, 2022 – 2032 |
| Figure 11‑10: Total Aneurysm Treatment Procedures by Country, Central & Eastern Europe, 2022 – 2032 (1 of 2) |
| Figure 11‑11: Total Aneurysm Treatment Procedures by Country, Central & Eastern Europe, 2022 – 2032 (2 of 2) |
| Figure 11‑12: Total Aneurysm Treatment Procedures by Country, Middle East, 2022 – 2032 |
| Figure 11‑13: Total Aneurysm Treatment Procedures by Country, Asia-Pacific, 2022 – 2032 (1 of 3) |
| Figure 11‑14: Total Aneurysm Treatment Procedures by Country, Asia-Pacific, 2022 – 2032 (2 of 3) |
| Figure 11‑15: Total Aneurysm Treatment Procedures by Country, Asia-Pacific, 2022 – 2032 (3 of 3) |
| Figure 11‑16: Total Aneurysm Treatment Procedures by Country, Africa, 2022 – 2032 |
| Figure 11‑17: Aneurysm Clip Market by Material Type, Global, 2022 – 2032 (US$M) |
| Figure 11‑18: Aneurysm Clip Market by Device Modality, Global, 2022 – 2032 (US$M) |
| Figure 11‑19: Aneurysm Clip Market by Region, Global, 2022 – 2032 (US$M) |
| Figure 11‑20: Aneurysm Clip Market, Global, 2022 – 2032 |
| Figure 11‑21: Units Sold by Region, Aneurysm Clip Market, Global, 2022 – 2032 |
| Figure 11‑22: Average Selling Price by Region, Aneurysm Clip Market, Global, 2022 – 2032 (US$) |
| Figure 11‑23: Market Value by Region, Aneurysm Clip Market, Global, 2022 – 2032 (US$M) |
| Figure 11‑24: Titanium Aneurysm Clip Market, Global, 2022 – 2032 |
| Figure 11‑25: Units Sold by Region, Titanium Aneurysm Clip Market, Global, 2022 – 2032 |
| Figure 11‑26: Average Selling Price by Region, Titanium Aneurysm Clip Market, Global, 2022 – 2032 (US$) |
| Figure 11‑27: Market Value by Region, Titanium Aneurysm Clip Market, Global, 2022 – 2032 (US$M) |
| Figure 11‑28: Cobalt Chromium Aneurysm Clip Market, Global, 2022 – 2032 |
| Figure 11‑29: Units Sold by Region, Cobalt Chromium Aneurysm Clip Market, Global, 2022 – 2032 |
| Figure 11‑30: Average Selling Price by Region, Cobalt Chromium Aneurysm Clip Market, Global, 2022 – 2032 (US$) |
| Figure 11‑31: Market Value by Region, Cobalt Chromium Aneurysm Clip Market, Global, 2022 – 2032 (US$M) |
| Figure 11‑32: Temporary Aneurysm Clip Market, Global, 2022 – 2032 |
| Figure 11‑33: Units Sold by Region, Temporary Aneurysm Clip Market, Global, 2022 – 2032 |
| Figure 11‑34: Average Selling Price by Region, Temporary Aneurysm Clip Market, Global, 2022 – 2032 (US$) |
| Figure 11‑35: Market Value by Region, Temporary Aneurysm Clip Market, Global, 2022 – 2032 (US$M) |
| Figure 11‑36: Permanent Aneurysm Clip Market, Global, 2022 – 2032 |
| Figure 11‑37: Units Sold by Region, Permanent Aneurysm Clip Market, Global, 2022 – 2032 |
| Figure 11‑38: Average Selling Price by Region, Permanent Aneurysm Clip Market, Global, 2022 – 2032 (US$) |
| Figure 11‑39: Market Value by Region, Permanent Aneurysm Clip Market, Global, 2022 – 2032 (US$M) |
| Figure 11‑40: Leading Competitors, Aneurysm Clip Market, Global, 2025 |
| Figure 12‑1: Neurovascular Thrombus Management Procedures Covered |
| Figure 12‑2: Neurovascular Thrombus Management Markets Covered |
| Figure 12‑3: Neurovascular Thrombus Management Regions Covered, Global (1 of 2) |
| Figure 12‑4: Neurovascular Thrombus Management Regions Covered, Global (2 of 2) |
| Figure 12‑5: Neurovascular Thrombus Management Procedures by Segment, Global, 2022 – 2032 |
| Figure 12‑6: Neurovascular Thrombus Management Procedures by Region, Global, 2022 – 2032 |
| Figure 12‑7: Neurovascular Thrombus Management Procedures by Country, North America, 2022 – 2032 |
| Figure 12‑8: Neurovascular Thrombus Management Procedures by Country, Latin America, 2022 – 2032 (1 of 2) |
| Figure 12‑9: Neurovascular Thrombus Management Procedures by Country, Latin America, 2022 – 2032 (2 of 2) |
| Figure 12‑10: Neurovascular Thrombus Management Procedures by Country, Western Europe, 2022 – 2032 |
| Figure 12‑11: Neurovascular Thrombus Management Procedures by Country, Central & Eastern Europe, 2022 – 2032 (1 of 2) |
| Figure 12‑12: Neurovascular Thrombus Management Procedures by Country, Central & Eastern Europe, 2022 – 2032 (2 of 2) |
| Figure 12‑13: Neurovascular Thrombus Management Procedures by Country, Middle East, 2022 – 2032 |
| Figure 12‑14: Neurovascular Thrombus Management Procedures by Country, Asia-Pacific, 2022 – 2032 (1 of 3) |
| Figure 12‑15: Neurovascular Thrombus Management Procedures by Country, Asia-Pacific, 2022 – 2032 (2 of 3) |
| Figure 12‑16: Neurovascular Thrombus Management Procedures by Country, Asia-Pacific, 2022 – 2032 (3 of 3) |
| Figure 12‑17: Neurovascular Thrombus Management Procedures by Country, Africa, 2022 – 2032 |
| Figure 12‑18: Neurovascular Thrombus Management Market by Segment, Global, 2022 – 2032 (US$M) |
| Figure 12‑19: Neurovascular Thrombus Management Market by Region, Global, 2022 – 2032 (US$M) |
| Figure 12‑20: Market Value by Region, Neurovascular Thrombus Management Market, Global, 2022 – 2032 (US$M) |
| Figure 12‑21: Stent Retriever Market, Global, 2022 – 2032 |
| Figure 12‑22: Units Sold by Region, Stent Retriever Market, Global, 2022 – 2032 |
| Figure 12‑23: Average Selling Price by Region, Stent Retriever Market, Global, 2022 – 2032 (US$) |
| Figure 12‑24: Market Value by Region, Stent Retriever Market, Global, 2022 – 2032 (US$M) |
| Figure 12‑25: Aspiration Catheter Market, Global, 2022 – 2032 |
| Figure 12‑26: Units Sold by Region, Aspiration Catheter Market, Global, 2022 – 2032 |
| Figure 12‑27: Average Selling Price by Region, Aspiration Catheter Market, Global, 2022 – 2032 (US$) |
| Figure 12‑28: Market Value by Region, Aspiration Catheter Market, Global, 2022 – 2032 (US$M) |
| Figure 12‑29: Aspiration Pump Canister Catheter Market, Global, 2022 – 2032 |
| Figure 12‑30: Units Sold by Region, Aspiration Pump Canister Catheter Market, Global, 2022 – 2032 |
| Figure 12‑31: Average Selling Price by Region, Aspiration Pump Canister Catheter Market, Global, 2022 – 2032 (US$) |
| Figure 12‑32: Market Value by Region, Aspiration Pump Canister Catheter Market, Global, 2022 – 2032 (US$M) |
| Figure 12‑33: Leading Competitors, Neurovascular Thrombus Management Market, Global, 2025 |
| Figure 13‑1: Neuromodulation Device Procedures Covered |
| Figure 13‑2: Neuromodulation Device Markets Covered |
| Figure 13‑3: Neuromodulation Device Regions Covered, Global (1 of 2) |
| Figure 13‑4: Neuromodulation Device Regions Covered, Global (2 of 2) |
| Figure 13‑5: Neuromodulation Procedures by Segment, Global, 2022 – 2032 |
| Figure 13‑6: Total Neuromodulation Procedures by Region, Global, 2022 – 2032 |
| Figure 13‑7: Total Neuromodulation Procedures by Country, North America, 2022 – 2032 |
| Figure 13‑8: Total Neuromodulation Procedures by Country, Latin America, 2022 – 2032 (1 of 2) |
| Figure 13‑9: Total Neuromodulation Procedures by Country, Latin America, 2022 – 2032 (2 of 2) |
| Figure 13‑10: Total Neuromodulation Procedures by Country, Western Europe, 2022 – 2032 |
| Figure 13‑11: Total Neuromodulation Procedures by Country, Central & Eastern Europe, 2022 – 2032 (1 of 2) |
| Figure 13‑12: Total Neuromodulation Procedures by Country, Central & Eastern Europe, 2022 – 2032 (2 of 2) |
| Figure 13‑13: Total Neuromodulation Procedures by Country, Middle East, 2022 – 2032 |
| Figure 13‑14: Total Neuromodulation Procedures by Country, Asia-Pacific, 2022 – 2032 (1 of 3) |
| Figure 13‑15: Total Neuromodulation Procedures by Country, Asia-Pacific, 2022 – 2032 (2 of 3) |
| Figure 13‑16: Total Neuromodulation Procedures by Country, Asia-Pacific, 2022 – 2032 (3 of 3) |
| Figure 13‑17: Total Neuromodulation Procedures by Country, Africa, 2022 – 2032 |
| Figure 13‑18: Spinal Cord Stimulation Procedures by Region, Global, 2022 – 2032 |
| Figure 13‑19: Spinal Cord Stimulation Procedures by Country, North America, 2022 – 2032 |
| Figure 13‑20: Spinal Cord Stimulation Procedures by Country, Latin America, 2022 – 2032 (1 of 2) |
| Figure 13‑21: Spinal Cord Stimulation Procedures by Country, Latin America, 2022 – 2032 (2 of 2) |
| Figure 13‑22: Spinal Cord Stimulation Procedures by Country, Western Europe, 2022 – 2032 |
| Figure 13‑23: Spinal Cord Stimulation Procedures by Country, Central & Eastern Europe, 2022 – 2032 (1 of 2) |
| Figure 13‑24: Spinal Cord Stimulation Procedures by Country, Central & Eastern Europe, 2022 – 2032 (2 of 2) |
| Figure 13‑25: Spinal Cord Stimulation Procedures by Country, Middle East, 2022 – 2032 |
| Figure 13‑26: Spinal Cord Stimulation Procedures by Country, Asia-Pacific, 2022 – 2032 (1 of 3) |
| Figure 13‑27: Spinal Cord Stimulation Procedures by Country, Asia-Pacific, 2022 – 2032 (2 of 3) |
| Figure 13‑28: Spinal Cord Stimulation Procedures by Country, Asia-Pacific, 2022 – 2032 (3 of 3) |
| Figure 13‑29: Spinal Cord Stimulation Procedures by Country, Africa, 2022 – 2032 |
| Figure 13‑30: Deep Brain Stimulation Procedures by Region, Global, 2022 – 2032 |
| Figure 13‑31: Deep Brain Stimulation Procedures by Country, North America, 2022 – 2032 |
| Figure 13‑32: Deep Brain Stimulation Procedures by Country, Latin America, 2022 – 2032 (1 of 2) |
| Figure 13‑33: Deep Brain Stimulation Procedures by Country, Latin America, 2022 – 2032 (2 of 2) |
| Figure 13‑34: Deep Brain Stimulation Procedures by Country, Western Europe, 2022 – 2032 |
| Figure 13‑35: Deep Brain Stimulation Procedures by Country, Central & Eastern Europe, 2022 – 2032 (1 of 2) |
| Figure 13‑36: Deep Brain Stimulation Procedures by Country, Central & Eastern Europe, 2022 – 2032 (2 of 2) |
| Figure 13‑37: Deep Brain Stimulation Procedures by Country, Middle East, 2022 – 2032 |
| Figure 13‑38: Deep Brain Stimulation Procedures by Country, Asia-Pacific, 2022 – 2032 (1 of 3) |
| Figure 13‑39: Deep Brain Stimulation Procedures by Country, Asia-Pacific, 2022 – 2032 (2 of 3) |
| Figure 13‑40: Deep Brain Stimulation Procedures by Country, Asia-Pacific, 2022 – 2032 (3 of 3) |
| Figure 13‑41: Deep Brain Stimulation Procedures by Country, Africa, 2022 – 2032 |
| Figure 13‑42: Sacral Nerve Stimulation Procedures by Region, Global, 2022 – 2032 |
| Figure 13‑43: Sacral Nerve Stimulation Procedures by Country, North America, 2022 – 2032 |
| Figure 13‑44: Sacral Nerve Stimulation Procedures by Country, Latin America, 2022 – 2032 (1 of 2) |
| Figure 13‑45: Sacral Nerve Stimulation Procedures by Country, Latin America, 2022 – 2032 (2 of 2) |
| Figure 13‑46: Sacral Nerve Stimulation Procedures by Country, Western Europe, 2022 – 2032 |
| Figure 13‑47: Sacral Nerve Stimulation Procedures by Country, Central & Eastern Europe, 2022 – 2032 (1 of 2) |
| Figure 13‑48: Sacral Nerve Stimulation Procedures by Country, Central & Eastern Europe, 2022 – 2032 (2 of 2) |
| Figure 13‑49: Sacral Nerve Stimulation Procedures by Country, Middle East, 2022 – 2032 |
| Figure 13‑50: Sacral Nerve Stimulation Procedures by Country, Asia-Pacific, 2022 – 2032 (1 of 3) |
| Figure 13‑51: Sacral Nerve Stimulation Procedures by Country, Asia-Pacific, 2022 – 2032 (2 of 3) |
| Figure 13‑52: Sacral Nerve Stimulation Procedures by Country, Asia-Pacific, 2022 – 2032 (3 of 3) |
| Figure 13‑53: Sacral Nerve Stimulation Procedures by Country, Africa, 2022 – 2032 |
| Figure 13‑54: Vagus Nerve Stimulation Procedures by Region, Global, 2022 – 2032 |
| Figure 13‑55: Vagus Nerve Stimulation Procedures by Country, North America, 2022 – 2032 |
| Figure 13‑56: Vagus Nerve Stimulation Procedures by Country, Latin America, 2022 – 2032 (1 of 2) |
| Figure 13‑57: Vagus Nerve Stimulation Procedures by Country, Latin America, 2022 – 2032 (2 of 2) |
| Figure 13‑58: Vagus Nerve Stimulation Procedures by Country, Western Europe, 2022 – 2032 |
| Figure 13‑59: Vagus Nerve Stimulation Procedures by Country, Central & Eastern Europe, 2022 – 2032 (1 of 2) |
| Figure 13‑60: Vagus Nerve Stimulation Procedures by Country, Central & Eastern Europe, 2022 – 2032 (2 of 2) |
| Figure 13‑61: Vagus Nerve Stimulation Procedures by Country, Middle East, 2022 – 2032 |
| Figure 13‑62: Vagus Nerve Stimulation Procedures by Country, Asia-Pacific, 2022 – 2032 (1 of 3) |
| Figure 13‑63: Vagus Nerve Stimulation Procedures by Country, Asia-Pacific, 2022 – 2032 (2 of 3) |
| Figure 13‑64: Vagus Nerve Stimulation Procedures by Country, Asia-Pacific, 2022 – 2032 (3 of 3) |
| Figure 13‑65: Vagus Nerve Stimulation Procedures by Country, Africa, 2022 – 2032 |
| Figure 13‑66: Gastric Electric Stimulation Procedures by Region, Global, 2022 – 2032 |
| Figure 13‑67: Gastric Electric Stimulation Procedures by Country, North America, 2022 – 2032 |
| Figure 13‑68: Gastric Electric Stimulation Procedures by Country, Latin America, 2022 – 2032 (1 of 2) |
| Figure 13‑69: Gastric Electric Stimulation Procedures by Country, Latin America, 2022 – 2032 (2 of 2) |
| Figure 13‑70: Gastric Electric Stimulation Procedures by Country, Western Europe, 2022 – 2032 |
| Figure 13‑71: Gastric Electric Stimulation Procedures by Country, Central & Eastern Europe, 2022 – 2032 (1 of 2) |
| Figure 13‑72: Gastric Electric Stimulation Procedures by Country, Central & Eastern Europe, 2022 – 2032 (2 of 2) |
| Figure 13‑73: Gastric Electric Stimulation Procedures by Country, Middle East, 2022 – 2032 |
| Figure 13‑74: Gastric Electric Stimulation Procedures by Country, Asia-Pacific, 2022 – 2032 (1 of 3) |
| Figure 13‑75: Gastric Electric Stimulation Procedures by Country, Asia-Pacific, 2022 – 2032 (2 of 3) |
| Figure 13‑76: Gastric Electric Stimulation Procedures by Country, Asia-Pacific, 2022 – 2032 (3 of 3) |
| Figure 13‑77: Gastric Electric Stimulation Procedures by Country, Africa, 2022 – 2032 |
| Figure 13‑78: Neuromodulation Device Market by Segment, Global, 2022 – 2032 (US$M) |
| Figure 13‑79: Neuromodulation Device Market by Region, Global, 2022 – 2032 (US$M) |
| Figure 13‑80: Neuromodulation Device Market, Global, 2022 – 2032 |
| Figure 13‑81: Units Sold by Region, Neuromodulation Device Market, Global, 2022 – 2032 |
| Figure 13‑82: Average Selling Price by Region, Neuromodulation Device Market, Global, 2022 – 2032 (US$) |
| Figure 13‑83: Market Value by Region, Neuromodulation Device Market, Global, 2022 – 2032 (US$M) |
| Figure 13‑84: Spinal Cord Stimulation Market by Segment, Global, 2022 – 2032 (US$M) |
| Figure 13‑85: Spinal Cord Stimulation Market, Global, 2022 – 2032 |
| Figure 13‑86: Units Sold by Region, Spinal Cord Stimulation Market, Global, 2022 – 2032 |
| Figure 13‑87: Average Selling Price by Region, Spinal Cord Stimulation Market, Global, 2022 – 2032 (US$) |
| Figure 13‑88: Market Value by Region, Spinal Cord Stimulation Market, Global, 2022 – 2032 (US$M) |
| Figure 13‑89: Generator Market, Global, 2022 – 2032 |
| Figure 13‑90: Units Sold by Region, Generator Market, Global, 2022 – 2032 |
| Figure 13‑91: Average Selling Price by Region, Generator Market, Global, 2022 – 2032 (US$) |
| Figure 13‑92: Market Value by Region, Generator Market, Global, 2022 – 2032 (US$M) |
| Figure 13‑93: Lead Market, Global, 2022 – 2032 |
| Figure 13‑94: Units Sold by Region, Lead Market, Global, 2022 – 2032 |
| Figure 13‑95: Average Selling Price by Region, Lead Market, Global, 2022 – 2032 (US$) |
| Figure 13‑96: Market Value by Region, Lead Market, Global, 2022 – 2032 (US$M) |
| Figure 13‑97: Deep Brain Stimulation Market, Global, 2022 – 2032 |
| Figure 13‑98: Units Sold by Region, Deep Brain Stimulation Market, Global, 2022 – 2032 |
| Figure 13‑99: Average Selling Price by Region, Deep Brain Stimulation Market, Global, 2022 – 2032 (US$) |
| Figure 13‑100: Market Value by Region, Deep Brain Stimulation Market, Global, 2022 – 2032 (US$M) |
| Figure 13‑101: Sacral Nerve Stimulation Market, Global, 2022 – 2032 |
| Figure 13‑102: Units Sold by Region, Sacral Nerve Stimulation Market, Global, 2022 – 2032 |
| Figure 13‑103: Average Selling Price by Region, Sacral Nerve Stimulation Market, Global, 2022 – 2032 (US$) |
| Figure 13‑104: Market Value by Region, Sacral Nerve Stimulation Market, Global, 2022 – 2032 (US$M) |
| Figure 13‑105: Vagus Nerve Stimulation Market, Global, 2022 – 2032 |
| Figure 13‑106: Units Sold by Region, Vagus Nerve Stimulation Market, Global, 2022 – 2032 |
| Figure 13‑107: Average Selling Price by Region, Vagus Nerve Stimulation Market, Global, 2022 – 2032 (US$) |
| Figure 13‑108: Market Value by Region, Vagus Nerve Stimulation Market, Global, 2022 – 2032 (US$M) |
| Figure 13‑109: Gastric Electric Stimulation Market, Global, 2022 – 2032 |
| Figure 13‑110: Units Sold by Region, Gastric Electric Stimulation Market, Global, 2022 – 2032 |
| Figure 13‑111: Average Selling Price by Region, Gastric Electric Stimulation Market, Global, 2022 – 2032 (US$) |
| Figure 13‑112: Market Value by Region, Gastric Electric Stimulation Market, Global, 2022 – 2032 (US$M) |
| Figure 13‑113: Leading Competitors, Neuromodulation Device Market, Global, 2025 |
| Figure 14‑1: Intrathecal Pump Procedures Covered |
| Figure 14‑2: Intrathecal Pump Markets Covered |
| Figure 14‑3: Intrathecal Pump Regions Covered, Global (1 of 2) |
| Figure 14‑4: Intrathecal Pump Regions Covered, Global (2 of 2) |
| Figure 14‑5: Total Intrathecal Pump Procedures, Global, 2022 – 2032 |
| Figure 14‑6: Intrathecal Pump Procedures by Region, Global, 2022 – 2032 |
| Figure 14‑7: Intrathecal Pump Procedures by Country, North America, 2022 – 2032 |
| Figure 14‑8: Intrathecal Pump Procedures by Country, Latin America, 2022 – 2032 (1 of 2) |
| Figure 14‑9: Intrathecal Pump Procedures by Country, Latin America, 2022 – 2032 (2 of 2) |
| Figure 14‑10: Intrathecal Pump Procedures by Country, Western Europe, 2022 – 2032 |
| Figure 14‑11: Intrathecal Pump Procedures by Country, Central & Eastern Europe, 2022 – 2032 (1 of 2) |
| Figure 14‑12: Intrathecal Pump Procedures by Country, Central & Eastern Europe, 2022 – 2032 (2 of 2) |
| Figure 14‑13: Intrathecal Pump Procedures by Country, Middle East, 2022 – 2032 |
| Figure 14‑14: Intrathecal Pump Procedures by Country, Asia-Pacific, 2022 – 2032 (1 of 3) |
| Figure 14‑15: Intrathecal Pump Procedures by Country, Asia-Pacific, 2022 – 2032 (2 of 3) |
| Figure 14‑16: Intrathecal Pump Procedures by Country, Asia-Pacific, 2022 – 2032 (3 of 3) |
| Figure 14‑17: Intrathecal Pump Procedures by Country, Africa, 2022 – 2032 |
| Figure 14‑18: Intrathecal Pump Market, Global, 2022 – 2032 |
| Figure 14‑19: Units Sold by Region, Intrathecal Pump Market, Global, 2022 – 2032 |
| Figure 14‑20: Average Selling Price by Region, Intrathecal Pump Market, Global, 2022 – 2032 (US$) |
| Figure 14‑21: Market Value by Region, Intrathecal Pump Market, Global, 2022 – 2032 (US$M) |
| Figure 14‑22: Leading Competitors, Intrathecal Pump Market, Global, 2025 |
| Figure 15‑1: Stereotactic Device Markets Covered |
| Figure 15‑2: Stereotactic Regions Covered, Global (1 of 2) |
| Figure 15‑3: Stereotactic Regions Covered, Global (2 of 2) |
| Figure 15‑4: Stereotactic Device Market by Segment, Global, 2022 – 2032 (US$M) |
| Figure 15‑5: Stereotactic Device Market by Region, Global, 2022 – 2032 (US$M) |
| Figure 15‑6: Total Stereotactic Device Market, Global, 2022 – 2032 |
| Figure 15‑7: Units Sold by Region, Stereotactic Device Market, Global, 2022 – 2032 |
| Figure 15‑8: Average Selling Price by Region, Stereotactic Device Market, Global, 2022 – 2032 (US$) |
| Figure 15‑9: Market Value by Region, Stereotactic Device Market, Global, 2022 – 2032 (US$M) |
| Figure 15‑10: Frame-Based Stereotactic Device Market, Global, 2022 – 2032 |
| Figure 15‑11: Units Sold by Region, Frame-Based Stereotactic Device Market, Global, 2022 – 2032 |
| Figure 15‑12: Average Selling Price by Region, Frame-Based Stereotactic Device Market, Global, 2022 – 2032 (US$) |
| Figure 15‑13: Market Value by Region, Frame-Based Stereotactic Device Market, Global, 2022 – 2032 (US$M) |
| Figure 15‑14: Frameless Stereotactic Device Market, Global, 2022 – 2032 |
| Figure 15‑15: Units Sold by Region, Frameless Stereotactic Device Market, Global, 2022 – 2032 |
| Figure 15‑16: Average Selling Price by Region, Frameless Stereotactic Device Market, Global, 2022 – 2032 (US$) |
| Figure 15‑17: Market Value by Region, Frameless Stereotactic Device Market, Global, 2022 – 2032 (US$M) |
| Figure 15‑18: Leading Competitors, Stereotactic Market, Global, 2025 |
| Figure 16‑1: Ultrasonic Aspiration Procedures Covered |
| Figure 16‑2: Ultrasonic Aspirator Markets Covered |
| Figure 16‑3: Ultrasonic Aspirator Regions Covered, Global (1 of 2) |
| Figure 16‑4: Ultrasonic Aspirator Regions Covered, Global (2 of 2) |
| Figure 16‑5: Total Ultrasonic Aspiration Procedures by Region, Global, 2022 – 2032 |
| Figure 16‑6: Ultrasonic Aspiration Procedures by Country, North America, 2022 – 2032 |
| Figure 16‑7: Ultrasonic Aspiration Procedures by Country, Latin America, 2022 – 2032 (1 of 2) |
| Figure 16‑8: Ultrasonic Aspiration Procedures by Country, Latin America, 2022 – 2032 (2 of 2) |
| Figure 16‑9: Ultrasonic Aspiration Procedures by Country, Western Europe, 2022 – 2032 |
| Figure 16‑10: Ultrasonic Aspiration Procedures by Country, Central & Eastern Europe, 2022 – 2032 (1 of 2) |
| Figure 16‑11: Ultrasonic Aspiration Procedures by Country, Central & Eastern Europe, 2022 – 2032 (2 of 2) |
| Figure 16‑12: Ultrasonic Aspiration Procedures by Country, Middle East, 2022 – 2032 |
| Figure 16‑13: Ultrasonic Aspiration Procedures by Country, Asia-Pacific, 2022 – 2032 (1 of 3) |
| Figure 16‑14: Ultrasonic Aspiration Procedures by Country, Asia-Pacific, 2022 – 2032 (2 of 3) |
| Figure 16‑15: Ultrasonic Aspiration Procedures by Country, Asia-Pacific, 2022 – 2032 (3 of 3) |
| Figure 16‑16: Ultrasonic Aspiration Procedures by Country, Africa, 2022 – 2032 |
| Figure 16‑17: Ultrasonic Aspirator Market by Segment, Global, 2022 – 2032 (US$M) |
| Figure 16‑18: Ultrasonic Aspirator Market by Region, Global, 2022 – 2032 (US$M) |
| Figure 16‑19: Ultrasonic Aspirator Market, Global, 2022 – 2032 |
| Figure 16‑20: Units Sold by Region, Ultrasonic Aspirator Market, Global, 2022 – 2032 |
| Figure 16‑21: Average Selling Price by Region, Ultrasonic Aspirator Market, Global, 2022 – 2032 (US$) |
| Figure 16‑22: Market Value by Region, Ultrasonic Aspirator Market, Global, 2022 – 2032 (US$M) |
| Figure 16‑23: Capital Equipment Market, Global, 2022 – 2032 |
| Figure 16‑24: Units Sold by Region, Capital Equipment Market, Global, 2022 – 2032 |
| Figure 16‑25: Average Selling Price by Region, Capital Equipment Market, Global, 2022 – 2032 (US$) |
| Figure 16‑26: Market Value by Region, Capital Equipment Market, Global, 2022 – 2032 (US$M) |
| Figure 16‑27: Disposable Probe Tip Market, Global, 2022 – 2032 |
| Figure 16‑28: Units Sold by Region, Disposable Probe Tip Market, Global, 2022 – 2032 |
| Figure 16‑29: Average Selling Price by Region, Disposable Probe Tip Market, Global, 2022 – 2032 (US$) |
| Figure 16‑30: Market Value by Region, Disposable Probe Tip Market, Global, 2022 – 2032 (US$M) |
| Figure 16‑31: Disposable Tubing Market, Global, 2022 – 2032 |
| Figure 16‑32: Units Sold by Region, Disposable Tubing Market, Global, 2022 – 2032 |
| Figure 16‑33: Average Selling Price by Region, Disposable Tubing Market, Global, 2022 – 2032 (US$) |
| Figure 16‑34: Market Value by Region, Disposable Tubing Market, Global, 2022 – 2032 (US$M) |
| Figure 16‑35: Handpiece Market, Global, 2022 – 2032 |
| Figure 16‑36: Units Sold by Region, Handpiece Market, Global, 2022 – 2032 |
| Figure 16‑37: Average Selling Price by Region, Handpiece Market, Global, 2022 – 2032 (US$) |
| Figure 16‑38: Market Value by Region, Handpiece Market, Global, 2022 – 2032 (US$M) |
| Figure 16‑39: Accessories Market, Global, 2022 – 2032 |
| Figure 16‑40: Units Sold by Region, Accessories Market, Global, 2022 – 2032 |
| Figure 16‑41: Average Selling Price by Region, Accessories Market, Global, 2022 – 2032 (US$) |
| Figure 16‑42: Market Value by Region, Accessories Market, Global, 2022 – 2032 (US$M) |
| Figure 16‑43: Leading Competitors, Ultrasonic Aspirator Market, Global, 2025 |