| Figure 1‑1: Gastrointestinal Endoscopic Device Market Share Ranking by Segment, Global, 2021 (1 of 2) |
| Figure 1‑2: Gastrointestinal Endoscopic Device Market Share Ranking by Segment, Global, 2021 (2 of 2) |
| Figure 1‑3: Companies Researched in this Report (1 of 2) |
| Figure 1‑4: Companies Researched in this Report (2 of 2) |
| Figure 1‑5: Factors Impacting the Gastrointestinal Endoscopic Device Market by Segment, Global (1 of 2) |
| Figure 1‑6: Factors Impacting the Gastrointestinal Endoscopic Device Market by Segment, Global (2 of 2) |
| Figure 1‑7: Recent Events in the Gastrointestinal Endoscopic Device Market, Global, 2018 – 2022 (1 of 3) |
| Figure 1‑8: Recent Events in the Gastrointestinal Endoscopic Device Market, Global, 2018 – 2022 (2 of 3) |
| Figure 1‑9: Recent Events in the Gastrointestinal Endoscopic Device Market, Global, 2018 – 2022 (3 of 3) |
| Figure 1‑10: Gastrointestinal Endoscopic Device Procedures Covered |
| Figure 1‑11: Gastrointestinal Endoscopic Device Markets Covered |
| Figure 1‑12: Gastrointestinal Endoscopic Device Regions Covered, Global (1 of 2) |
| Figure 1‑13: Gastrointestinal Endoscopic Device Regions Covered, Global (2 of 2) |
| Figure 1‑14: Version History |
| Figure 2‑1: Gastrointestinal Endoscopic Device Market by Segment, Worst Case Scenario, Global, 2018 – 2028 (US$M) |
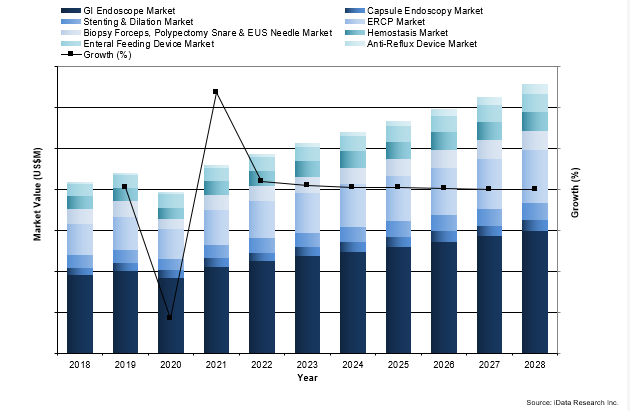
| Figure 2‑2: Gastrointestinal Endoscopic Device Market by Segment, Base Case Scenario, Global, 2018 – 2028 (US$M) |
| Figure 2‑3: Gastrointestinal Endoscopic Device Market by Segment, Best Case Scenario, Global, 2018 – 2028 (US$M) |
| Figure 4‑1: FIT-DNA Test Devices by Company |
| Figure 4‑2: Gastrointestinal Endoscopy by Company (1 of 4) |
| Figure 4‑3: Gastrointestinal Endoscopy by Company (2 of 4) |
| Figure 4‑4: Gastrointestinal Endoscopy by Company (3 of 4) |
| Figure 4‑5: Gastrointestinal Endoscopy by Company (4 of 4) |
| Figure 4‑6: Capsule Endoscopy by Company |
| Figure 4‑7: Virtual Colonoscopy by Company |
| Figure 4‑8: Endoscope Distal Attachment Cap by Company |
| Figure 4‑9: Endoscopic Submucosal Dissection Knives by Company |
| Figure 4‑10: Stenting and Dilation Devices by Company (1 of 2) |
| Figure 4‑11: Stenting and Dilation Devices by Company (2 of 2) |
| Figure 4‑12: Submucosal Lifting Agents by Company |
| Figure 4‑13: ERCP Devices by Company (1 of 4) |
| Figure 4‑14: ERCP Devices by Company (2 of 4) |
| Figure 4‑15: ERCP Devices by Company (3 of 4) |
| Figure 4‑16: ERCP Devices by Company (4 of 4) |
| Figure 4‑17: Biopsy Forceps, Polypectomy Snares, Fine Aspiration Needles by Company |
| Figure 4‑18: Foreign Body Retrieval and Specimen Removal Devices by Company (1 of 2) |
| Figure 4‑19: Foreign Body Retrieval and Specimen Removal Devices by Company (2 of 2) |
| Figure 4‑20: Hemostasis Devices by Company |
| Figure 4‑21: Enteral Feeding Devices by Company (1 of 3) |
| Figure 4‑22: Enteral Feeding Devices by Company (2 of 3) |
| Figure 4‑23: Enteral Feeding Devices by Company (3 of 3) |
| Figure 4‑24: Anti-Reflux Devices by Company |
| Figure 4‑25: Barrett’s Esophagus Ablation Devices by Company |
| Figure 4‑26: Class 2 Device Recall CORFLO Percutaneous Endoscopic Gastrostomy (PEG) Kit |
| Figure 4‑27: Class 2 Device Recall CORFLO Percutaneous Endoscopic Gastrostomy (PEG)Kit |
| Figure 4‑28: Class 2 Device Recall AVANOS MICKEY SF Gastrostomy Feeding Tube |
| Figure 4‑29: Class 2 Device Recall CORFLO NG/NI Pediatric Neonatal Feeding Tube w/ AntiIV Connector |
| Figure 4‑30: Class 2 Device Recall Captivator Polypectomy Snare 27mm, Hexagonal Loop |
| Figure 4‑31: Class 2 Device Recall WallFlexTM Biliary RX Fully Covered Stent System RMV |
| Figure 4‑32: Class 2 Device Recall ConMed Anchor Tissue Retrieval System 10 MM |
| Figure 4‑33: Class 2 Device Recall Captura Serrated Forceps with Spike |
| Figure 4‑34: Class 2 Device Recall Captura Serrated Large Forcep |
| Figure 4‑35: Class 2 Device Recall EVIS EXERA Duodenovideoscopes OLYMPUS JF140F |
| Figure 4‑36: Class 2 Device Recall Ultrasound Gastroscopes, Gastroscopes, Colonoscopes and Duodenoscopes |
| Figure 4‑37: Class 2 Device Recall Olympus CHFCB30S Choledoscope |
| Figure 4‑38: Class 2 Device Recall Ultrasonic Gastrovideoscope/ Endoscopic Ultrasound Endoscopes |
| Figure 4‑39: Class 2 Device Recall Pentax Video Duodenoscope |
| Figure 4‑40: Class 2 Device Recall Video Colonoscope EC34i10L Video Colonoscope EC38i10L |
| Figure 4‑41: Class 2 Device Recall LINX Reflux Management System |
| Figure 4‑42: Development of Applications of PillCam™ Endoscopy and Patency Systems and Clinical Evaluation of Their Performance in Healthy Volunteers ("HEIGHT" Study) |
| Figure 4‑43: Study of Early Endocapsule (EC) in Clinical Decision Unit Versus Standard of Care Work-up for GI Bleeding |
| Figure 4‑44: Evaluation of Obscure Gastrointestinal Bleeding Patients With Conventional Capsule Endoscopy and Panoramic Side View Capsule Endoscopy |
| Figure 4‑45: AXIOS™ for Gallbladder Drainage as an Alternative to Percutaneous Drainage IDE |
| Figure 4‑46: Plastic vs. Fully Covered Self Expanding Stents (FCSEMS) for Treatment of Anastomotic Bile Leaks |
| Figure 4‑47: Self-expandable Metal Stents Versus Multiple Plastic Stents for Palliation of Biliary Obstruction |
| Figure 4‑48: Intraintestinal Extended Biliary Stents Preventing Duodenobiliary Reflux in Patients With Biliary Stricture |
| Figure 4‑49: Three Arm Rand Trial of HD Light vs Reveal® Cap vs Endocuff Cap for Detection of Colorectal Adenomas (TRACE) (TRACE) |
| Figure 4‑50: Initial Case Series With Exalt Single-Use Duodenoscope |
| Figure 4‑51: Global Prospective Case Series Using a Single-Use Duodenoscope |
| Figure 4‑52: Reusable Versus Disposable Duodenoscopes for ERCP |
| Figure 4‑53: Single Use ERCP -SURE Study (SURE) |
| Figure 4‑54: Monopolar Current Cutting Knife vs Bipolar RFA Knife |
| Figure 4‑55: Effectiveness of Multi-target FIT-DNA Analysis as a Colorectal Cancer Screening Test |
| Figure 4‑56: Comparison of Using Regular or Rotary Polypectomy Snare for the Resection of Colorectal Polyps |
| Figure 4‑57: Fine Needle Biopsy of Solid Pancreatic Mass Lesions |
| Figure 4‑58: The Use of Over-the-scope-clip for Prevention of Rebleeding in High Risk Peptic Ulcers |
| Figure 4‑59: Carvedilol Versus Endoscopic Band Ligation for Primary Prophylaxis of Oesophageal Variceal Bleeding |
| Figure 4‑60: The Effect of Rubber Band Ligation in Bleeding Internal Hemorrhoids. |
| Figure 4‑61: Optimal Feeding Tube Placement |
| Figure 4‑62: Feasibility Study to Evaluate Safety of ENvizion Medical™ ENVUE™ System |
| Figure 4‑63: Comparative Study Between Two Routes of Enteral Feeding |
| Figure 4‑64: LINX Reflux Management System or Fundoplication Clinical Study in Patients With Hiatal Hernia >3 cm |
| Figure 5‑1: Gastrointestinal Endoscopic Device Market by Segment, Global, 2018 – 2028 (US$M) |
| Figure 5‑2: Gastrointestinal Endoscopic Device Market by Region, Global, 2018 – 2028 (US$M) |
| Figure 5‑3: Leading Competitors, Gastrointestinal Endoscopic Device Market by Segment, Global, 2021 |
| Figure 5‑4: List of Other Competitors, Gastrointestinal Endoscopic Device Market, Global, 2021 (1 of 2) |
| Figure 5‑5: List of Other Competitors, Gastrointestinal Endoscopic Device Market, Global, 2021 (2 of 2) |
| Figure 5‑6: SWOT Analysis, Avanos Medical |
| Figure 5‑7: SWOT Analysis, Boston Scientific |
| Figure 5‑8: SWOT Analysis, Cardinal Health |
| Figure 5‑9: SWOT Analysis, CONMED |
| Figure 5‑10: SWOT Analysis, Cook Medical |
| Figure 5‑11: SWOT EndoGastric Solutions |
| Figure 5‑12: SWOT Analysis, ERBE |
| Figure 5‑13: SWOT Analysis, Exact Sciences |
| Figure 5‑14: SWOT Analysis, Fujifilm |
| Figure 5‑15: SWOT Analysis, GE Healthcare |
| Figure 5‑16: SWOT Analysis, Johnson & Johnson |
| Figure 5‑17: SWOT Analysis, Medline |
| Figure 5‑18: SWOT Analysis, Medtronic (1 of 2) |
| Figure 5‑19: SWOT Analysis, Medtronic (2 of 2) |
| Figure 5‑20: SWOT Analysis, Moog |
| Figure 5‑21: SWOT Analysis, Olympus |
| Figure 5‑22: SWOT Analysis, Pentax |
| Figure 5‑23: SWOT Analysis, STERIS |
| Figure 6‑1: Gastrointestinal Endoscope Procedures Covered |
| Figure 6‑2: Gastrointestinal Endoscope Markets Covered |
| Figure 6‑3: Gastrointestinal Endoscope Regions Covered, Global (1 of 2) |
| Figure 6‑4: Gastrointestinal Endoscope Regions Covered, Global (2 of 2) |
| Figure 6‑5: Gastrointestinal Endoscopy Procedures by Segment, Global, 2018 – 2028 |
| Figure 6‑6: Gastrointestinal Endoscopy Procedures by Region, Global, 2018 – 2028 |
| Figure 6‑7: Gastrointestinal Endoscopy Procedures by Country, North America, 2018 – 2028 |
| Figure 6‑8: Gastrointestinal Endoscopy Procedures by Country, Latin America, 2018 – 2028 (1 of 2) |
| Figure 6‑9: Gastrointestinal Endoscopy Procedures by Country, Latin America, 2018 – 2028 (2 of 2) |
| Figure 6‑10: Gastrointestinal Endoscopy Procedures by Country, Western Europe, 2018 – 2028 |
| Figure 6‑11: Gastrointestinal Endoscopy Procedures by Country, Central & Eastern Europe, 2018 – 2028 (1 of 2) |
| Figure 6‑12: Gastrointestinal Endoscopy Procedures by Country, Central & Eastern Europe, 2018 – 2028 (2 of 2) |
| Figure 6‑13: Gastrointestinal Endoscopy Procedures by Country, Middle East, 2018 – 2028 |
| Figure 6‑14: Gastrointestinal Endoscopy Procedures by Country, Asia-Pacific, 2018 – 2028 (1 of 3) |
| Figure 6‑15: Gastrointestinal Endoscopy Procedures by Country, Asia-Pacific, 2018 – 2028 (2 of 3) |
| Figure 6‑16: Gastrointestinal Endoscopy Procedures by Country, Asia-Pacific, 2018 – 2028 (3 of 3) |
| Figure 6‑17: Gastrointestinal Endoscopy Procedures by Country, Africa, 2018 – 2028 |
| Figure 6‑18: Upper GI Procedures by Region, Global, 2018 – 2028 |
| Figure 6‑19: Upper GI Procedures by Country, North America, 2018 – 2028 |
| Figure 6‑20: Upper GI Procedures by Country, Latin America, 2018 – 2028 (1 of 2) |
| Figure 6‑21: Upper GI Procedures by Country, Latin America, 2018 – 2028 (2 of 2) |
| Figure 6‑22: Upper GI Procedures by Country, Western Europe, 2018 – 2028 |
| Figure 6‑23: Upper GI Procedures by Country, Central & Eastern Europe, 2018 – 2028 (1 of 2) |
| Figure 6‑24: Upper GI Procedures by Country, Central & Eastern Europe, 2018 – 2028 (2 of 2) |
| Figure 6‑25: Upper GI Procedures by Country, Middle East, 2018 – 2028 |
| Figure 6‑26: Upper GI Procedures by Country, Asia-Pacific, 2018 – 2028 (1 of 3) |
| Figure 6‑27: Upper GI Procedures by Country, Asia-Pacific, 2018 – 2028 (2 of 3) |
| Figure 6‑28: Upper GI Procedures by Country, Asia-Pacific, 2018 – 2028 (3 of 3) |
| Figure 6‑29: Upper GI Procedures by Country, Africa, 2018 – 2028 |
| Figure 6‑30: Colonoscopy Procedures by Region, Global, 2018 – 2028 |
| Figure 6‑31: Colonoscopy Procedures by Country, North America, 2018 – 2028 |
| Figure 6‑32: Colonoscopy Procedures by Country, Latin America, 2018 – 2028 (1 of 2) |
| Figure 6‑33: Colonoscopy Procedures by Country, Latin America, 2018 – 2028 (2 of 2) |
| Figure 6‑34: Colonoscopy Procedures by Country, Western Europe, 2018 – 2028 |
| Figure 6‑35: Colonoscopy Procedures by Country, Central & Eastern Europe, 2018 – 2028 (1 of 2) |
| Figure 6‑36: Colonoscopy Procedures by Country, Central & Eastern Europe, 2018 – 2028 (2 of 2) |
| Figure 6‑37: Colonoscopy Procedures by Country, Middle East, 2018 – 2028 |
| Figure 6‑38: Colonoscopy Procedures by Country, Asia-Pacific, 2018 – 2028 (1 of 3) |
| Figure 6‑39: Colonoscopy Procedures by Country, Asia-Pacific, 2018 – 2028 (2 of 3) |
| Figure 6‑40: Colonoscopy Procedures by Country, Asia-Pacific, 2018 – 2028 (3 of 3) |
| Figure 6‑41: Colonoscopy Procedures by Country, Africa, 2018 – 2028 |
| Figure 6‑42: Enteroscopy Procedures by Region, Global, 2018 – 2028 |
| Figure 6‑43: Enteroscopy Procedures by Country, North America, 2018 – 2028 |
| Figure 6‑44: Enteroscopy Procedures by Country, Latin America, 2018 – 2028 (1 of 2) |
| Figure 6‑45: Enteroscopy Procedures by Country, Latin America, 2018 – 2028 (2 of 2) |
| Figure 6‑46: Enteroscopy Procedures by Country, Western Europe, 2018 – 2028 |
| Figure 6‑47: Enteroscopy Procedures by Country, Central & Eastern Europe, 2018 – 2028 (1 of 2) |
| Figure 6‑48: Enteroscopy Procedures by Country, Central & Eastern Europe, 2018 – 2028 (2 of 2) |
| Figure 6‑49: Enteroscopy Procedures by Country, Middle East, 2018 – 2028 |
| Figure 6‑50: Enteroscopy Procedures by Country, Asia-Pacific, 2018 – 2028 (1 of 3) |
| Figure 6‑51: Enteroscopy Procedures by Country, Asia-Pacific, 2018 – 2028 (2 of 3) |
| Figure 6‑52: Enteroscopy Procedures by Country, Asia-Pacific, 2018 – 2028 (3 of 3) |
| Figure 6‑53: Enteroscopy Procedures by Country, Africa, 2018 – 2028 |
| Figure 6‑54: Ultrasound Endoscopy Procedures by Region, Global, 2018 – 2028 |
| Figure 6‑55: Ultrasound Endoscopy Procedures by Country, North America, 2018 – 2028 |
| Figure 6‑56: Ultrasound Endoscopy Procedures by Country, Latin America, 2018 – 2028 (1 of 2) |
| Figure 6‑57: Ultrasound Endoscopy Procedures by Country, Latin America, 2018 – 2028 (2 of 2) |
| Figure 6‑58: Ultrasound Endoscopy Procedures by Country, Western Europe, 2018 – 2028 |
| Figure 6‑59: Ultrasound Endoscopy Procedures by Country, Central & Eastern Europe, 2018 – 2028 (1 of 2) |
| Figure 6‑60: Ultrasound Endoscopy Procedures by Country, Central & Eastern Europe, 2018 – 2028 (2 of 2) |
| Figure 6‑61: Ultrasound Endoscopy Procedures by Country, Middle East, 2018 – 2028 |
| Figure 6‑62: Ultrasound Endoscopy Procedures by Country, Asia-Pacific, 2018 – 2028 (1 of 3) |
| Figure 6‑63: Ultrasound Endoscopy Procedures by Country, Asia-Pacific, 2018 – 2028 (2 of 3) |
| Figure 6‑64: Ultrasound Endoscopy Procedures by Country, Asia-Pacific, 2018 – 2028 (3 of 3) |
| Figure 6‑65: Ultrasound Endoscopy Procedures by Country, Africa, 2018 – 2028 |
| Figure 6‑66: Gastrointestinal Endoscope Market by Segment, Global, 2018 – 2028 (US$M) |
| Figure 6‑67: Gastrointestinal Endoscope Market by Region, Global, 2018 – 2028 (US$M) |
| Figure 6‑68: Gastrointestinal Endoscope Market, Global, 2018 – 2028 |
| Figure 6‑69: Units Sold by Region, Gastrointestinal Endoscope Market, Global, 2018 – 2028 |
| Figure 6‑70: Average Selling Price by Region, Gastrointestinal Endoscope Market, Global, 2018 – 2028 (US$) |
| Figure 6‑71: Market Value by Region, Gastrointestinal Endoscope Market, Global, 2018 – 2028 (US$M) |
| Figure 6‑72: Colonoscope Market, Global, 2018 – 2028 |
| Figure 6‑73: Units Sold by Region, Colonoscope Market, Global, 2018 – 2028 |
| Figure 6‑74: Average Selling Price by Region, Colonoscope Market, Global, 2018 – 2028 (US$) |
| Figure 6‑75: Market Value by Region, Colonoscope Market, Global, 2018 – 2028 (US$M) |
| Figure 6‑76: Duodenoscope Market, Global, 2018 – 2028 |
| Figure 6‑77: Units Sold by Region, Duodenoscope Market, Global, 2018 – 2028 |
| Figure 6‑78: Average Selling Price by Region, Duodenoscope Market, Global, 2018 – 2028 (US$) |
| Figure 6‑79: Market Value by Region, Duodenoscope Market, Global, 2018 – 2028 (US$M) |
| Figure 6‑80: Enteroscope Market, Global, 2018 – 2028 |
| Figure 6‑81: Units Sold by Region, Enteroscope Market, Global, 2018 – 2028 |
| Figure 6‑82: Average Selling Price by Region, Enteroscope Market, Global, 2018 – 2028 (US$) |
| Figure 6‑83: Market Value by Region, Enteroscope Market, Global, 2018 – 2028 (US$M) |
| Figure 6‑84: Ultrasound Endoscope Market, Global, 2018 – 2028 |
| Figure 6‑85: Units Sold by Region, Ultrasound Endoscope Market, Global, 2018 – 2028 |
| Figure 6‑86: Average Selling Price by Region, Ultrasound Endoscope Market, Global, 2018 – 2028 (US$) |
| Figure 6‑87: Market Value by Region, Ultrasound Endoscope Market, Global, 2018 – 2028 (US$M) |
| Figure 6‑88: Gastroscope Market, Global, 2018 – 2028 |
| Figure 6‑89: Units Sold by Region, Gastroscope Market, Global, 2018 – 2028 |
| Figure 6‑90: Average Selling Price by Region, Gastroscope Market, Global, 2018 – 2028 (US$) |
| Figure 6‑91: Market Value by Region, Gastroscope Market, Global, 2018 – 2028 (US$M) |
| Figure 6‑92: Leading Competitors, Gastrointestinal Endoscope Market, Global, 2021 |
| Figure 7‑1: Capsule Endoscopy Regions Covered, Global (1 of 2) |
| Figure 7‑2: Capsule Endoscopy Regions Covered, Global (2 of 2) |
| Figure 7‑3: Capsule Endoscopy Procedures by Region, Global, 2018 – 2028 |
| Figure 7‑4: Capsule Endoscopy Procedures by Country, North America, 2018 – 2028 |
| Figure 7‑5: Capsule Endoscopy Procedures by Country, Latin America, 2018 – 2028 (1 of 2) |
| Figure 7‑6: Capsule Endoscopy Procedures by Country, Latin America, 2018 – 2028 (2 of 2) |
| Figure 7‑7: Capsule Endoscopy Procedures by Country, Western Europe, 2018 – 2028 |
| Figure 7‑8: Capsule Endoscopy Procedures by Country, Central & Eastern Europe, 2018 – 2028 (1 of 2) |
| Figure 7‑9: Capsule Endoscopy Procedures by Country, Central & Eastern Europe, 2018 – 2028 (2 of 2) |
| Figure 7‑10: Capsule Endoscopy Procedures by Country, Middle East, 2018 – 2028 |
| Figure 7‑11: Capsule Endoscopy Procedures by Country, Asia-Pacific, 2018 – 2028 (1 of 3) |
| Figure 7‑12: Capsule Endoscopy Procedures by Country, Asia-Pacific, 2018 – 2028 (2 of 3) |
| Figure 7‑13: Capsule Endoscopy Procedures by Country, Asia-Pacific, 2018 – 2028 (3 of 3) |
| Figure 7‑14: Capsule Endoscopy Procedures by Country, Africa, 2018 – 2028 |
| Figure 7‑15: Capsule Endoscopy Market, Global, 2018 – 2028 |
| Figure 7‑16: Units Sold by Region, Capsule Endoscopy Market, Global, 2018 – 2028 |
| Figure 7‑17: Average Selling Price by Region, Capsule Endoscopy Market, Global, 2018 – 2028 (US$) |
| Figure 7‑18: Market Value by Region, Capsule Endoscopy Market, Global, 2018 – 2028 (US$M) |
| Figure 7‑19: Leading Competitors, Capsule Endoscopy Market, Global, 2021 |
| Figure 8‑1: Stenting and Dilation Device Procedures Covered |
| Figure 8‑2: Stenting and Dilation Device Markets Covered |
| Figure 8‑3: Stenting and Dilation Device Regions Covered, Global (1 of 2) |
| Figure 8‑4: Stenting and Dilation Device Regions Covered, Global (2 of 2) |
| Figure 8‑5: Stenting and Dilation Procedures by Segment, Global, 2018 – 2028 |
| Figure 8‑6: Stenting and Dilation Procedures by Region, Global, 2018 – 2028 |
| Figure 8‑7: Stenting and Dilation Procedures by Country, North America, 2018 – 2028 |
| Figure 8‑8: Stenting and Dilation Procedures by Country, Latin America, 2018 – 2028 (1 of 2) |
| Figure 8‑9: Stenting and Dilation Procedures by Country, Latin America, 2018 – 2028 (2 of 2) |
| Figure 8‑10: Stenting and Dilation Procedures by Country, Western Europe, 2018 – 2028 |
| Figure 8‑11: Stenting and Dilation Procedures by Country, Central & Eastern Europe, 2018 – 2028 (1 of 2) |
| Figure 8‑12: Stenting and Dilation Procedures by Country, Central & Eastern Europe, 2018 – 2028 (2 of 2) |
| Figure 8‑13: Stenting and Dilation Procedures by Country, Middle East, 2018 – 2028 |
| Figure 8‑14: Stenting and Dilation Procedures by Country, Asia-Pacific, 2018 – 2028 (1 of 3) |
| Figure 8‑15: Stenting and Dilation Procedures by Country, Asia-Pacific, 2018 – 2028 (2 of 3) |
| Figure 8‑16: Stenting and Dilation Procedures by Country, Asia-Pacific, 2018 – 2028 (3 of 3) |
| Figure 8‑17: Stenting and Dilation Procedures by Country, Africa, 2018 – 2028 |
| Figure 8‑18: Stenting Procedures by Segment, Global, 2018 – 2028 |
| Figure 8‑19: Stenting Procedures by Region, Global, 2018 – 2028 |
| Figure 8‑20: Stenting Procedures by Country, North America, 2018 – 2028 |
| Figure 8‑21: Stenting Procedures by Country, Latin America, 2018 – 2028 (1 of 2) |
| Figure 8‑22: Stenting Procedures by Country, Latin America, 2018 – 2028 (2 of 2) |
| Figure 8‑23: Stenting Procedures by Country, Western Europe, 2018 – 2028 |
| Figure 8‑24: Stenting Procedures by Country, Central & Eastern Europe, 2018 – 2028 (1 of 2) |
| Figure 8‑25: Stenting Procedures by Country, Central & Eastern Europe, 2018 – 2028 (2 of 2) |
| Figure 8‑26: Stenting Procedures by Country, Middle East, 2018 – 2028 |
| Figure 8‑27: Stenting Procedures by Country, Asia-Pacific, 2018 – 2028 (1 of 3) |
| Figure 8‑28: Stenting Procedures by Country, Asia-Pacific, 2018 – 2028 (2 of 3) |
| Figure 8‑29: Stenting Procedures by Country, Asia-Pacific, 2018 – 2028 (3 of 3) |
| Figure 8‑30: Stenting Procedures by Country, Africa, 2018 – 2028 |
| Figure 8‑31: Esophageal Stenting Procedures by Region, Global, 2018 – 2028 |
| Figure 8‑32: Esophageal Stenting Procedures by Country, North America, 2018 – 2028 |
| Figure 8‑33: Esophageal Stenting Procedures by Country, Latin America, 2018 – 2028 (1 of 2) |
| Figure 8‑34: Esophageal Stenting Procedures by Country, Latin America, 2018 – 2028 (2 of 2) |
| Figure 8‑35: Esophageal Stenting Procedures by Country, Western Europe, 2018 – 2028 |
| Figure 8‑36: Esophageal Stenting Procedures by Country, Central & Eastern Europe, 2018 – 2028 (1 of 2) |
| Figure 8‑37: Esophageal Stenting Procedures by Country, Central & Eastern Europe, 2018 – 2028 (2 of 2) |
| Figure 8‑38: Esophageal Stenting Procedures by Country, Middle East, 2018 – 2028 |
| Figure 8‑39: Esophageal Stenting Procedures by Country, Asia-Pacific, 2018 – 2028 (1 of 3) |
| Figure 8‑40: Esophageal Stenting Procedures by Country, Asia-Pacific, 2018 – 2028 (2 of 3) |
| Figure 8‑41: Esophageal Stenting Procedures by Country, Asia-Pacific, 2018 – 2028 (3 of 3) |
| Figure 8‑42: Esophageal Stenting Procedures by Country, Africa, 2018 – 2028 |
| Figure 8‑43: Duodenal Stenting Procedures by Region, Global, 2018 – 2028 |
| Figure 8‑44: Duodenal Stenting Procedures by Country, North America, 2018 – 2028 |
| Figure 8‑45: Duodenal Stenting Procedures by Country, Latin America, 2018 – 2028 (1 of 2) |
| Figure 8‑46: Duodenal Stenting Procedures by Country, Latin America, 2018 – 2028 (2 of 2) |
| Figure 8‑47: Duodenal Stenting Procedures by Country, Western Europe, 2018 – 2028 |
| Figure 8‑48: Duodenal Stenting Procedures by Country, Central & Eastern Europe, 2018 – 2028 (1 of 2) |
| Figure 8‑49: Duodenal Stenting Procedures by Country, Central & Eastern Europe, 2018 – 2028 (2 of 2) |
| Figure 8‑50: Duodenal Stenting Procedures by Country, Middle East, 2018 – 2028 |
| Figure 8‑51: Duodenal Stenting Procedures by Country, Asia-Pacific, 2018 – 2028 (1 of 3) |
| Figure 8‑52: Duodenal Stenting Procedures by Country, Asia-Pacific, 2018 – 2028 (2 of 3) |
| Figure 8‑53: Duodenal Stenting Procedures by Country, Asia-Pacific, 2018 – 2028 (3 of 3) |
| Figure 8‑54: Duodenal Stenting Procedures by Country, Africa, 2018 – 2028 |
| Figure 8‑55: Colonic Stenting Procedures by Region, Global, 2018 – 2028 |
| Figure 8‑56: Colonic Stenting Procedures by Country, North America, 2018 – 2028 |
| Figure 8‑57: Colonic Stenting Procedures by Country, Latin America, 2018 – 2028 (1 of 2) |
| Figure 8‑58: Colonic Stenting Procedures by Country, Latin America, 2018 – 2028 (2 of 2) |
| Figure 8‑59: Colonic Stenting Procedures by Country, Western Europe, 2018 – 2028 |
| Figure 8‑60: Colonic Stenting Procedures by Country, Central & Eastern Europe, 2018 – 2028 (1 of 2) |
| Figure 8‑61: Colonic Stenting Procedures by Country, Central & Eastern Europe, 2018 – 2028 (2 of 2) |
| Figure 8‑62: Colonic Stenting Procedures by Country, Middle East, 2018 – 2028 |
| Figure 8‑63: Colonic Stenting Procedures by Country, Asia-Pacific, 2018 – 2028 (1 of 3) |
| Figure 8‑64: Colonic Stenting Procedures by Country, Asia-Pacific, 2018 – 2028 (2 of 3) |
| Figure 8‑65: Colonic Stenting Procedures by Country, Asia-Pacific, 2018 – 2028 (3 of 3) |
| Figure 8‑66: Colonic Stenting Procedures by Country, Africa, 2018 – 2028 |
| Figure 8‑67: Dilation Balloon Procedures by Segment, Global, 2018 – 2028 |
| Figure 8‑68: Dilation Balloon Procedures by Region, Global, 2018 – 2028 |
| Figure 8‑69: Dilation Balloon Procedures by Country, North America, 2018 – 2028 |
| Figure 8‑70: Dilation Balloon Procedures by Country, Latin America, 2018 – 2028 (1 of 2) |
| Figure 8‑71: Dilation Balloon Procedures by Country, Latin America, 2018 – 2028 (2 of 2) |
| Figure 8‑72: Dilation Balloon Procedures by Country, Western Europe, 2018 – 2028 |
| Figure 8‑73: Dilation Balloon Procedures by Country, Central & Eastern Europe, 2018 – 2028 (1 of 2) |
| Figure 8‑74: Dilation Balloon Procedures by Country, Central & Eastern Europe, 2018 – 2028 (2 of 2) |
| Figure 8‑75: Dilation Balloon Procedures by Country, Middle East, 2018 – 2028 |
| Figure 8‑76: Dilation Balloon Procedures by Country, Asia-Pacific, 2018 – 2028 (1 of 3) |
| Figure 8‑77: Dilation Balloon Procedures by Country, Asia-Pacific, 2018 – 2028 (2 of 3) |
| Figure 8‑78: Dilation Balloon Procedures by Country, Asia-Pacific, 2018 – 2028 (3 of 3) |
| Figure 8‑79: Dilation Balloon Procedures by Country, Africa, 2018 – 2028 |
| Figure 8‑80: Esophageal Dilation Balloon Procedures by Region, Global, 2018 – 2028 |
| Figure 8‑81: Esophageal Dilation Balloon Procedures by Country, North America, 2018 – 2028 |
| Figure 8‑82: Esophageal Dilation Balloon Procedures by Country, Latin America, 2018 – 2028 (1 of 2) |
| Figure 8‑83: Esophageal Dilation Balloon Procedures by Country, Latin America, 2018 – 2028 (2 of 2) |
| Figure 8‑84: Esophageal Dilation Balloon Procedures by Country, Western Europe, 2018 – 2028 |
| Figure 8‑85: Esophageal Dilation Balloon Procedures by Country, Central & Eastern Europe, 2018 – 2028 (1 of 2) |
| Figure 8‑86: Esophageal Dilation Balloon Procedures by Country, Central & Eastern Europe, 2018 – 2028 (2 of 2) |
| Figure 8‑87: Esophageal Dilation Balloon Procedures by Country, Middle East, 2018 – 2028 |
| Figure 8‑88: Esophageal Dilation Balloon Procedures by Country, Asia-Pacific, 2018 – 2028 (1 of 3) |
| Figure 8‑89: Esophageal Dilation Balloon Procedures by Country, Asia-Pacific, 2018 – 2028 (2 of 3) |
| Figure 8‑90: Esophageal Dilation Balloon Procedures by Country, Asia-Pacific, 2018 – 2028 (3 of 3) |
| Figure 8‑91: Esophageal Dilation Balloon Procedures by Country, Africa, 2018 – 2028 |
| Figure 8‑92: Duodenal Dilation Balloon Procedures by Region, Global, 2018 – 2028 |
| Figure 8‑93: Duodenal Dilation Balloon Procedures by Country, North America, 2018 – 2028 |
| Figure 8‑94: Duodenal Dilation Balloon Procedures by Country, Latin America, 2018 – 2028 (1 of 2) |
| Figure 8‑95: Duodenal Dilation Balloon Procedures by Country, Latin America, 2018 – 2028 (2 of 2) |
| Figure 8‑96: Duodenal Dilation Balloon Procedures by Country, Western Europe, 2018 – 2028 |
| Figure 8‑97: Duodenal Dilation Balloon Procedures by Country, Central & Eastern Europe, 2018 – 2028 (1 of 2) |
| Figure 8‑98: Duodenal Dilation Balloon Procedures by Country, Central & Eastern Europe, 2018 – 2028 (2 of 2) |
| Figure 8‑99: Duodenal Dilation Balloon Procedures by Country, Middle East, 2018 – 2028 |
| Figure 8‑100: Duodenal Dilation Balloon Procedures by Country, Asia-Pacific, 2018 – 2028 (1 of 3) |
| Figure 8‑101: Duodenal Dilation Balloon Procedures by Country, Asia-Pacific, 2018 – 2028 (2 of 3) |
| Figure 8‑102: Duodenal Dilation Balloon Procedures by Country, Asia-Pacific, 2018 – 2028 (3 of 3) |
| Figure 8‑103: Duodenal Dilation Balloon Procedures by Country, Africa, 2018 – 2028 |
| Figure 8‑104: Colonic Dilation Balloon Procedures by Region, Global, 2018 – 2028 |
| Figure 8‑105: Colonic Dilation Balloon Procedures by Country, North America, 2018 – 2028 |
| Figure 8‑106: Colonic Dilation Balloon Procedures by Country, Latin America, 2018 – 2028 (1 of 2) |
| Figure 8‑107: Colonic Dilation Balloon Procedures by Country, Latin America, 2018 – 2028 (2 of 2) |
| Figure 8‑108: Colonic Dilation Balloon Procedures by Country, Western Europe, 2018 – 2028 |
| Figure 8‑109: Colonic Dilation Balloon Procedures by Country, Central & Eastern Europe, 2018 – 2028 (1 of 2) |
| Figure 8‑110: Colonic Dilation Balloon Procedures by Country, Central & Eastern Europe, 2018 – 2028 (2 of 2) |
| Figure 8‑111: Colonic Dilation Balloon Procedures by Country, Middle East, 2018 – 2028 |
| Figure 8‑112: Colonic Dilation Balloon Procedures by Country, Asia-Pacific, 2018 – 2028 (1 of 3) |
| Figure 8‑113: Colonic Dilation Balloon Procedures by Country, Asia-Pacific, 2018 – 2028 (2 of 3) |
| Figure 8‑114: Colonic Dilation Balloon Procedures by Country, Asia-Pacific, 2018 – 2028 (3 of 3) |
| Figure 8‑115: Colonic Dilation Balloon Procedures by Country, Africa, 2018 – 2028 |
| Figure 8‑116: Stenting and Dilation Device Market by Segment, Global, 2018 – 2028 (US$M) |
| Figure 8‑117: Stenting and Dilation Device Market by Region, Global, 2018 – 2028 (US$M) |
| Figure 8‑118: Stenting and Dilation Device Market, Global, 2018 – 2028 |
| Figure 8‑119: Units Sold by Region, Stenting and Dilation Device Market, Global, 2018 – 2028 |
| Figure 8‑120: Average Selling Price by Region, Stenting and Dilation Device Market, Global, 2018 – 2028 (US$) |
| Figure 8‑121: Market Value by Region, Stenting and Dilation Device Market, Global, 2018 – 2028 (US$M) |
| Figure 8‑122: Esophageal Stent Market, Global, 2018 – 2028 |
| Figure 8‑123: Units Sold by Region, Esophageal Stent Market, Global, 2018 – 2028 |
| Figure 8‑124: Average Selling Price by Region, Esophageal Stent Market, Global, 2018 – 2028 (US$) |
| Figure 8‑125: Market Value by Region, Esophageal Stent Market, Global, 2018 – 2028 (US$M) |
| Figure 8‑126: Duodenal Stent Market, Global, 2018 – 2028 |
| Figure 8‑127: Units Sold by Region, Duodenal Stent Market, Global, 2018 – 2028 |
| Figure 8‑128: Average Selling Price by Region, Duodenal Stent Market, Global, 2018 – 2028 (US$) |
| Figure 8‑129: Market Value by Region, Duodenal Stent Market, Global, 2018 – 2028 (US$M) |
| Figure 8‑130: Colonic Stent Market, Global, 2018 – 2028 |
| Figure 8‑131: Units Sold by Region, Colonic Stent Market, Global, 2018 – 2028 |
| Figure 8‑132: Average Selling Price by Region, Colonic Stent Market, Global, 2018 – 2028 (US$) |
| Figure 8‑133: Market Value by Region, Colonic Stent Market, Global, 2018 – 2028 (US$M) |
| Figure 8‑134: Esophageal Dilation Balloon Market, Global, 2018 – 2028 |
| Figure 8‑135: Units Sold by Region, Esophageal Dilation Balloon Market, Global, 2018 – 2028 |
| Figure 8‑136: Average Selling Price by Region, Esophageal Dilation Balloon Market, Global, 2018 – 2028 (US$) |
| Figure 8‑137: Market Value by Region, Esophageal Dilation Balloon Market, Global, 2018 – 2028 (US$M) |
| Figure 8‑138: Duodenal Dilation Balloon Market, Global, 2018 – 2028 |
| Figure 8‑139: Units Sold by Region, Duodenal Dilation Balloon Market, Global, 2018 – 2028 |
| Figure 8‑140: Average Selling Price by Region, Duodenal Dilation Balloon Market, Global, 2018 – 2028 (US$) |
| Figure 8‑141: Market Value by Region, Duodenal Dilation Balloon Market, Global, 2018 – 2028 (US$M) |
| Figure 8‑142: Colonic Dilation Balloon Market, Global, 2018 – 2028 |
| Figure 8‑143: Units Sold by Region, Colonic Dilation Balloon Market, Global, 2018 – 2028 |
| Figure 8‑144: Average Selling Price by Region, Colonic Dilation Balloon Market, Global, 2018 – 2028 (US$) |
| Figure 8‑145: Market Value by Region, Colonic Dilation Balloon Market, Global, 2018 – 2028 (US$M) |
| Figure 8‑146: Leading Competitors, Stenting and Dilation Device Market, Global, 2021 |
| Figure 9‑1: ERCP Device Markets Covered |
| Figure 9‑2: ERCP Device Regions Covered, Global (1 of 2) |
| Figure 9‑3: ERCP Device Regions Covered, Global (2 of 2) |
| Figure 9‑4: ERCP Procedures by Region, Global, 2018 – 2028 |
| Figure 9‑5: ERCP Procedures by Country, North America, 2018 – 2028 |
| Figure 9‑6: ERCP Procedures by Country, Latin America, 2018 – 2028 (1 of 2) |
| Figure 9‑7: ERCP Procedures by Country, Latin America, 2018 – 2028 (2 of 2) |
| Figure 9‑8: ERCP Procedures by Country, Western Europe, 2018 – 2028 |
| Figure 9‑9: ERCP Procedures by Country, Central & Eastern Europe, 2018 – 2028 (1 of 2) |
| Figure 9‑10: ERCP Procedures by Country, Central & Eastern Europe, 2018 – 2028 (2 of 2) |
| Figure 9‑11: ERCP Procedures by Country, Middle East, 2018 – 2028 |
| Figure 9‑12: ERCP Procedures by Country, Asia-Pacific, 2018 – 2028 (1 of 3) |
| Figure 9‑13: ERCP Procedures by Country, Asia-Pacific, 2018 – 2028 (2 of 3) |
| Figure 9‑14: ERCP Procedures by Country, Asia-Pacific, 2018 – 2028 (3 of 3) |
| Figure 9‑15: ERCP Procedures by Country, Africa, 2018 – 2028 |
| Figure 9‑16: ERCP Device Market by Segment, Global, 2018 – 2028 (US$M) (1 of 2) |
| Figure 9‑17: ERCP Device Market by Segment, Global, 2018 – 2028 (US$M) (2 of 2) |
| Figure 9‑18: ERCP Device Market by Region, Global, 2018 – 2028 (US$M) |
| Figure 9‑19: Sphincterotome Market, Global, 2018 – 2028 |
| Figure 9‑20: Units Sold by Region, Sphincterotome Market, Global, 2018 – 2028 |
| Figure 9‑21: Average Selling Price by Region, Sphincterotome Market, Global, 2018 – 2028 (US$) |
| Figure 9‑22: Market Value by Region, Sphincterotome Market, Global, 2018 – 2028 (US$M) |
| Figure 9‑23: Biliary Stone Removal Balloon Market, Global, 2018 – 2028 |
| Figure 9‑24: Units Sold by Region, Biliary Stone Removal Balloon Market, Global, 2018 – 2028 |
| Figure 9‑25: Average Selling Price by Region, Biliary Stone Removal Balloon Market, Global, 2018 – 2028 (US$) |
| Figure 9‑26: Market Value by Region, Biliary Stone Removal Balloon Market, Global, 2018 – 2028 (US$M) |
| Figure 9‑27: Biliary Stone Removal Basket Market, Global, 2018 – 2028 |
| Figure 9‑28: Units Sold by Region, Biliary Stone Removal Basket Market, Global, 2018 – 2028 |
| Figure 9‑29: Average Selling Price by Region, Biliary Stone Removal Basket Market, Global, 2018 – 2028 (US$) |
| Figure 9‑30: Market Value by Region, Biliary Stone Removal Basket Market, Global, 2018 – 2028 (US$M) |
| Figure 9‑31: Biliary Dilation Balloon Market, Global, 2018 – 2028 |
| Figure 9‑32: Units Sold by Region, Biliary Dilation Balloon Market, Global, 2018 – 2028 |
| Figure 9‑33: Average Selling Price by Region, Biliary Dilation Balloon Market, Global, 2018 – 2028 (US$) |
| Figure 9‑34: Market Value by Region, Biliary Dilation Balloon Market, Global, 2018 – 2028 (US$M) |
| Figure 9‑35: Biliary and Pancreatic Stent Market, Global, 2018 – 2028 |
| Figure 9‑36: Units Sold by Region, Biliary and Pancreatic Stent Market, Global, 2018 – 2028 |
| Figure 9‑37: Average Selling Price by Region, Biliary and Pancreatic Stent Market, Global, 2018 – 2028 (US$) |
| Figure 9‑38: Market Value by Region, Biliary and Pancreatic Stent Market, Global, 2018 – 2028 (US$M) |
| Figure 9‑39: Biliary Lithotripter Market, Global, 2018 – 2028 |
| Figure 9‑40: Units Sold by Region, Biliary Lithotripter Market, Global, 2018 – 2028 |
| Figure 9‑41: Average Selling Price by Region, Biliary Lithotripter Market, Global, 2018 – 2028 (US$) |
| Figure 9‑42: Market Value by Region, Biliary Lithotripter Market, Global, 2018 – 2028 (US$M) |
| Figure 9‑43: ERCP Guidewire Market, Global, 2018 – 2028 |
| Figure 9‑44: Units Sold by Region, ERCP Guidewire Market, Global, 2018 – 2028 |
| Figure 9‑45: Average Selling Price by Region, ERCP Guidewire Market, Global, 2018 – 2028 (US$) |
| Figure 9‑46: Market Value by Region, ERCP Guidewire Market, Global, 2018 – 2028 (US$M) |
| Figure 9‑47: ERCP Cannula Market, Global, 2018 – 2028 |
| Figure 9‑48: Units Sold by Region, ERCP Cannula Market, Global, 2018 – 2028 |
| Figure 9‑49: Average Selling Price by Region, ERCP Cannula Market, Global, 2018 – 2028 (US$) |
| Figure 9‑50: Market Value by Region, ERCP Cannula Market, Global, 2018 – 2028 (US$M) |
| Figure 9‑51: Leading Competitors, ERCP Device Market, Global, 2021 |
| Figure 10‑1: Biopsy Forceps, Polypectomy Snare and EUS Needle Procedures Covered |
| Figure 10‑2: Biopsy Forceps, Polypectomy Snare and EUS Needle Markets Covered |
| Figure 10‑3: Biopsy Forceps, Polypectomy Snare and EUS Needle Regions Covered, Global (1 of 2) |
| Figure 10‑4: Biopsy Forceps, Polypectomy Snare and EUS Needle Regions Covered, Global (2 of 2) |
| Figure 10‑5: Tissue Biopsy and Polypectomy Snare Procedures by Segment, Global, 2018 – 2028 |
| Figure 10‑6: Tissue Biopsy and Polypectomy Snare Procedures by Region, Global, 2018 – 2028 |
| Figure 10‑7: Tissue Biopsy and Polypectomy Snare Procedures by Country, North America, 2018 – 2028 |
| Figure 10‑8: Tissue Biopsy and Polypectomy Snare Procedures by Country, Latin America, 2018 – 2028 (1 of 2) |
| Figure 10‑9: Tissue Biopsy and Polypectomy Snare Procedures by Country, Latin America, 2018 – 2028 (2 of 2) |
| Figure 10‑10: Tissue Biopsy and Polypectomy Snare Procedures by Country, Western Europe, 2018 – 2028 |
| Figure 10‑11: Tissue Biopsy and Polypectomy Snare Procedures by Country, Central & Eastern Europe, 2018 – 2028 (1 of 2) |
| Figure 10‑12: Tissue Biopsy and Polypectomy Snare Procedures by Country, Central & Eastern Europe, 2018 – 2028 (2 of 2) |
| Figure 10‑13: Tissue Biopsy and Polypectomy Snare Procedures by Country, Middle East, 2018 – 2028 |
| Figure 10‑14: Tissue Biopsy and Polypectomy Snare Procedures by Country, Asia-Pacific, 2018 – 2028 (1 of 3) |
| Figure 10‑15: Tissue Biopsy and Polypectomy Snare Procedures by Country, Asia-Pacific, 2018 – 2028 (2 of 3) |
| Figure 10‑16: Tissue Biopsy and Polypectomy Snare Procedures by Country, Asia-Pacific, 2018 – 2028 (3 of 3) |
| Figure 10‑17: Tissue Biopsy and Polypectomy Snare Procedures by Country, Africa, 2018 – 2028 |
| Figure 10‑18: Biopsy Forceps Procedures by Region, Global, 2018 – 2028 |
| Figure 10‑19: Biopsy Forceps Procedures by Country, North America, 2018 – 2028 |
| Figure 10‑20: Biopsy Forceps Procedures by Country, Latin America, 2018 – 2028 (1 of 2) |
| Figure 10‑21: Biopsy Forceps Procedures by Country, Latin America, 2018 – 2028 (2 of 2) |
| Figure 10‑22: Biopsy Forceps Procedures by Country, Western Europe, 2018 – 2028 |
| Figure 10‑23: Biopsy Forceps Procedures by Country, Central & Eastern Europe, 2018 – 2028 (1 of 2) |
| Figure 10‑24: Biopsy Forceps Procedures by Country, Central & Eastern Europe, 2018 – 2028 (2 of 2) |
| Figure 10‑25: Biopsy Forceps Procedures by Country, Middle East, 2018 – 2028 |
| Figure 10‑26: Biopsy Forceps Procedures by Country, Asia-Pacific, 2018 – 2028 (1 of 3) |
| Figure 10‑27: Biopsy Forceps Procedures by Country, Asia-Pacific, 2018 – 2028 (2 of 3) |
| Figure 10‑28: Biopsy Forceps Procedures by Country, Asia-Pacific, 2018 – 2028 (3 of 3) |
| Figure 10‑29: Biopsy Forceps Procedures by Country, Africa, 2018 – 2028 |
| Figure 10‑30: Polypectomy Snare Procedures by Region, Global, 2018 – 2028 |
| Figure 10‑31: Polypectomy Snare Procedures by Country, North America, 2018 – 2028 |
| Figure 10‑32: Polypectomy Snare Procedures by Country, Latin America, 2018 – 2028 (1 of 2) |
| Figure 10‑33: Polypectomy Snare Procedures by Country, Latin America, 2018 – 2028 (2 of 2) |
| Figure 10‑34: Polypectomy Snare Procedures by Country, Western Europe, 2018 – 2028 |
| Figure 10‑35: Polypectomy Snare Procedures by Country, Central & Eastern Europe, 2018 – 2028 (1 of 2) |
| Figure 10‑36: Polypectomy Snare Procedures by Country, Central & Eastern Europe, 2018 – 2028 (2 of 2) |
| Figure 10‑37: Polypectomy Snare Procedures by Country, Middle East, 2018 – 2028 |
| Figure 10‑38: Polypectomy Snare Procedures by Country, Asia-Pacific, 2018 – 2028 (1 of 3) |
| Figure 10‑39: Polypectomy Snare Procedures by Country, Asia-Pacific, 2018 – 2028 (2 of 3) |
| Figure 10‑40: Polypectomy Snare Procedures by Country, Asia-Pacific, 2018 – 2028 (3 of 3) |
| Figure 10‑41: Polypectomy Snare Procedures by Country, Africa, 2018 – 2028 |
| Figure 10‑42: EUS Needle Procedures by Region, Global, 2018 – 2028 |
| Figure 10‑43: EUS Needle Procedures by Country, North America, 2018 – 2028 |
| Figure 10‑44: EUS Needle Procedures by Country, Latin America, 2018 – 2028 (1 of 2) |
| Figure 10‑45: EUS Needle Procedures by Country, Latin America, 2018 – 2028 (2 of 2) |
| Figure 10‑46: EUS Needle Procedures by Country, Western Europe, 2018 – 2028 |
| Figure 10‑47: EUS Needle Procedures by Country, Central & Eastern Europe, 2018 – 2028 (1 of 2) |
| Figure 10‑48: EUS Needle Procedures by Country, Central & Eastern Europe, 2018 – 2028 (2 of 2) |
| Figure 10‑49: EUS Needle Procedures by Country, Middle East, 2018 – 2028 |
| Figure 10‑50: EUS Needle Procedures by Country, Asia-Pacific, 2018 – 2028 (1 of 3) |
| Figure 10‑51: EUS Needle Procedures by Country, Asia-Pacific, 2018 – 2028 (2 of 3) |
| Figure 10‑52: EUS Needle Procedures by Country, Asia-Pacific, 2018 – 2028 (3 of 3) |
| Figure 10‑53: EUS Needle Procedures by Country, Africa, 2018 – 2028 |
| Figure 10‑54: Biopsy Forceps, Polypectomy Snare and EUS Needle Market by Segment, Global, 2018 – 2028 (US$M) |
| Figure 10‑55: Biopsy Forceps, Polypectomy Snare and EUS Needle Market by Region, Global, 2018 – 2028 (US$M) |
| Figure 10‑56: Biopsy Forceps Market, Global, 2018 – 2028 |
| Figure 10‑57: Units Sold by Region, Biopsy Forceps Market, Global, 2018 – 2028 |
| Figure 10‑58: Average Selling Price by Region, Biopsy Forceps Market, Global, 2018 – 2028 (US$) |
| Figure 10‑59: Market Value by Region, Biopsy Forceps Market, Global, 2018 – 2028 (US$M) |
| Figure 10‑60: Polypectomy Snare Market, Global, 2018 – 2028 |
| Figure 10‑61: Units Sold by Region, Polypectomy Snare Market, Global, 2018 – 2028 |
| Figure 10‑62: Average Selling Price by Region, Polypectomy Snare Market, Global, 2018 – 2028 (US$) |
| Figure 10‑63: Market Value by Region, Polypectomy Snare Market, Global, 2018 – 2028 (US$M) |
| Figure 10‑64: EUS Needle Market, Global, 2018 – 2028 |
| Figure 10‑65: Units Sold by Region, EUS Needle Market, Global, 2018 – 2028 |
| Figure 10‑66: Average Selling Price by Region, EUS Needle Market, Global, 2018 – 2028 (US$) |
| Figure 10‑67: Market Value by Region, EUS Needle Market, Global, 2018 – 2028 (US$M) |
| Figure 10‑68: Leading Competitors, Biopsy Forceps, Polypectomy Snare and EUS Needle Market, Global, 2021 |
| Figure 11‑1: Hemostasis Device Markets Covered |
| Figure 11‑2: Hemostasis Device Regions Covered, Global (1 of 2) |
| Figure 11‑3: Hemostasis Device Regions Covered, Global (2 of 2) |
| Figure 11‑4: Hemostasis Procedures by Region, Global, 2018 – 2028 |
| Figure 11‑5: Hemostasis Procedures by Country, North America, 2018 – 2028 |
| Figure 11‑6: Hemostasis Procedures by Country, Latin America, 2018 – 2028 (1 of 2) |
| Figure 11‑7: Hemostasis Procedures by Country, Latin America, 2018 – 2028 (2 of 2) |
| Figure 11‑8: Hemostasis Procedures by Country, Western Europe, 2018 – 2028 |
| Figure 11‑9: Hemostasis Procedures by Country, Central & Eastern Europe, 2018 – 2028 (1 of 2) |
| Figure 11‑10: Hemostasis Procedures by Country, Central & Eastern Europe, 2018 – 2028 (2 of 2) |
| Figure 11‑11: Hemostasis Procedures by Country, Middle East, 2018 – 2028 |
| Figure 11‑12: Hemostasis Procedures by Country, Asia-Pacific, 2018 – 2028 (1 of 3) |
| Figure 11‑13: Hemostasis Procedures by Country, Asia-Pacific, 2018 – 2028 (2 of 3) |
| Figure 11‑14: Hemostasis Procedures by Country, Asia-Pacific, 2018 – 2028 (3 of 3) |
| Figure 11‑15: Hemostasis Procedures by Country, Africa, 2018 – 2028 |
| Figure 11‑16: Hemostasis Device Market by Segment, Global, 2018 – 2028 (US$M) |
| Figure 11‑17: Hemostasis Device Market by Region, Global, 2018 – 2028 (US$M) |
| Figure 11‑18: Hemostasis Probe Market, Global, 2018 – 2028 |
| Figure 11‑19: Units Sold by Region, Hemostasis Probe Market, Global, 2018 – 2028 |
| Figure 11‑20: Average Selling Price by Region, Hemostasis Probe Market, Global, 2018 – 2028 (US$) |
| Figure 11‑21: Market Value by Region, Hemostasis Probe Market, Global, 2018 – 2028 (US$M) |
| Figure 11‑22: Ligation Device Market, Global, 2018 – 2028 |
| Figure 11‑23: Units Sold by Region, Ligation Device Market, Global, 2018 – 2028 |
| Figure 11‑24: Average Selling Price by Region, Ligation Device Market, Global, 2018 – 2028 (US$) |
| Figure 11‑25: Market Value by Region, Ligation Device Market, Global, 2018 – 2028 (US$M) |
| Figure 11‑26: Sclerotherapy Needle Market, Global, 2018 – 2028 |
| Figure 11‑27: Units Sold by Region, Sclerotherapy Needle Market, Global, 2018 – 2028 |
| Figure 11‑28: Average Selling Price by Region, Sclerotherapy Needle Market, Global, 2018 – 2028 (US$) |
| Figure 11‑29: Market Value by Region, Sclerotherapy Needle Market, Global, 2018 – 2028 (US$M) |
| Figure 11‑30: Leading Competitors, Hemostasis Device Market, Global, 2021 |
| Figure 12‑1: Enteral Feeding Device Regions Covered, Global (1 of 2) |
| Figure 12‑2: Enteral Feeding Device Regions Covered, Global (2 of 2) |
| Figure 12‑3: Enteral Feeding Device Placement Procedures by Region, Global, 2018 – 2028 |
| Figure 12‑4: Enteral Feeding Device Placement Procedures by Country, North America, 2018 – 2028 |
| Figure 12‑5: Enteral Feeding Device Placement Procedures by Country, Latin America, 2018 – 2028 (1 of 2) |
| Figure 12‑6: Enteral Feeding Device Placement Procedures by Country, Latin America, 2018 – 2028 (2 of 2) |
| Figure 12‑7: Enteral Feeding Device Placement Procedures by Country, Western Europe, 2018 – 2028 |
| Figure 12‑8: Enteral Feeding Device Placement Procedures by Country, Central & Eastern Europe, 2018 – 2028 (1 of 2) |
| Figure 12‑9: Enteral Feeding Device Placement Procedures by Country, Central & Eastern Europe, 2018 – 2028 (2 of 2) |
| Figure 12‑10: Enteral Feeding Device Placement Procedures by Country, Middle East, 2018 – 2028 |
| Figure 12‑11: Enteral Feeding Device Placement Procedures by Country, Asia-Pacific, 2018 – 2028 (1 of 3) |
| Figure 12‑12: Enteral Feeding Device Placement Procedures by Country, Asia-Pacific, 2018 – 2028 (2 of 3) |
| Figure 12‑13: Enteral Feeding Device Placement Procedures by Country, Asia-Pacific, 2018 – 2028 (3 of 3) |
| Figure 12‑14: Enteral Feeding Device Placement Procedures by Country, Africa, 2018 – 2028 |
| Figure 12‑15: Enteral Feeding Device Market, Global, 2018 – 2028 |
| Figure 12‑16: Units Sold by Region, Enteral Feeding Device Market, Global, 2018 – 2028 |
| Figure 12‑17: Average Selling Price by Region, Enteral Feeding Device Market, Global, 2018 – 2028 (US$) |
| Figure 12‑18: Market Value by Region, Enteral Feeding Device Market, Global, 2018 – 2028 (US$M) |
| Figure 12‑19: Leading Competitors, Enteral Feeding Device Market, Global, 2021 |
| Figure 13‑1: Anti-Reflux Device Regions Covered, Global (1 of 2) |
| Figure 13‑2: Anti-Reflux Device Regions Covered, Global (2 of 2) |
| Figure 13‑3: Anti-Reflux Device Implant Procedures by Region, Global, 2018 – 2028 |
| Figure 13‑4: Anti-Reflux Device Market, Global, 2018 – 2028 |
| Figure 13‑5: Units Sold by Region, Anti-Reflux Device Market, Global, 2018 – 2028 |
| Figure 13‑6: Average Selling Price by Region, Anti-Reflux Device Market, Global, 2018 – 2028 (US$) |
| Figure 13‑7: Market Value by Region, Anti-Reflux Device Market, Global, 2018 – 2028 (US$M) |
| Figure 13‑8: Leading Competitors, Anti-Reflux Device Market, Global, 2021 |


 The saturated nature of the global gastrointestinal endoscopic device market will somewhat limit growth over the forecast period. Reimbursement will continue to remain low for GI endoscopy procedures in many countries, due to the high associated costs. Competitive price pressure and flattening unit growth in some segments will also limit the overall market value going forward.