| Figure 1‑1: Vascular Access Market Share Ranking by Segment, Global, 2025 (1 of 3) |
| Figure 1‑2: Vascular Access Market Share Ranking by Segment, Global, 2025 (2 of 3) |
| Figure 1‑3: Vascular Access Market Share Ranking by Segment, Global, 2025 (3 of 3) |
| Figure 1‑4: Companies Researched in This Report (1 of 2) |
| Figure 1‑5: Companies Researched in This Report (2 of 2) |
| Figure 1‑6: Factors Impacting the Vascular Access Market by Segment, Global (1 of 3) |
| Figure 1‑7: Factors Impacting the Vascular Access Market by Segment, Global (2 of 3) |
| Figure 1‑8: Factors Impacting the Vascular Access Market by Segment, Global (3 of 3) |
| Figure 1‑9: Recent Events in the Vascular Access Market, Global, 2022 – 2025 |
| Figure 1‑10: Recent Events in the Vascular Access Market, Global, 2022 – 2025 |
| Figure 1‑11: Recent Events in the Vascular Access Market, Global, 2022 – 2025 |
| Figure 1‑12: Vascular Access Procedures Covered |
| Figure 1‑13: Vascular Access Markets Covered (1 of 4) |
| Figure 1‑14: Vascular Access Markets Covered (2 of 4) |
| Figure 1‑15: Vascular Access Markets Covered (3 of 4) |
| Figure 1‑16: Vascular Access Markets Covered (4 of 4) |
| Figure 1‑17: Vascular Access Regions Covered, Global (1 of 2) |
| Figure 1‑18: Vascular Access Regions Covered, Global (2 of 2) |
| Figure 1‑19: Key Report Updates |
| Figure 1‑20: Version History |
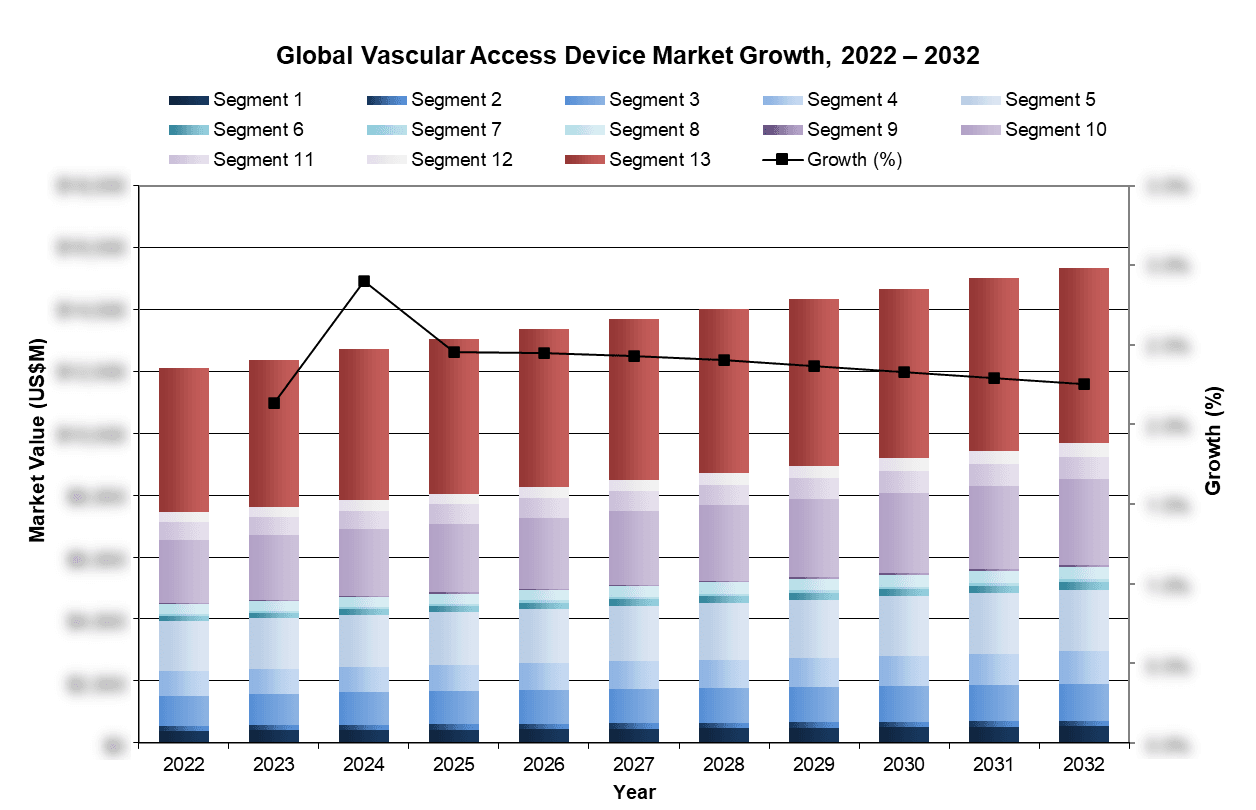
| Figure 3‑1: Vascular Access Market by Segment, Global, 2022 – 2032 (US$M) (1 of 2) |
| Figure 3‑2: Vascular Access Market by Segment, Global, 2022 – 2032 (US$M) (2 of 2) |
| Figure 3‑3: Vascular Access Market by Region, Global, 2022 – 2032 (US$M) |
| Figure 3‑4: Leading Competitors, Vascular Access Market by Segment, Global, 2025 (1 of 2) |
| Figure 3‑5: Leading Competitors, Vascular Access Market by Segment, Global, 2025 (2 of 2) |
| Figure 4‑1: Implantable Port Procedures Covered |
| Figure 4‑2: Implantable Port Markets Covered |
| Figure 4‑3: Implantable Port Regions Covered, Global (1 of 2) |
| Figure 4‑4: Implantable Port Regions Covered, Global (2 of 2) |
| Figure 4‑5: Implantable Port Procedures by Region, Global, 2022 – 2032 |
| Figure 4‑6: Implantable Port Procedures by Country, North America, 2022 – 2032 |
| Figure 4‑7: Implantable Port Procedures by Country, Latin America, 2022 – 2032 (1 of 2) |
| Figure 4‑8: Implantable Port Procedures by Country, Latin America, 2022 – 2032 (2 of 2) |
| Figure 4‑9: Implantable Port Procedures by Country, Western Europe, 2022 – 2032 |
| Figure 4‑10: Implantable Port Procedures by Country, Central & Eastern Europe, 2022 – 2032 (1 of 2) |
| Figure 4‑11: Implantable Port Procedures by Country, Central & Eastern Europe, 2022 – 2032 (2 of 2) |
| Figure 4‑12: Implantable Port Procedures by Country, Middle East, 2022 – 2032 |
| Figure 4‑13: Implantable Port Procedures by Country, Asia-Pacific, 2022 – 2032 (1 of 3) |
| Figure 4‑14: Implantable Port Procedures by Country, Asia-Pacific, 2022 – 2032 (2 of 3) |
| Figure 4‑15: Implantable Port Procedures by Country, Asia-Pacific, 2022 – 2032 (3 of 3) |
| Figure 4‑16: Implantable Port Procedures by Country, Africa, 2022 – 2032 |
| Figure 4‑17: Power-Injectable Procedures by Region, Global, 2022 – 2032 |
| Figure 4‑18: Power-Injectable Procedures by Country, North America, 2022 – 2032 |
| Figure 4‑19: Power-Injectable Procedures by Country, Latin America, 2022 – 2032 (1 of 2) |
| Figure 4‑20: Power-Injectable Procedures by Country, Latin America, 2022 – 2032 (2 of 2) |
| Figure 4‑21: Power-Injectable Procedures by Country, Western Europe, 2022 – 2032 |
| Figure 4‑22: Power-Injectable Procedures by Country, Central & Eastern Europe, 2022 – 2032 (1 of 2) |
| Figure 4‑23: Power-Injectable Procedures by Country, Central & Eastern Europe, 2022 – 2032 (2 of 2) |
| Figure 4‑24: Power-Injectable Procedures by Country, Middle East, 2022 – 2032 |
| Figure 4‑25: Power-Injectable Procedures by Country, Asia-Pacific, 2022 – 2032 (1 of 3) |
| Figure 4‑26: Power-Injectable Procedures by Country, Asia-Pacific, 2022 – 2032 (2 of 3) |
| Figure 4‑27: Power-Injectable Procedures by Country, Asia-Pacific, 2022 – 2032 (3 of 3) |
| Figure 4‑28: Power-Injectable Procedures by Country, Africa, 2022 – 2032 |
| Figure 4‑29: Non-Power-Injectable Procedures by Region, Global, 2022 – 2032 |
| Figure 4‑30: Non-Power-Injectable Procedures by Country, North America, 2022 – 2032 |
| Figure 4‑31: Non-Power-Injectable Procedures by Country, Latin America, 2022 – 2032 (1 of 2) |
| Figure 4‑32: Non-Power-Injectable Procedures by Country, Latin America, 2022 – 2032 (2 of 2) |
| Figure 4‑33: Non-Power-Injectable Procedures by Country, Western Europe, 2022 – 2032 |
| Figure 4‑34: Non-Power-Injectable Procedures by Country, Central & Eastern Europe, 2022 – 2032 (1 of 2) |
| Figure 4‑35: Non-Power-Injectable Procedures by Country, Central & Eastern Europe, 2022 – 2032 (2 of 2) |
| Figure 4‑36: Non-Power-Injectable Procedures by Country, Middle East, 2022 – 2032 |
| Figure 4‑37: Non-Power-Injectable Procedures by Country, Asia-Pacific, 2022 – 2032 (1 of 3) |
| Figure 4‑38: Non-Power-Injectable Procedures by Country, Asia-Pacific, 2022 – 2032 (2 of 3) |
| Figure 4‑39: Non-Power-Injectable Procedures by Country, Asia-Pacific, 2022 – 2032 (3 of 3) |
| Figure 4‑40: Non-Power-Injectable Procedures by Country, Africa, 2022 – 2032 |
| Figure 4‑41: Implantable Port Market by Segment, Global, 2022 – 2032 (US$M) |
| Figure 4‑42: Implantable Port Market by Valve type, Global, 2022 – 2032 (US$M) |
| Figure 4‑43: Implantable Port Market by Device Properties, Global, 2022 – 2032 (US$M) |
| Figure 4‑44: Implantable Port Market by Region, Global, 2022 – 2032 (US$M) |
| Figure 4‑45: Implantable Port Maret, Global, 2022 – 2032 |
| Figure 4‑46: Units Sold by Region, Implantable Port Market, Global, 2022 – 2032 |
| Figure 4‑47: Average Selling Price by Region, Implantable Port Market, Global, 2022 – 2032 (US$) |
| Figure 4‑48: Market Value by Region, Implantable Port Market, Global, 2020 – 2030 (US$M) |
| Figure 4‑49: Units Sold by Region, Power-Injectable Implantable Port Market, Global, 2022 – 2032 |
| Figure 4‑50: Average Selling Price by Region, Power-Injectable Implantable Port Market, Global, 2022 – 2032 (US$) |
| Figure 4‑51: Market Value by Region, Power-Injectable Implantable Port Market, Global, 2022 – 2032 (US$M) |
| Figure 4‑52: Power Injectable Implantable Port Market, Global, 2022 – 2032 |
| Figure 4‑53: Units Sold by Region, Power-Injectable Implantable Port Market, Global, 2022 – 2032 |
| Figure 4‑54: Average Selling Price by Region, Power-Injectable Implantable Port Market, Global, 2022 – 2032 (US$) |
| Figure 4‑55: Market Value by Region, Power-Injectable Implantable Port Market, Global, 2022 – 2032 (US$M) |
| Figure 4‑56: Total Non-Power Injectable Implantable Port Market, Global, 2022 – 2032 |
| Figure 4‑57: Units Sold by Region, Non-Power-Injectable Implantable Port Market, Global, 2022 – 2032 |
| Figure 4‑58: Average Selling Price by Region, Non-Power-Injectable Implantable Port Market, Global, 2022 – 2032 (US$) |
| Figure 4‑59: Market Value by Region, Non-Power-Injectable Implantable Port Market, Global, 2022 – 2032 (US$M) |
| Figure 4‑60: Total Single-Lumen Implantable Port Market, Global, 2022 – 2032 |
| Figure 4‑61: Units Sold by Region, Single-Lumen Implantable Port Market, Global, 2022 – 2032 |
| Figure 4‑62: Average Selling Price by Region, Single-Lumen Implantable Port Market, Global, 2022 – 2032 (US$) |
| Figure 4‑63: Market Value by Region, Single-Lumen Implantable Port Market, Global, 2022 – 2032 (US$M) |
| Figure 4‑64: Total Double-Lumen Implantable Port Market, Global, 2022 – 2032 |
| Figure 4‑65: Units Sold by Region, Double-Lumen Implantable Port Market, Global, 2022 – 2032 |
| Figure 4‑66: Average Selling Price by Region, Double-Lumen Implantable Port Market, Global, 2022 – 2032 (US$) |
| Figure 4‑67: Market Value by Region, Double-Lumen Implantable Port Market, Global, 2022 – 2032 (US$M) |
| Figure 4‑68:Total Implantable Port By Valved Type Market, Global, 2022 – 2032 |
| Figure 4‑69: Units Sold by Region, Implantable Port By Valved Type Market, Global, 2022 – 2032 |
| Figure 4‑70: Average Selling Price by Region, Implantable Port By Valved Type Market, Global, 2022 – 2032 (US$) |
| Figure 4‑71: Market Value by Region, Implantable Port By Valved Type Market, Global, 2022 – 2032 (US$M) |
| Figure 4‑72: Total Non-Valved Implantable Port Market, Global, 2022 – 2032 |
| Figure 4‑73: Units Sold by Region, Non-Valved Implantable Port Market, Global, 2022 – 2032 |
| Figure 4‑74: Average Selling Price by Region, Non-Valved Implantable Port Market, Global, 2022 – 2032 (US$) |
| Figure 4‑75: Market Value by Region, Non-Valved Implantable Port Market, Global, 2022 – 2032 (US$M) |
| Figure 4‑76: Total Antithrombogenic Implantable Port Market, Global, 2022 – 2032 |
| Figure 4‑77: Units Sold by Region, Antithrombogenic Implantable Port Market, Global, 2022 – 2032 |
| Figure 4‑78: Average Selling Price by Region, Antithrombogenic Implantable Port Market, Global, 2022 – 2032 (US$) |
| Figure 4‑79: Market Value by Region, Antithrombogenic Implantable Port Market, Global, 2022 – 2032 (US$M) |
| Figure 4‑80: Total Conventional Implantable Port Market, Global, 2022 – 2032 |
| Figure 4‑81: Units Sold by Region, Conventional Implantable Port Market, Global, 2022 – 2032 |
| Figure 4‑82: Average Selling Price by Region, Conventional Implantable Port Market, Global, 2022 – 2032 (US$) |
| Figure 4‑83: Market Value by Region, Conventional Implantable Port Market, Global, 2022 – 2032 (US$M) |
| Figure 4‑84: Leading Competitors, Implantable Port Market, Global, 2025 |
| Figure 5‑1: Port Needle Procedures Covered |
| Figure 5‑2: Port Needle Markets Covered |
| Figure 5‑3: Port Needle Regions Covered, Global (1 of 2) |
| Figure 5‑4: Port Needle Regions Covered, Global (2 of 2) |
| Figure 5‑5: Port Needle Procedures by Region, Global, 2022 – 2032 |
| Figure 5‑6: Port Needle Procedures by Country, North America, 2022 – 2032 |
| Figure 5‑7: Port Needle Procedures by Country, Latin America, 2022 – 2032 (1 of 2) |
| Figure 5‑8: Port Needle Procedures by Country, Latin America, 2022 – 2032 (2 of 2) |
| Figure 5‑9: Port Needle Procedures by Country, Western Europe, 2022 – 2032 |
| Figure 5‑10: Port Needle Procedures by Country, Central & Eastern Europe, 2022 – 2032 (1 of 2) |
| Figure 5‑11: Port Needle Procedures by Country, Central & Eastern Europe, 2022 – 2032 (2 of 2) |
| Figure 5‑12: Port Needle Procedures by Country, Middle East, 2022 – 2032 |
| Figure 5‑13: Port Needle Procedures by Country, Asia-Pacific, 2022 – 2032 (1 of 3) |
| Figure 5‑14: Port Needle Procedures by Country, Asia-Pacific, 2022 – 2032 (2 of 3) |
| Figure 5‑15: Port Needle Procedures by Country, Asia-Pacific, 2022 – 2032 (3 of 3) |
| Figure 5‑16: Port Needle Procedures by Country, Africa, 2022 – 2032 |
| Figure 5‑17: Conventional Procedures by Region, Global, 2022 – 2032 |
| Figure 5‑18: Conventional Procedures by Country, North America, 2022 – 2032 |
| Figure 5‑19: Conventional Procedures by Country, Latin America, 2022 – 2032 (1 of 2) |
| Figure 5‑20: Conventional Procedures by Country, Latin America, 2022 – 2032 (2 of 2) |
| Figure 5‑21: Conventional Procedures by Country, Western Europe, 2022 – 2032 |
| Figure 5‑22: Conventional Procedures by Country, Central & Eastern Europe, 2022 – 2032 (1 of 2) |
| Figure 5‑23: Conventional Procedures by Country, Central & Eastern Europe, 2022 – 2032 (2 of 2) |
| Figure 5‑24: Conventional Procedures by Country, Middle East, 2022 – 2032 |
| Figure 5‑25: Conventional Procedures by Country, Asia-Pacific, 2022 – 2032 (1 of 3) |
| Figure 5‑26: Conventional Procedures by Country, Asia-Pacific, 2022 – 2032 (2 of 3) |
| Figure 5‑27: Conventional Procedures by Country, Asia-Pacific, 2022 – 2032 (3 of 3) |
| Figure 5‑28: Conventional Procedures by Country, Africa, 2022 – 2032 |
| Figure 5‑29: Safety Procedures by Region, Global, 2022 – 2032 |
| Figure 5‑30: Safety Procedures by Country, North America, 2022 – 2032 |
| Figure 5‑31: Safety Procedures by Country, Latin America, 2022 – 2032 (1 of 2) |
| Figure 5‑32: Safety Procedures by Country, Latin America, 2022 – 2032 (2 of 2) |
| Figure 5‑33: Safety Procedures by Country, Western Europe, 2022 – 2032 |
| Figure 5‑34: Safety Procedures by Country, Central & Eastern Europe, 2022 – 2032 (1 of 2) |
| Figure 5‑35: Safety Procedures by Country, Central & Eastern Europe, 2022 – 2032 (2 of 2) |
| Figure 5‑36: Safety Procedures by Country, Middle East, 2022 – 2032 |
| Figure 5‑37: Safety Procedures by Country, Asia-Pacific, 2022 – 2032 (1 of 3) |
| Figure 5‑38: Safety Procedures by Country, Asia-Pacific, 2022 – 2032 (2 of 3) |
| Figure 5‑39: Safety Procedures by Country, Asia-Pacific, 2022 – 2032 (3 of 3) |
| Figure 5‑40: Safety Procedures by Country, Africa, 2022 – 2032 |
| Figure 5‑41: Port Needle Market by Segment, Global, 2022 – 2032 (US$M) |
| Figure 5‑42: Port Needle Market by Region, Global, 2022 – 2032 (US$M) |
| Figure 5‑43: Port Needle Market, Global, 2022 – 2032 |
| Figure 5‑44: Units Sold by Region, Port Needle Market, Global, 2022 – 2032 |
| Figure 5‑45: Average Selling Price by Region, Port Needle Market, Global, 2022 – 2032 (US$) |
| Figure 5‑46: Market Value by Region, Port Needle Market, Global, 2022 – 2032 (US$M) |
| Figure 5‑47: Conventional Port Needle Market, Global, 2022 – 2032 |
| Figure 5‑48: Units Sold by Region, Conventional Port Needle Market, Global, 2022 – 2032 |
| Figure 5‑49: Average Selling Price by Region, Conventional Port Needle Market, Global, 2022 – 2032 (US$) |
| Figure 5‑50: Market Value by Region, Conventional Port Needle Market, Global, 2022 – 2032 (US$M) |
| Figure 5‑51: Safety Port Needle Market by Segment, Global, 2022 – 2032 (US$M) |
| Figure 5‑52: Total Safety Port Needle Market, Global, 2022 – 2032 |
| Figure 5‑53: Units Sold by Region, Safety Port Needle Market, Global, 2022 – 2032 |
| Figure 5‑54: Average Selling Price by Region, Safety Port Needle Market, Global, 2022 – 2032 (US$) |
| Figure 5‑55: Market Value by Region, Safety Port Needle Market, Global, 2022 – 2032 (US$M) |
| Figure 5‑56: Safety Power-Injectable Port Needle Market, Global, 2022 – 2032 |
| Figure 5‑57: Units Sold by Region, Safety Power-Injectable Port Needle Market, Global, 2022 – 2032 |
| Figure 5‑58: Average Selling Price by Region, Safety Power-Injectable Port Needle Market, Global, 2022 – 2032 (US$) |
| Figure 5‑59: Market Value by Region, Safety Power-Injectable Port Needle Market, Global, 2022 – 2032 (US$M) |
| Figure 5‑60: Safety Non-Power-Injectable Port Needle Market, Global, 2022 – 2032 |
| Figure 5‑61: Units Sold by Region, Safety Non-Power-Injectable Port Needle Market, Global, 2022 – 2032 |
| Figure 5‑62: Average Selling Price by Region, Safety Non-Power-Injectable Port Needle Market, Global, 2022 – 2032 (US$) |
| Figure 5‑63: Market Value by Region, Safety Non-Power-Injectable Port Needle Market, Global, 2022 – 2032 (US$M) |
| Figure 5‑64: Leading Competitors, Port Needle Market, Global, 2025 |
| Figure 6‑1: Central Venous Catheter Procedures Covered |
| Figure 6‑2: Central Venous Catheter Markets Covered |
| Figure 6‑3: Central Venous Catheter Regions Covered, Global (1 of 2) |
| Figure 6‑4: Central Venous Catheter Regions Covered, Global (2 of 2) |
| Figure 6‑5: Central Venous Catheter Procedures by Region, Global, 2022 – 2032 |
| Figure 6‑6: Central Venous Catheter Procedures by Country, North America, 2022 – 2032 |
| Figure 6‑7: Central Venous Catheter Procedures by Country, Latin America, 2022 – 2032 (1 of 2) |
| Figure 6‑8: Central Venous Catheter Procedures by Country, Latin America, 2022 – 2032 (2 of 2) |
| Figure 6‑9: Central Venous Catheter Procedures by Country, Western Europe, 2022 – 2032 |
| Figure 6‑10: Central Venous Catheter Procedures by Country, Central & Eastern Europe, 2022 – 2032 (1 of 2) |
| Figure 6‑11: Central Venous Catheter Procedures by Country, Central & Eastern Europe, 2022 – 2032 (2 of 2) |
| Figure 6‑12: Central Venous Catheter Procedures by Country, Middle East, 2022 – 2032 |
| Figure 6‑13: Central Venous Catheter Procedures by Country, Asia-Pacific, 2022 – 2032 (1 of 3) |
| Figure 6‑14: Central Venous Catheter Procedures by Country, Asia-Pacific, 2022 – 2032 (2 of 3) |
| Figure 6‑15: Central Venous Catheter Procedures by Country, Asia-Pacific, 2022 – 2032 (3 of 3) |
| Figure 6‑16: Central Venous Catheter Procedures by Country, Africa, 2022 – 2032 |
| Figure 6‑17: Acute CVC Procedures by Region, Global, 2022 – 2032 |
| Figure 6‑18: Acute CVC Procedures by Country, North America, 2022 – 2032 |
| Figure 6‑19: Acute CVC Procedures by Country, Latin America, 2022 – 2032 (1 of 2) |
| Figure 6‑20: Acute CVC Procedures by Country, Latin America, 2022 – 2032 (2 of 2) |
| Figure 6‑21: Acute CVC Procedures by Country, Western Europe, 2022 – 2032 |
| Figure 6‑22: Acute CVC Procedures by Country, Central & Eastern Europe, 2022 – 2032 (1 of 2) |
| Figure 6‑23: Acute CVC Procedures by Country, Central & Eastern Europe, 2022 – 2032 (2 of 2) |
| Figure 6‑24: Acute CVC Procedures by Country, Middle East, 2022 – 2032 |
| Figure 6‑25: Acute CVC Procedures by Country, Asia-Pacific, 2022 – 2032 (1 of 3) |
| Figure 6‑26: Acute CVC Procedures by Country, Asia-Pacific, 2022 – 2032 (2 of 3) |
| Figure 6‑27: Acute CVC Procedures by Country, Asia-Pacific, 2022 – 2032 (3 of 3) |
| Figure 6‑28: Acute CVC Procedures by Country, Africa, 2022 – 2032 |
| Figure 6‑29: Chronic CVC Procedures by Region, Global, 2022 – 2032 |
| Figure 6‑30: Chronic CVC Procedures by Country, North America, 2022 – 2032 |
| Figure 6‑31: Chronic CVC Procedures by Country, Latin America, 2022 – 2032 (1 of 2) |
| Figure 6‑32: Chronic CVC Procedures by Country, Latin America, 2022 – 2032 (2 of 2) |
| Figure 6‑33: Chronic CVC Procedures by Country, Western Europe, 2022 – 2032 |
| Figure 6‑34: Chronic CVC Procedures by Country, Central & Eastern Europe, 2022 – 2032 (1 of 2) |
| Figure 6‑35: Chronic CVC Procedures by Country, Central & Eastern Europe, 2022 – 2032 (2 of 2) |
| Figure 6‑36: Chronic CVC Procedures by Country, Middle East, 2022 – 2032 |
| Figure 6‑37: Chronic CVC Procedures by Country, Asia-Pacific, 2022 – 2032 (1 of 3) |
| Figure 6‑38: Chronic CVC Procedures by Country, Asia-Pacific, 2022 – 2032 (2 of 3) |
| Figure 6‑39: Chronic CVC Procedures by Country, Asia-Pacific, 2022 – 2032 (3 of 3) |
| Figure 6‑40: Chronic CVC Procedures by Country, Africa, 2022 – 2032 |
| Figure 6‑41: Central Venous Catheter Market by Segment, Global, 2022 – 2032 (US$M) |
| Figure 6‑42: Central Venous Catheter Market by Region, Global, 2022 – 2032 (US$M) |
| Figure 6‑43: Central Venous Catheter Market, Global, 2022 – 2032 |
| Figure 6‑44: Units Sold by Region, Central Venous Catheter Market, Global, 2022 – 2032 |
| Figure 6‑45: Average Selling Price by Region, Central Venous Catheter Market, Global, 2022 – 2032 (US$) |
| Figure 6‑46: Market Value by Region, Central Venous Catheter Market, Global, 2022 – 2032 (US$M) |
| Figure 6‑47: Acute Central Venous Catheter Market by Segment, Global, 2022 – 2032 (US$M) |
| Figure 6‑48: Total Acute Central Venous Catheter Market, Global, 2022 – 2032 |
| Figure 6‑49: Units Sold by Region, Acute Central Venous Catheter Market, Global, 2022 – 2032 |
| Figure 6‑50: Average Selling Price by Region, Acute Central Venous Catheter Market, Global, 2022 – 2032 (US$) |
| Figure 6‑51: Market Value by Region, Acute Central Venous Catheter Market, Global, 2022 – 2032 (US$M) |
| Figure 6‑52: Acute Power-Injectable Central Venous Catheter Market, Global, 2022 – 2032 |
| Figure 6‑53: Units Sold by Region, Acute Power-Injectable Central Venous Catheter Market, Global, 2022 – 2032 |
| Figure 6‑54: Average Selling Price by Region, Acute Power-Injectable Central Venous Catheter Market, Global, 2022 – 2032 (US$) |
| Figure 6‑55: Market Value by Region, Acute Power-Injectable Central Venous Catheter Market, Global, 2022 – 2032 (US$M) |
| Figure 6‑56: Acute Non-Power-Injectable Central Venous Catheter Market, Global, 2022 – 2032 |
| Figure 6‑57: Units Sold by Region, Acute Non-Power-Injectable Central Venous Catheter Market, Global, 2022 – 2032 |
| Figure 6‑58: Average Selling Price by Region, Acute Non-Power-Injectable Central Venous Catheter Market, Global, 2022 – 2032 (US$) |
| Figure 6‑59: Market Value by Region, Acute Non-Power-Injectable Central Venous Catheter Market, Global, 2022 – 2032 (US$M) |
| Figure 6‑60: Chronic Central Venous Catheter Market by Segment, Global, 2022 – 2032 (US$M) |
| Figure 6‑61: Total Chronic Central Venous Catheter Market, Global, 2022 – 2032 |
| Figure 6‑62: Units Sold by Region, Chronic Central Venous Catheter Market, Global, 2022 – 2032 |
| Figure 6‑63: Average Selling Price by Region, Chronic Central Venous Catheter Market, Global, 2022 – 2032 (US$) |
| Figure 6‑64: Market Value by Region, Chronic Central Venous Catheter Market, Global, 2022 – 2032 (US$M) |
| Figure 6‑65: Chronic Power-Injectable Central Venous Catheter Market, Global, 2022 – 2032 |
| Figure 6‑66: Units Sold by Region, Chronic Power-Injectable Central Venous Catheter Market, Global, 2022 – 2032 |
| Figure 6‑67: Average Selling Price by Region, Chronic Power-Injectable Central Venous Catheter Market, Global, 2022 – 2032 (US$) |
| Figure 6‑68: Market Value by Region, Chronic Power-Injectable Central Venous Catheter Market, Global, 2022 – 2032 (US$M) |
| Figure 6‑69: Chronic Non-Power-Injectable Central Venous Catheter Market, Global, 2022 – 2032 |
| Figure 6‑70: Units Sold by Region, Chronic Non-Power-Injectable Central Venous Catheter Market, Global, 2022 – 2032 |
| Figure 6‑71: Average Selling Price by Region, Chronic Non-Power-Injectable Central Venous Catheter Market, Global, 2022 – 2032 (US$) |
| Figure 6‑72: Market Value by Region, Chronic Non-Power-Injectable Central Venous Catheter Market, Global, 2022 – 2032 (US$M) |
| Figure 6‑73: Leading Competitors, Central Venous Catheter Market, Global, 2025 |
| Figure 7‑1: Peripherally Inserted Central Catheter Procedures Covered |
| Figure 7‑2: Peripherally Inserted Central Catheter Markets Covered |
| Figure 7‑3: Peripherally Inserted Central Catheter Regions Covered, Global (1 of 2) |
| Figure 7‑4: Peripherally Inserted Central Catheter Regions Covered, Global (2 of 2) |
| Figure 7‑5: Peripherally Inserted Central Catheter Procedures by Region, Global, 2022 – 2032 |
| Figure 7‑6: Peripherally Inserted Central Catheter Procedures by Country, North America, 2022 – 2032 |
| Figure 7‑7: Peripherally Inserted Central Catheter Procedures by Country, Latin America, 2022 – 2032 (1 of 2) |
| Figure 7‑8: Peripherally Inserted Central Catheter Procedures by Country, Latin America, 2022 – 2032 (2 of 2) |
| Figure 7‑9: Peripherally Inserted Central Catheter Procedures by Country, Western Europe, 2022 – 2032 |
| Figure 7‑10: Peripherally Inserted Central Catheter Procedures by Country, Central & Eastern Europe, 2022 – 2032 (1 of 2) |
| Figure 7‑11: Peripherally Inserted Central Catheter Procedures by Country, Central & Eastern Europe, 2022 – 2032 (2 of 2) |
| Figure 7‑12: Peripherally Inserted Central Catheter Procedures by Country, Middle East, 2022 – 2032 |
| Figure 7‑13: Peripherally Inserted Central Catheter Procedures by Country, Asia-Pacific, 2022 – 2032 (1 of 3) |
| Figure 7‑14: Peripherally Inserted Central Catheter Procedures by Country, Asia-Pacific, 2022 – 2032 (2 of 3) |
| Figure 7‑15: Peripherally Inserted Central Catheter Procedures by Country, Asia-Pacific, 2022 – 2032 (3 of 3) |
| Figure 7‑16: Peripherally Inserted Central Catheter Procedures by Country, Africa, 2022 – 2032 |
| Figure 7‑17: Power-Injectable PICC Procedures by Region, Global, 2022 – 2032 |
| Figure 7‑18: Power-Injectable PICC Procedures by Country, North America, 2022 – 2032 |
| Figure 7‑19: Power-Injectable PICC Procedures by Country, Latin America, 2022 – 2032 (1 of 2) |
| Figure 7‑20: Power-Injectable PICC Procedures by Country, Latin America, 2022 – 2032 (2 of 2) |
| Figure 7‑21: Power-Injectable PICC Procedures by Country, Western Europe, 2022 – 2032 |
| Figure 7‑22: Power-Injectable PICC Procedures by Country, Central & Eastern Europe, 2022 – 2032 (1 of 2) |
| Figure 7‑23: Power-Injectable PICC Procedures by Country, Central & Eastern Europe, 2022 – 2032 (2 of 2) |
| Figure 7‑24: Power-Injectable PICC Procedures by Country, Middle East, 2022 – 2032 |
| Figure 7‑25: Power-Injectable PICC Procedures by Country, Asia-Pacific, 2022 – 2032 (1 of 3) |
| Figure 7‑26: Power-Injectable PICC Procedures by Country, Asia-Pacific, 2022 – 2032 (2 of 3) |
| Figure 7‑27: Power-Injectable PICC Procedures by Country, Asia-Pacific, 2022 – 2032 (3 of 3) |
| Figure 7‑28: Power-Injectable PICC Procedures by Country, Africa, 2022 – 2032 |
| Figure 7‑29: Non-Power-Injectable PICC Procedures by Region, Global, 2022 – 2032 |
| Figure 7‑30: Non-Power-Injectable PICC Procedures by Country, North America, 2022 – 2032 |
| Figure 7‑31: Non-Power-Injectable PICC Procedures by Country, Latin America, 2022 – 2032 (1 of 2) |
| Figure 7‑32: Non-Power-Injectable PICC Procedures by Country, Latin America, 2022 – 2032 (2 of 2) |
| Figure 7‑33: Non-Power-Injectable PICC Procedures by Country, Western Europe, 2022 – 2032 |
| Figure 7‑34: Non-Power-Injectable PICC Procedures by Country, Central & Eastern Europe, 2022 – 2032 (1 of 2) |
| Figure 7‑35: Non-Power-Injectable PICC Procedures by Country, Central & Eastern Europe, 2022 – 2032 (2 of 2) |
| Figure 7‑36: Non-Power-Injectable PICC Procedures by Country, Middle East, 2022 – 2032 |
| Figure 7‑37: Non-Power-Injectable PICC Procedures by Country, Asia-Pacific, 2022 – 2032 (1 of 3) |
| Figure 7‑38: Non-Power-Injectable PICC Procedures by Country, Asia-Pacific, 2022 – 2032 (2 of 3) |
| Figure 7‑39: Non-Power-Injectable PICC Procedures by Country, Asia-Pacific, 2022 – 2032 (3 of 3) |
| Figure 7‑40: Non-Power-Injectable PICC Procedures by Country, Africa, 2022 – 2032 |
| Figure 7‑41: Peripherally Inserted Central Catheter Market by Lumen Count, Global, 2022 – 2032 (US$M) |
| Figure 7‑42: Peripherally Inserted Central Catheter Market by Device Type, Global, 2022 – 2032 (US$M) |
| Figure 7‑43: Peripherally Inserted Central Catheter Market by Kit Type, Global, 2022 – 2032 (US$M) |
| Figure 7‑44: Peripherally Inserted Central Catheter Market by Region, Global, 2022 – 2032 (US$M) |
| Figure 7‑45: Peripherally Inserted Central Catheter Market, Global, 2022 – 2032 |
| Figure 7‑46: Units Sold by Region, Peripherally Inserted Central Catheter Market, Global, 2022 – 2032 |
| Figure 7‑47: Average Selling Price by Region, Peripherally Inserted Central Catheter Market, Global, 2022 – 2032 (US$) |
| Figure 7‑48: Market Value by Region, Peripherally Inserted Central Catheter Market, Global, 2022 – 2032 (US$M) |
| Figure 7‑49: Single-Lumen Peripherally Inserted Central Catheter Market, Global, 2022 – 2032 |
| Figure 7‑50: Units Sold by Region, Single-Lumen Peripherally Inserted Central Catheter Market, Global, 2022 – 2032 |
| Figure 7‑51: Average Selling Price by Region, Single-Lumen Peripherally Inserted Central Catheter Market, Global, 2022 – 2032 (US$) |
| Figure 7‑52: Market Value by Region, Single-Lumen Peripherally Inserted Central Catheter Market, Global, 2022 – 2032 (US$M) |
| Figure 7‑53: Double-Lumen Peripherally Inserted Central Catheter Market, Global, 2022 – 2032 |
| Figure 7‑54: Units Sold by Region, Double-Lumen Peripherally Inserted Central Catheter Market, Global, 2022– 2032 |
| Figure 7‑55: Average Selling Price by Region, Double-Lumen Peripherally Inserted Central Catheter Market, Global, 2022 – 2032 (US$) |
| Figure 7‑56: Market Value by Region, Double-Lumen Peripherally Inserted Central Catheter Market, Global, 2022 – 2032 (US$M) |
| Figure 7‑57: Triple-Lumen Peripherally Inserted Central Catheter Market, Global, 2022 – 2032 |
| Figure 7‑58: Units Sold by Region, Triple-Lumen Peripherally Inserted Central Catheter Market, Global, 2022 – 2032 |
| Figure 7‑59: Average Selling Price by Region, Triple-Lumen Peripherally Inserted Central Catheter Market, Global, 2022 – 2032 (US$) |
| Figure 7‑60: Market Value by Region, Triple-Lumen Peripherally Inserted Central Catheter Market, Global, 2022 – 2032 (US$M) |
| Figure 7‑61: Power-Injectable Peripherally Inserted Central Catheter Market by Type, U.S., 2022 – 2032 (US$M) |
| Figure 7‑62: Power-Injectable Peripherally Inserted Central Catheter Market, U.S., 2022 – 2032 |
| Figure 7‑63: Units Sold by Region, Power-Injectable Peripherally Inserted Central Catheter Market, Global, 2022 – 2032 |
| Figure 7‑64: Average Selling Price by Region, Power-Injectable Peripherally Inserted Central Catheter Market, Global, 2022 – 2032 (US$) |
| Figure 7‑65: Market Value by Region, Power-Injectable Peripherally Inserted Central Catheter Market, Global, 2022 – 2032 (US$M) |
| Figure 7‑66: Advanced Material Power-Injectable Peripherally Inserted Central Catheter Market, U.S., 2022 – 2032 |
| Figure 7‑67: Units Sold by Region, Advanced Material Power-Injectable Peripherally Inserted Central Catheter, Global, 2022 – 2032 |
| Figure 7‑68: Average Selling Price by Region, Advanced Material Power-Injectable Peripherally Inserted Central Catheter, Global, 2022 – 2032 (US$) |
| Figure 7‑69: Market Value by Region, Advanced Material Power-Injectable Peripherally Inserted Central Catheter, Global, 2022 – 2032 (US$M) |
| Figure 7‑70: Conventional Power-Injectable Peripherally Inserted Central Catheter Market, U.S., 2022 – 2032 |
| Figure 7‑71: Units Sold by Region, Conventional Material Power-Injectable Peripherally Inserted Central Catheter, Global, 2022 – 2032 |
| Figure 7‑72: Average Selling Price by Region, Conventional Material Power-Injectable Peripherally Inserted Central Catheter, Global, 2022 – 2032 (US$) |
| Figure 7‑73: Market Value by Region, Conventional Material Power-Injectable Peripherally Inserted Central Catheter, Global, 2022 – 2032 (US$M) |
| Figure 7‑74: Non-Power-Injectable Peripherally Inserted Central Catheter Market, Global, 2022 – 2032 |
| Figure 7‑75: Units Sold by Region, Non-Power-Injectable Peripherally Inserted Central Catheter Market, Global, 2022 – 2032 |
| Figure 7‑76: Average Selling Price by Region, Non-Power-Injectable Peripherally Inserted Central Catheter Market, Global, 2022 – 2032 (US$) |
| Figure 7‑77: Market Value by Region, Non-Power-Injectable Peripherally Inserted Central Catheter Market, Global, 2022– 2032 (US$M) |
| Figure 7‑78: Tip-Placement Kit Peripherally Inserted Central Catheter Market, Global, 2022 – 2032 |
| Figure 7‑79: Units Sold by Region, Tip-Placement Kit Peripherally Inserted Central Catheter Market, Global, 2022 – 2032 |
| Figure 7‑80: Average Selling Price by Region, Tip-Placement Kit Peripherally Inserted Central Catheter Market, Global, 2022 – 2032 (US$) |
| Figure 7‑81: Market Value by Region, Tip-Placement Kit Peripherally Inserted Central Catheter Market, Global, 2022 – 2032 (US$M) |
| Figure 7‑82: Conventional Kit Peripherally Inserted Central Catheter Market, Global, 2022 – 2032 |
| Figure 7‑83: Units Sold by Region, Conventional Kit Peripherally Inserted Central Catheter Market, Global, 2022 – 2032 |
| Figure 7‑84: Average Selling Price by Region, Conventional Kit Peripherally Inserted Central Catheter Market, Global, 2022 – 2032 (US$) |
| Figure 7‑85: Market Value by Region, Conventional Kit Peripherally Inserted Central Catheter Market, Global, 2022 – 2032 (US$M) |
| Figure 7‑86: Leading Competitors, Peripherally Inserted Central Catheter Market, Global, 2025 |
| Figure 8‑1: Peripheral Intravenous Catheter Procedures Covered |
| Figure 8‑2: Peripheral Intravenous Catheter Markets Covered |
| Figure 8‑3: Peripheral Intravenous Catheter Regions Covered, Global (1 of 2) |
| Figure 8‑4: Peripheral Intravenous Catheter Regions Covered, Global (2 of 2) |
| Figure 8‑5: Peripheral Intravenous Catheter Procedures by Region, Global, 2022 – 2032 |
| Figure 8‑6: Peripheral Intravenous Catheter Procedures by Country, North America, 2022 – 2032 |
| Figure 8‑7: Peripheral Intravenous Catheter Procedures by Country, Latin America, 2022 – 2032 (1 of 2) |
| Figure 8‑8: Peripheral Intravenous Catheter Procedures by Country, Latin America, 2022 – 2032 (2 of 2) |
| Figure 8‑9: Peripheral Intravenous Catheter Procedures by Country, Western Europe, 2022 – 2032 (1 of 2) |
| Figure 8‑10: Peripheral Intravenous Catheter Procedures by Country, Western Europe, 2022 – 2032 (2 of 2) |
| Figure 8‑11: Peripheral Intravenous Catheter Procedures by Country, Central & Eastern Europe, 2022 – 2032 (1 of 2) |
| Figure 8‑12: Peripheral Intravenous Catheter Procedures by Country, Central & Eastern Europe, 2022 – 2032 (2 of 2) |
| Figure 8‑13: Peripheral Intravenous Catheter Procedures by Country, Middle East, 2022 – 2032 |
| Figure 8‑14: Peripheral Intravenous Catheter Procedures by Country, Asia-Pacific, 2022 – 2032 (1 of 3) |
| Figure 8‑15: Peripheral Intravenous Catheter Procedures by Country, Asia-Pacific, 2022 – 2032 (2 of 3) |
| Figure 8‑16: Peripheral Intravenous Catheter Procedures by Country, Asia-Pacific, 2022 – 2032 (3 of 3) |
| Figure 8‑17: Peripheral Intravenous Catheter Procedures by Country, Africa, 2022 – 2032 |
| Figure 8‑18: Peripheral Intravenous Catheter Market by Segment, Global, 2022 – 2032 (US$M) |
| Figure 8‑19: Peripheral Intravenous Catheter Market by Region, Global, 2022 – 2032 (US$M) |
| Figure 8‑20: Peripheral Intravenous Catheter Market, Global, 2022 – 2032 |
| Figure 8‑21: Units Sold by Region, Peripheral Intravenous Catheter Market, Global, 2022 – 2032 |
| Figure 8‑22: Average Selling Price by Region, Peripheral Intravenous Catheter Market, Global, 2022 – 2032 (US$) |
| Figure 8‑23: Market Value by Region, Peripheral Intravenous Catheter Market, Global, 2022 – 2032 (US$M) |
| Figure 8‑24: Conventional Peripheral Intravenous Catheter Market, Global, 2022 – 2032 |
| Figure 8‑25: Units Sold by Region, Conventional Peripheral Intravenous Catheter Market, Global, 2022 – 2032 |
| Figure 8‑26: Average Selling Price by Region, Conventional Peripheral Intravenous Catheter Market, Global, 2022 – 2032 (US$) |
| Figure 8‑27: Market Value by Region, Conventional Peripheral Intravenous Catheter Market, Global, 2022 – 2032 (US$M) |
| Figure 8‑28: Safety Peripheral Intravenous Catheter Market by Segment, Global, 2022 – 2032 (US$M) |
| Figure 8‑29: Total Safety PIVC Market, Global, 2022– 2032 |
| Figure 8‑30: Units Sold by Region, Safety PIVC Market, Global, 2022– 2032 |
| Figure 8‑31: Average Selling Price by Region, Safety PIVC Market, Global, 2022– 2032 (US$) |
| Figure 8‑32: Market Value by Region, Hemodialysis Catheter Market, Global, 2022– 2032 (US$M) |
| Figure 8‑33: Blood-Control Catheter Market by Segment, Global, 2022 – 2032 (US$M) |
| Figure 8‑34: Total Blood-Control Catheter Market, Global, 2022– 2032 |
| Figure 8‑35: Units Sold by Region, Blood-Control Catheter Market, Global, 2022– 2032 |
| Figure 8‑36: Average Selling Price by Region, Blood-Control Catheter Market, Global, 2022– 2032 (US$) |
| Figure 8‑37: Market Value by Region, Blood-Control Catheter Market, Global, 2022– 2032 (US$M) |
| Figure 8‑38: Integrated Catheter Market, Global, 2022 – 2032 |
| Figure 8‑39: Units Sold by Region, Integrated Catheter Market, Global, 2022 – 2032 |
| Figure 8‑40: Average Selling Price by Region, Integrated Catheter Market, Global, 2022 – 2032 (US$) |
| Figure 8‑41: Market Value by Region, Integrated Catheter Market, Global, 2022 – 2032 (US$M) |
| Figure 8‑42: Non-Integrated Catheter Market, Global, 2022– 2032 |
| Figure 8‑43: Units Sold by Region, Non-Integrated Catheter Market, Global, 2022 – 2032 |
| Figure 8‑44: Average Selling Price by Region, Non-Integrated Catheter Market, Global, 2022 – 2032 (US$) |
| Figure 8‑45: Market Value by Region, Non-Integrated Catheter Market, Global, 2022 – 2032 (US$M) |
| Figure 8‑46: Non-Blood Control Catheter Market by Segment, Global, 2022 – 2032 (US$M) |
| Figure 8‑47: Total Non-Blood Control Catheter Market, Global, 2022– 2032 |
| Figure 8‑48: Units Sold by Region, Non-Blood Control Catheter Market, Global, 2022– 2032 |
| Figure 8‑49: Average Selling Price by Region, Non-Blood Control Catheter Market, Global, 2022– 2032 (US$) |
| Figure 8‑50: Market Value by Region, Non-Blood Control Catheter Market, Global, 2022– 2032 (US$M) |
| Figure 8‑51: Non-Blood Control Active Catheter Market, Global, 2022 – 2032 |
| Figure 8‑52: Units Sold by Region, Non-Blood Control Active Catheter Market, Global, 2022 – 2032 |
| Figure 8‑53: Average Selling Price by Region, Non-Blood Control Active Catheter Market, Global, 2022 – 2032 (US$) |
| Figure 8‑54: Market Value by Region, Non-Blood Control Active Catheter Market, Global, 2022 – 2032 (US$M) |
| Figure 8‑55: Non-Blood Control Passive Catheter Market, Global, 2022 – 2032 |
| Figure 8‑56: Units Sold by Region, Non-Blood Control Passive Catheter Market, Global, 2022 – 2032 |
| Figure 8‑57: Average Selling Price by Region, Non-Blood Control Passive Catheter Market, Global, 2022 – 2032 (US$) |
| Figure 8‑58: Market Value by Region, Non-Blood Control Passive Catheter Market, Global, 2022 – 2032 (US$M) |
| Figure 8‑59: Leading Competitors, Peripheral Intravenous Catheter Market, Global, 2025 |
| Figure 9‑1: Extended Dwell Catheter Regions Covered, Global (1 of 2) |
| Figure 9‑2: Extended Dwell Catheter Regions Covered, Global (2 of 2) |
| Figure 9‑3: Extended Dwell Catheter Procedures by Region, Global, 2022 – 2032 |
| Figure 9‑4: Extended Dwell Catheter Procedures by Country, North America, 2022 – 2032 |
| Figure 9‑5: Extended Dwell Catheter Procedures by Country, Latin America, 2022 – 2032 (1 of 2) |
| Figure 9‑6: Extended Dwell Catheter Procedures by Country, Latin America, 2022 – 2032 (2 of 2) |
| Figure 9‑7: Extended Dwell Catheter Procedures by Country, Western Europe, 2022– 2032 (1 of 2) |
| Figure 9‑8: Extended Dwell Catheter Procedures by Country, Western Europe, 2022 – 2032 (2 of 2) |
| Figure 9‑9: Extended Dwell Catheter Procedures by Country, Central & Eastern Europe, 2022 – 2032 (1 of 2) |
| Figure 9‑10: Extended Dwell Catheter Procedures by Country, Central & Eastern Europe, 2022 – 2032 (2 of 2) |
| Figure 9‑11 Extended Dwell Catheter Procedures by Country, Middle East, 2022 – 2032 |
| Figure 9‑12: Extended Dwell Catheter Procedures by Country, Asia-Pacific, 2022 – 2032 (1 of 3) |
| Figure 9‑13: Extended Dwell Catheter Procedures by Country, Asia-Pacific, 2022 – 2032 (2 of 3) |
| Figure 9‑14: Extended Dwell Catheter Procedures by Country, Asia-Pacific, 2022 – 2032 (3 of 3) |
| Figure 9‑15: Extended Dwell Catheter Procedures by Country, Africa, 2022 – 2032 |
| Figure 9‑16: Extended dwell catheter Market, Global, 2022 – 2032 |
| Figure 9‑17: Units Sold by Region, Extended dwell catheter Market, Global, 2022 – 2032 |
| Figure 9‑18: Average Selling Price by Region, Extended dwell catheter Market, Global, 2022 – 2032 (US$) |
| Figure 9‑19: Market Value by Region, Extended dwell catheter Market, Global, 2022 – 2032 (US$M) |
| Figure 9‑20: Leading Competitors, Extended Dwell Catheter Market, Global, 2025 |
| Figure 10‑1: Midline Procedures Covered |
| Figure 10‑2: Midline Markets Covered |
| Figure 10‑3: Midline Regions Covered, Global (1 of 2) |
| Figure 10‑4: Midline Regions Covered, Global (2 of 2) |
| Figure 10‑5: Midline Procedures by Region, Global, 2022 – 2032 |
| Figure 10‑6: Midline Procedures by Country, North America, 2022 – 2032 |
| Figure 10‑7: Midline Procedures by Country, Latin America, 2022 – 2032 (1 of 2) |
| Figure 10‑8: Midline Procedures by Country, Latin America, 2022 – 2032 (2 of 2) |
| Figure 10‑9: Midline Procedures by Country, Western Europe, 2022 – 2032 |
| Figure 10‑10: Midline Procedures by Country, Central & Eastern Europe, 2022 – 2032 (1 of 2) |
| Figure 10‑11: Midline Procedures by Country, Central & Eastern Europe, 2022 – 2032 (2 of 2) |
| Figure 10‑12: Midline Procedures by Country, Middle East, 2022 – 2032 |
| Figure 10‑13: Midline Procedures by Country, Asia-Pacific, 2022 – 2032 (1 of 3) |
| Figure 10‑14: Midline Procedures by Country, Asia-Pacific, 2022 – 2032 (2 of 3) |
| Figure 10‑15: Midline Procedures by Country, Asia-Pacific, 2022 – 2032 (3 of 3) |
| Figure 10‑16: Midline Procedures by Country, Africa, 2022 – 2032 |
| Figure 10‑17: Midline Market by Segment, Global, 2022 – 2032 (US$M) |
| Figure 10‑18: Midline Market by Region, Global, 2022 – 2032 (US$M) |
| Figure 10‑19: Midline Market, Global, 2022 – 2032 |
| Figure 10‑20: Units Sold by Region, Midline Market, Global, 2022 – 2032 |
| Figure 10‑21: Average Selling Price by Region, Midline Market, Global, 2022 – 2032 (US$) |
| Figure 10‑22: Market Value by Region, Midline Market, Global, 2022 – 2032 (US$M) |
| Figure 10‑23: MST Midline Market by Segment, Global, 2022 – 2032 (US$M) |
| Figure 10‑24: Total MST Midline Market, Global, 2022 – 2032 |
| Figure 10‑25: Units Sold by Region, MST Midline Market, Global, 2022 – 2032 |
| Figure 10‑26: Average Selling Price by Region, MST Midline Market, Global, 2022 – 2032 (US$) |
| Figure 10‑27: Market Value by Region, MST Midline Market, Global, 2022 – 2032 (US$M) |
| Figure 10‑28: Power-Injectable MST Midline Market, Global, 2022 – 2032 |
| Figure 10‑29: Units Sold by Region, Power-Injectable MST Midline Market, Global, 2022 – 2032 |
| Figure 10‑30: Average Selling Price by Region, Power-Injectable MST Midline Market, Global, 2022 – 2032 (US$) |
| Figure 10‑31: Market Value by Region, Power-Injectable MST Midline Market, Global, 2022 – 2032 (US$M) |
| Figure 10‑32: Non-Power-Injectable MST Midline Market, Global, 2022 – 2032 |
| Figure 10‑33: Units Sold by Region, Non-Power-Injectable MST Midline Market, Global, 2022 – 2032 |
| Figure 10‑34: Average Selling Price by Region, Non-Power-Injectable MST Midline Market, Global, 2022 – 2032 (US$) |
| Figure 10‑35: Market Value by Region, Non-Power-Injectable MST Midline Market, Global, 2022 – 2032 (US$M) |
| Figure 10‑36: AST Midline Market, Global, 2022 – 2032 |
| Figure 10‑37: Units Sold by Region, AST Midline Market, Global, 2022 – 2032 |
| Figure 10‑38: Average Selling Price by Region, AST Midline Market, Global, 2022 – 2032 (US$) |
| Figure 10‑39: Market Value by Region, AST Midline Market, Global, 2022 – 2032 (US$M) |
| Figure 10‑40: Leading Competitors, Midline Market, Global, 2025 |
| Figure 11‑1: Dialysis Catheter Procedures Covered |
| Figure 11‑2: Dialysis Catheter Markets Covered |
| Figure 11‑3: Dialysis Catheter Regions Covered, Global (1 of 2) |
| Figure 11‑4: Dialysis Catheter Regions Covered, Global (2 of 2) |
| Figure 11‑5: Dialysis Catheter Procedures by Region, Global, 2022 – 2032 |
| Figure 11‑6: Dialysis Catheter Procedures by Country, North America, 2022 – 2032 |
| Figure 11‑7: Dialysis Catheter Procedures by Country, Latin America, 2022 – 2032 (1 of 2) |
| Figure 11‑8: Dialysis Catheter Procedures by Country, Latin America, 2022 – 2032 (2 of 2) |
| Figure 11‑9: Dialysis Catheter Procedures by Country, Western Europe, 2022 – 2032 |
| Figure 11‑10: Dialysis Catheter Procedures by Country, Central & Eastern Europe, 2022 – 2032 (1 of 2) |
| Figure 11‑11: Dialysis Catheter Procedures by Country, Central & Eastern Europe, 2022 – 2032 (2 of 2) |
| Figure 11‑12: Dialysis Catheter Procedures by Country, Middle East, 2022 – 2032 |
| Figure 11‑13: Dialysis Catheter Procedures by Country, Asia-Pacific, 2022 – 2032 (1 of 3) |
| Figure 11‑14: Dialysis Catheter Procedures by Country, Asia-Pacific, 2022 – 2032 (2 of 3) |
| Figure 11‑15: Dialysis Catheter Procedures by Country, Asia-Pacific, 2022 – 2032 (3 of 3) |
| Figure 11‑16: Dialysis Catheter Procedures by Country, Africa, 2022 – 2032 |
| Figure 11‑17: Long-Term Hemodialysis Catheter Procedures by Region, Global, 2022 – 2032 |
| Figure 11‑18: Long-Term Hemodialysis Catheter Procedures by Country, North America, 2022 – 2032 |
| Figure 11‑19: Long-Term Hemodialysis Catheter Procedures by Country, Latin America, 2022 – 2032 (1 of 2) |
| Figure 11‑20: Long-Term Hemodialysis Catheter Procedures by Country, Latin America, 2022 – 2032 (2 of 2) |
| Figure 11‑21: Long-Term Hemodialysis Catheter Procedures by Country, Western Europe, 2022 – 2032 |
| Figure 11‑22: Long-Term Hemodialysis Catheter Procedures by Country, Central & Eastern Europe, 2022 – 2032 (1 of 2) |
| Figure 11‑23: Long-Term Hemodialysis Catheter Procedures by Country, Central & Eastern Europe, 2022 – 2032 (2 of 2) |
| Figure 11‑24: Long-Term Hemodialysis Catheter Procedures by Country, Middle East, 2022 – 2032 |
| Figure 11‑25: Long-Term Hemodialysis Catheter Procedures by Country, Asia-Pacific, 2022 – 2032 (1 of 3) |
| Figure 11‑26: Long-Term Hemodialysis Catheter Procedures by Country, Asia-Pacific, 2022 – 2032 (2 of 3) |
| Figure 11‑27: Long-Term Hemodialysis Catheter Procedures by Country, Asia-Pacific, 2022 – 2032 (3 of 3) |
| Figure 11‑28: Long-Term Hemodialysis Catheter Procedures by Country, Africa, 2022 – 2032 |
| Figure 11‑29: Short-Term Hemodialysis Catheter Procedures by Region, Global, 2022 – 2032 |
| Figure 11‑30: Short-Term Hemodialysis Catheter Procedures by Country, North America, 2022 – 2032 |
| Figure 11‑31: Short-Term Hemodialysis Catheter Procedures by Country, Latin America, 2022 – 2032 (1 of 2) |
| Figure 11‑32: Short-Term Hemodialysis Catheter Procedures by Country, Latin America, 2022 – 2032 (2 of 2) |
| Figure 11‑33: Short-Term Hemodialysis Catheter Procedures by Country, Western Europe, 2022 – 2032 |
| Figure 11‑34: Short-Term Hemodialysis Catheter Procedures by Country, Central & Eastern Europe, 2022 – 2032 (1 of 2) |
| Figure 11‑35: Short-Term Hemodialysis Catheter Procedures by Country, Central & Eastern Europe, 2022 – 2032 (2 of 2) |
| Figure 11‑36: Short-Term Hemodialysis Catheter Procedures by Country, Middle East, 2022 – 2032 |
| Figure 11‑37: Short-Term Hemodialysis Catheter Procedures by Country, Asia-Pacific, 2022 – 2032 (1 of 3) |
| Figure 11‑38: Short-Term Hemodialysis Catheter Procedures by Country, Asia-Pacific, 2022 – 2032 (2 of 3) |
| Figure 11‑39: Short-Term Hemodialysis Catheter Procedures by Country, Asia-Pacific, 2022 – 2032 (3 of 3) |
| Figure 11‑40: Short-Term Hemodialysis Catheter Procedures by Country, Africa, 2022 – 2032 |
| Figure 11‑41: Peritoneal Catheter Procedures by Region, Global, 2022 – 2032 |
| Figure 11‑42: Peritoneal Catheter Procedures by Country, North America, 2022 – 2032 |
| Figure 11‑43: Peritoneal Catheter Procedures by Country, Latin America, 2022 – 2032 (1 of 2) |
| Figure 11‑44: Peritoneal Catheter Procedures by Country, Latin America, 2022 – 2032 (2 of 2) |
| Figure 11‑45: Peritoneal Catheter Procedures by Country, Western Europe, 2022 – 2032 |
| Figure 11‑46: Peritoneal Catheter Procedures by Country, Central & Eastern Europe, 2022 – 2032 (1 of 2) |
| Figure 11‑47: Peritoneal Catheter Procedures by Country, Central & Eastern Europe, 2022 – 2032 (2 of 2) |
| Figure 11‑48: Peritoneal Catheter Procedures by Country, Middle East, 2022 – 2032 |
| Figure 11‑49: Peritoneal Catheter Procedures by Country, Asia-Pacific, 2022 – 2032 (1 of 3) |
| Figure 11‑50: Peritoneal Catheter Procedures by Country, Asia-Pacific, 2022 – 2032 (2 of 3) |
| Figure 11‑51: Peritoneal Catheter Procedures by Country, Asia-Pacific, 2022 – 2032 (3 of 3) |
| Figure 11‑52: Peritoneal Catheter Procedures by Country, Africa, 2022 – 2032 |
| Figure 11‑53: Dialysis Catheter Market by Segment, Global, 2022 – 2032 (US$M) |
| Figure 11‑54: Dialysis Catheter Market by Region, Global, 2022 – 2032 (US$M) |
| Figure 11‑55: Dialysis Catheter Market, Global, 2022 – 2032 |
| Figure 11‑56: Units Sold by Region, Dialysis Catheter Market, Global, 2022 – 2032 |
| Figure 11‑57: Average Selling Price by Region, Dialysis Catheter Market, Global, 2022 – 2032 (US$) |
| Figure 11‑58: Market Value by Region, Dialysis Catheter Market, Global, 2022 – 2032 (US$M) |
| Figure 11‑59: Hemodialysis Catheter Market by Segment, Global, 2022 – 2032 (US$M) |
| Figure 11‑60: Total Hemodialysis Catheter Market, Global, 2022– 2032 |
| Figure 11‑61: Units Sold by Region, Hemodialysis Catheter Market, Global, 2022– 2032 |
| Figure 11‑62: Average Selling Price by Region, Hemodialysis Catheter Market, Global, 2022– 2032 (US$) |
| Figure 11‑63: Market Value by Region, Hemodialysis Catheter Market, Global, 2022– 2032 (US$M) |
| Figure 11‑64: Hemodialysis Catheter Market by Segment, Global, 2022 – 2032 (US$M) |
| Figure 11‑65: Total Long Tem Hemodialysis Catheter Market, Global, 2022– 2032 |
| Figure 11‑66: Units Sold by Region, Long Tem Hemodialysis Catheter Market, Global, 2022– 2032 |
| Figure 11‑67: Average Selling Price by Region, Long Tem Hemodialysis Catheter Market, Global, 2022– 2032 (US$) |
| Figure 11‑68: Market Value by Region, Long Tem Hemodialysis Catheter Market, Global, 2022– 2032 (US$M) |
| Figure 11‑69: Conventional Long Term Hemodialysis Market, Global, 2022 – 2032 |
| Figure 11‑70: Units Sold by Region, Conventional Long Term Hemodialysis Market, Global, 2022 – 2032 |
| Figure 11‑71: Average Selling Price by Region, Conventional Long Term Hemodialysis Market, Global, 2022 – 2032 (US$) |
| Figure 11‑72: Market Value by Region, Conventional Long Term Hemodialysis Market, Global, 2022 – 2032 (US$M) |
| Figure 11‑73: Advanced Material Long Term Hemodialysis Market, Global, 2022– 2032 |
| Figure 11‑74: Units Sold by Region, Advanced Material Long Term Hemodialysis Market, Global, 2022 – 2032 |
| Figure 11‑75: Average Selling Price by Region, Advanced Material Long Term Hemodialysis Market, Global, 2022 – 2032 (US$) |
| Figure 11‑76: Market Value by Region, Advanced Material Long Term Hemodialysis Market, Global, 2022 – 2032 (US$M) |
| Figure 11‑77: Short Term Hemodialysis Catheter Market by Segment, Global, 2022 – 2032 (US$M) |
| Figure 11‑78: Total Short Tem Hemodialysis Catheter Market, Global, 2022– 2032 |
| Figure 11‑79: Units Sold by Region, Short Tem Hemodialysis Catheter Market, Global, 2022– 2032 |
| Figure 11‑80: Average Selling Price by Region, Short Tem Hemodialysis Catheter Market, Global, 2022– 2032 (US$) |
| Figure 11‑81: Market Value by Region, Short Tem Hemodialysis Catheter Market, Global, 2022– 2032 (US$M) |
| Figure 11‑82: Power-Injectable Short Term Hemodialysis Market, Global, 2022 – 2032 |
| Figure 11‑83: Units Sold by Region, Power-Injectable Short Term Hemodialysis Market, Global, 2022 – 2032 |
| Figure 11‑84: Average Selling Price by Region, Power-Injectable Short Term Hemodialysis Market, Global, 2022 – 2032 (US$) |
| Figure 11‑85: Market Value by Region, Power-Injectable Short Term Hemodialysis Market, Global, 2022 – 2032 (US$M) |
| Figure 11‑86: Non-Power Injectable Short Term Hemodialysis Market, Global, 2022– 2032 |
| Figure 11‑87: Units Sold by Region, Non-Power Injectable Short Term Hemodialysis Market, Global, 2022 – 2032 |
| Figure 11‑88: Average Selling Price by Region, Non-Power Injectable Short Term Hemodialysis Market, Global, 2022 – 2032 (US$) |
| Figure 11‑89: Market Value by Region, Non-Power Injectable Short Term Hemodialysis Market, Global, 2022 – 2032 (US$M) |
| Figure 11‑90: Peritoneal Dialysis Catheter Market, Global, 2022 – 2032 |
| Figure 11‑91: Units Sold by Region, Peritoneal Dialysis Catheter Market, Global, 2022 – 2032 |
| Figure 11‑92: Average Selling Price by Region, Peritoneal Dialysis Catheter Market, Global, 2022 – 2032 (US$) |
| Figure 11‑93: Market Value by Region, Peritoneal Dialysis Catheter Market, Global, 2022 – 2032 (US$M) |
| Figure 11‑94: Leading Competitors, Dialysis Catheter Market, Global, 2025 |
| Figure 12‑1: Tip-Placement System Regions Covered, Global (1 of 2) |
| Figure 12‑2: Tip-Placement System Regions Covered, Global (2 of 2) |
| Figure 12‑3: Tip-Placement System Market, Global, 2022 – 2032 |
| Figure 12‑4: Units Sold by Region, Tip-Placement System Market, Global, 2022 – 2033 |
| Figure 12‑5: Average Selling Price by Region, Tip-Placement System Market, Global, 2022 – 2032 (US$) |
| Figure 12‑6: Market Value by Region, Tip-Placement System Market, Global, 2022 – 2032 (US$M) |
| Figure 12‑7: Leading Competitors, Tip-Placement System Market, Global, 2025 |
| Figure 13‑1: Catheter Securement Markets Covered |
| Figure 13‑2: Catheter Securement Regions Covered, Global (1 of 2) |
| Figure 13‑3: Catheter Securement Regions Covered, Global (2 of 2) |
| Figure 13‑4: Catheter Securement Market by Segment, Global, 2022 – 2032 (US$M) |
| Figure 13‑5: Catheter Securement Market by Region, Global, 2022 – 2032 (US$M) |
| Figure 13‑6: Tape and Dressing Market, Global, 2022– 2032 |
| Figure 13‑7: Total Tape and Dressing Market, U.S., 2022 – 2032 |
| Figure 13‑8: Units Sold by Region, Tape and Dressing Market, Global, 2022 – 2032 |
| Figure 13‑9: Average Selling Price by Region, Tape and Dressing Market, Global, 2022 – 2032 (US$) |
| Figure 13‑10: Market Value by Region, Tape and Dressing Market, Global, 2022 – 2032 (US$M) |
| Figure 13‑11: Total Antimicrobial Tape and Dressing Market, Global, 2022 – 2032 |
| Figure 13‑12: Units Sold by Region, Antimicrobial Tape and Dressing Market, Global, 2022 – 2032 |
| Figure 13‑13: Average Selling Price by Region, Antimicrobial Tape and Dressing Market, Global, 2022 – 2032 (US$) |
| Figure 13‑14: Market Value by Region, Antimicrobial Tape and Dressing Market, Global, 2022 – 2032 (US$M) |
| Figure 13‑15: Total Standard Tape and Dressing Market, Global, 2022 – 2032 |
| Figure 13‑16: Units Sold by Region, Standard Tape and Dressing Market, Global, 2022 – 2032 |
| Figure 13‑17: Average Selling Price by Region, Standard Tape and Dressing Market, Global, 2022 – 2032 (US$) |
| Figure 13‑18: Market Value by Region, Standard Tape and Dressing Market, Global, 2022 – 2032 (US$M) |
| Figure 13‑19: Total Suture Market, U.S., 2022 – 2032 |
| Figure 13‑20: Units Sold by Region, Suture Market, Global, 2022 – 2032 |
| Figure 13‑21: Average Selling Price by Region, Suture Market, Global, 2022 – 2032 (US$) |
| Figure 13‑22: Market Value by Region, Suture Market, Global, 2022 – 2032 (US$M) |
| Figure 13‑23: Manufactured Catheter Securement Device Market, Global, 2022– 2032 |
| Figure 13‑24: Total Manufactured Catheter Securement Device Market, U.S., 2022 – 2032 |
| Figure 13‑25: Units Sold by Region, Manufactured Catheter Securement Device Market, Global, 2022 – 2032 |
| Figure 13‑26: Average Selling Price by Region, Manufactured Catheter Securement Device Market, Global, 2022 – 2032 (US$) |
| Figure 13‑27: Market Value by Region, Manufactured Catheter Securement Device Market, Global, 2022 – 2032 (US$M) |
| Figure 13‑28: Mechanical Manufactured Catheter Securement Device Market, Global, 2022 – 2032 |
| Figure 13‑29: Units Sold by Region, Mechanical Manufactured Catheter Securement Device Market, Global, 2022 – 2032 |
| Figure 13‑30: Average Selling Price by Region, Mechanical Manufactured Catheter Securement Device Market, Global, 2022 – 2032 (US$) |
| Figure 13‑31: Market Value by Region, Mechanical Manufactured Catheter Securement Device Market, Global, 2022 – 2032 (US$M) |
| Figure 13‑32: Non-Mechanical Manufactured Catheter Securement Device Market, Global, 2022 – 2032 |
| Figure 13‑33: Units Sold by Region, Non-Mechanical Manufactured Catheter Securement Device Market, Global, 2022 – 2032 |
| Figure 13‑34: Average Selling Price by Region, Non-Mechanical Manufactured Catheter Securement Device Market, Global, 2022 – 2032 (US$) |
| Figure 13‑35: Market Value by Region, Non-Mechanical Manufactured Catheter Securement Device Market, Global, 2022 – 2032 (US$M) |
| Figure 13‑36: Leading Competitors, Catheter Securement Market, Global, 2025 |
| Figure 14‑1: Antibacterial Catheter Patch Regions Covered, Global (1 of 2) |
| Figure 14‑2: Antibacterial Catheter Patch Regions Covered, Global (2 of 2) |
| Figure 14‑3: Antibacterial Catheter Patch Market, Global, 2022 – 2032 |
| Figure 14‑4: Units Sold by Region, Antibacterial Catheter Patch Market, Global, 2022 – 2032 |
| Figure 14‑5: Average Selling Price by Region, Antibacterial Catheter Patch Market, Global, 2022 – 2032 (US$) |
| Figure 14‑6: Market Value by Region, Antibacterial Catheter Patch Market, Global, 2022 – 2032 (US$M) |
| Figure 14‑7: Leading Competitors, Antibacterial Catheter Patch Market, Global, 2025 |
| Figure 15‑1: Catheter Cap Regions Covered, Global (1 of 2) |
| Figure 15‑2: Catheter Cap Regions Covered, Global (2 of 2) |
| Figure 15‑3: Catheter Cap Market, Global, 2022 – 2032 |
| Figure 15‑4: Units Sold by Region, Catheter Cap Market, Global, 2022 – 2032 |
| Figure 15‑5: Average Selling Price by Region, Catheter Cap Market, Global, 2022 – 2032 (US$) |
| Figure 15‑6: Market Value by Region, Catheter Cap Market, Global, 2022 – 2032 (US$M) |
| Figure 15‑7: Leading Competitors, Catheter Cap Market, Global, 2025 |
| Figure 16‑1: Syringe and Needle Markets Covered |
| Figure 16‑2: Syringe and Needle Regions Covered, Global (1 of 2) |
| Figure 16‑3: Syringe and Needle Regions Covered, Global (2 of 2) |
| Figure 16‑4: Syringe and Needle Market by Segment, Global, 2022 – 2032 (US$M) |
| Figure 16‑5: Syringe and Needle Market by Region, Global, 2022 – 2032 (US$M) |
| Figure 16‑6: Syringe Market by Segment, Global, 2022 – 2032 (US$M) |
| Figure 16‑7: Total Syringe Market, Global, 2022 – 2032 |
| Figure 16‑8: Units Sold by Region, Syringe Market, Global, 2022 – 2032 |
| Figure 16‑9: Average Selling Price by Region, Syringe Market, Global, 2022 – 2032 (US$) |
| Figure 16‑10: Market Value by Region, Syringe Market, Global, 2022 – 2032 (US$M) |
| Figure 16‑11: Conventional Syringe Market, Global, 2022 – 2032 |
| Figure 16‑12: Units Sold by Region, Conventional Syringe Market, Global, 2022 – 2032 |
| Figure 16‑13: Average Selling Price by Region, Conventional Syringe Market, Global, 2022 – 2032 (US$) |
| Figure 16‑14: Market Value by Region, Conventional Syringe Market, Global, 2022 – 2032 (US$M) |
| Figure 16‑15: Safety Syringe Market, Global, 2022 – 2032 |
| Figure 16‑16: Units Sold by Region, Safety Syringe Market, Global, 2022 – 2032 |
| Figure 16‑17: Average Selling Price by Region, Safety Syringe Market, Global, 2022 – 2032 (US$) |
| Figure 16‑18: Market Value by Region, Safety Syringe Market, Global, 2022 – 2032 (US$M) |
| Figure 16‑19: Needle Market by Segment, Global, 2022 – 2032 (US$M) |
| Figure 16‑20: Total Needle Market, Global, 2022 – 2032 |
| Figure 16‑21: Units Sold by Region, Needle Market, Global, 2022 – 2032 |
| Figure 16‑22: Average Selling Price by Region, Needle Market, Global, 2022 – 2032 (US$) |
| Figure 16‑23: Market Value by Region, Needle Market, Global, 2022 – 2032 (US$M) |
| Figure 16‑24: Conventional Needle Market, Global, 2022 – 2032 |
| Figure 16‑25: Units Sold by Region, Conventional Needle Market, Global, 2022 – 2032 |
| Figure 16‑26: Average Selling Price by Region, Conventional Needle Market, Global, 2022 – 2032 (US$) |
| Figure 16‑27: Market Value by Region, Conventional Needle Market, Global, 2022 – 2032 (US$M) |
| Figure 16‑28: Safety Needle Market, Global, 2022 – 2032 |
| Figure 16‑29: Units Sold by Region, Safety Needle Market, Global, 2022 – 2032 |
| Figure 16‑30: Average Selling Price by Region, Safety Needle Market, Global, 2022 – 2032 (US$) |
| Figure 16‑31: Market Value by Region, Safety Needle Market, Global, 2022 – 2032 (US$M) |
| Figure 16‑32: Blunt Fill Needle Market, Global, 2022 – 2032 |
| Figure 16‑33: Units Sold by Region, Blunt Fill Needle Market, Global, 2022 – 2032 |
| Figure 16‑34: Average Selling Price by Region, Blunt Fill Needle Market, Global, 2022 – 2032 (US$) |
| Figure 16‑35: Market Value by Region, Blunt Fill Needle Market, Global, 2022 – 2032 (US$M) |
| Figure 16‑36: Leading Competitors, Syringe and Needle Market, Global, 2025 |