| List of Figures |
| Figure 1‑1: Dental Implant and Final Abutment Market Share Ranking by Segment, Latin America, 2022 |
6 |
| Figure 1‑2: Companies Researched in This Report |
7 |
| Figure 1‑3: Factors Impacting the Dental Implant and Final Abutment Market by Segment, Latin America |
8 |
| Figure 1‑4: Recent Events in the Dental Implant and Final Abutment Market, Latin America, 2019 – 2023 (1 of 2) |
9 |
| Figure 1‑5: Recent Events in the Dental Implant and Final Abutment Market, Latin America, 2019 – 2023 (2 of 2) |
10 |
| Figure 1‑6: Dental Implant and Final Abutment End User Analysis Covered |
11 |
| Figure 1‑7: Dental Implant and Final Abutment Markets Covered (1 of 2) |
12 |
| Figure 1‑8: Dental Implant and Final Abutment Markets Covered (2 of 2) |
13 |
| Figure 1‑9: Version History |
14 |
| Figure 2‑1: Dental Implant and Final Abutment Market by Segment, Worst Case Scenario, Latin America, 2019 – 2029 (US$M) |
31 |
| Figure 2‑2: Dental Implant and Final Abutment Market by Segment, Base Case Scenario, Latin America, 2019 – 2029 (US$M) |
32 |
| Figure 2‑3: Dental Implant and Final Abutment Market by Segment, Best Case Scenario, Latin America, 2019 – 2029 (US$M) |
33 |
| Figure 4‑1: Dental Implant Products by Brand (1 of 2) |
47 |
| Figure 4‑2: Dental Implant Products by Brand (2 of 2) |
48 |
| Figure 4‑3: Dental Abutment Products by Brand (1 of 2) |
50 |
| Figure 4‑4: Dental Abutment Products by Brand (2 of 2) |
51 |
| Figure 4‑5: Dental Instrument Kit Products by Brand |
52 |
| Figure 4‑6: Treatment Planning Products by Brand |
54 |
| Figure 4‑7: Surgical Guide Products by Brand |
56 |
| Figure 4‑8: Class 2 Device Recall SICAT IMPLANT V2.0 |
57 |
| Figure 4‑9: Class 2 Device Recall NobelReplace CC RP 4.3x11.5 mm |
58 |
| Figure 4‑10: Class 2 Device Recall ImplantDirect |
58 |
| Figure 4‑11: Class 2 Device Recall NobelReplace Hexagonal Implant |
58 |
| Figure 4‑12: Class 2 Device Recall NobelActive Internal Connection Implant |
59 |
| Figure 4‑13: Class 2 Device Recall NobelParallel Conical Connection |
59 |
| Figure 4‑14: Class 2 Device Recall Spectra System Dental Implants |
59 |
| Figure 4‑15: Class 2 Device Recall Legacy 3 Implant |
59 |
| Figure 4‑16: Class 2 Device Recall Swiss Plant Dental Implant System |
60 |
| Figure 4‑17: Class 2 Device Recall Simply InterActive Implant |
60 |
| Figure 4‑18: Class 2 Device Recall Legacy 3 Implant |
60 |
| Figure 4‑19: Class 2 Device Recall Spectra System Dental Implants |
60 |
| Figure 4‑20: Class 2 Device Recall Esthetic Abutment CC RP 1.5 mm |
61 |
| Figure 4‑21: Class 2 Device Recall Legacy"2 HA Implant |
61 |
| Figure 4‑22: Class 2 Device Recall Neodent |
62 |
| Figure 4‑23: Class 2 Device Recall BellaTek Encode |
63 |
| Figure 4‑24: Class 2 Device Recall Certain Bellatek Encode |
63 |
| Figure 4‑25: Class 2 Device Recall LOCATOR Overdenture Implant System |
64 |
| Figure 4‑26: Class 2 Device Recall LOCATOR Overdenture Implant System |
64 |
| Figure 4‑27: Class 2 Device Recalls CERTAIN® BELLATEK® TITANIUM ABUTMENT 3.4MM |
65 |
| Figure 4‑28: A Clinical Study of the T3 Short Dental Implant System (Magnolia) |
67 |
| Figure 4‑29: Simultaneous Dental Implant in Free Vascularized Bone Flaps for Jaw Reconstruction |
67 |
| Figure 4‑30: Immediate vs Delayed Placement of Straumann BLX Implants in Molar Extraction Sockets |
68 |
| Figure 4‑31: A Clinical Study of the Eztetic Dental Implant System (RoseQuartz) |
68 |
| Figure 4‑32: Dental Implant Treatment for Two Adjacent Teeth in the Maxillary Aesthetic Region: An Evaluation After 10 Years (2implants) |
69 |
| Figure 4‑33: Dental Implants with a SLActive® vs. SLA® Surface |
69 |
| Figure 4‑34: Evaluation of Survival and Success Rates of Zirconia Dental Implants |
70 |
| Figure 4‑35: The Marginal Bone Loss in Dental Implants (BL-Implants) |
70 |
| Figure 4‑36: Impact of Laser-Modified Abutment Topography on Peri-implant Mucosal Integration (Laser-Lok) |
70 |
| Figure 4‑37: Clinical Effects of Hard and Soft Tissue Grafting with Dental Implants |
71 |
| Figure 4‑38: Soft Tissue Volume Changes in Posterior Socket Sealing Abutment |
72 |
| Figure 4‑39: One-Time Abutment Placement Versus 4 Times Abutment Removal Around Dental Implants |
72 |
| Figure 4‑40: Oval Abutment Versus a Circular Abutment in Dental Implants in the Anterior Maxillae |
73 |
| Figure 4‑41: Evaluation of the Abutment Type Following Oral Implants in Terms of the Surrounding Bone Height |
73 |
| Figure 4‑42: Soft Peri-implant Tissue Around Different Abutment Materials |
74 |
| Figure 4‑43: DLP Versus SLM Stackable Surgical Guide |
75 |
| Figure 4‑44: Assessment of the Accuracy of Surgical Guide Designed from Digital Impression, Dental Model Scanning Using CBCT and Desktop Scanner in Computer Guided Implantology |
75 |
| Figure 5‑1: Dental Implant and Final Abutment Market by Segment, Latin America, 2019 – 2029 (US$M) |
86 |
| Figure 5‑2: Leading Competitors, Dental Implant and Final Abutment Market by Segment, Latin America, 2022 |
97 |
| Figure 5‑3: SWOT Analysis, ACE SOUTHERN |
111 |
| Figure 5‑4: SWOT Analysis, Anatomage |
112 |
| Figure 5‑5: SWOT Analysis, BioHorizons |
113 |
| Figure 5‑6: SWOT Analysis, Dentsply Sirona |
114 |
| Figure 5‑7: SWOT Analysis, Envista |
115 |
| Figure 5‑8: SWOT Analysis, Osstem Implant (Hiossen) |
116 |
| Figure 5‑9: SWOT Analysis, MegaGen |
117 |
| Figure 5‑10: SWOT Analysis, Straumann Group |
118 |
| Figure 5‑11: SWOT Analysis, ZimVie |
119 |
| Figure 6‑1: Dental Implant and Final Abutment Market Share Ranking by Segment, Brazil, 2022 |
124 |
| Figure 6‑2: Factors Impacting the Dental Implant and Final Abutment Market by Segment, Brazil |
125 |
| Figure 6‑3: Dental Implant and Final Abutment End User Analysis |
126 |
| Figure 6‑4: Dental Implant and Final Abutment Markets Covered (1 of 2) |
127 |
| Figure 6‑5: Dental Implant and Final Abutment Markets Covered (2 of 2) |
128 |
| Figure 6‑6: Dental Implants Placed by End User Specialization, Brazil, 2019 – 2029 |
135 |
| Figure 6‑7: General Practitioner Implant Placement and Restoration Penetration, Brazil, 2019 – 2029 |
136 |
| Figure 6‑8: Specialist Implant Placement and Restoration Penetration, Brazil, 2019 – 2029 |
137 |
| Figure 6‑9: Dental Implant Units Sold by Procedure Type, Brazil, 2019 – 2029 |
140 |
| Figure 6‑10: Dental Implant Units Sold by Shape, Brazil, 2019 – 2029 |
142 |
| Figure 6‑11: Dental Implant Units Sold by Connection Type, Brazil, 2019 – 2029 |
145 |
| Figure 6‑12: Dental Implant Units Sold by Application, Brazil, 2019 – 2029 |
147 |
| Figure 6‑13: Final Abutment Units Sold by Procedure Type, Brazil, 2019 – 2029 |
150 |
| Figure 6‑14: Dental Implant and Final Abutment Market by Segment, Brazil, 2019 – 2029 (US$M) |
152 |
| Figure 6‑15: Dental Implant and Final Abutment Market by Segment, Brazil, 2019 – 2029 (R$M) |
152 |
| Figure 6‑16: Total Dental Implant Market, Brazil, 2019 – 2029 |
156 |
| Figure 6‑17: Dental Implant Market by Segment, Brazil, 2019 – 2029 (US$M) |
157 |
| Figure 6‑18: Dental Implant Market by Segment, Brazil, 2019 – 2029 (R$M) |
158 |
| Figure 6‑19: Premium Dental Implant Market, Brazil, 2019 – 2029 |
160 |
| Figure 6‑20: Value Dental Implant Market, Brazil, 2019 – 2029 |
162 |
| Figure 6‑21: Discount Dental Implant Market, Brazil, 2019 – 2029 |
164 |
| Figure 6‑22: Mini Dental Implant Market, Brazil, 2019 – 2029 |
166 |
| Figure 6‑23: Dental Implant Market by Segment, Brazil, 2019 – 2029 (US$M) |
167 |
| Figure 6‑24: Dental Implant Market by Segment, Brazil, 2019 – 2029 (R$M) |
168 |
| Figure 6‑25: Titanium Implant Market, Brazil, 2019 – 2029 |
169 |
| Figure 6‑26: Ceramic/Zirconia Implant Market, Brazil, 2019 – 2029 |
170 |
| Figure 6‑27: Total Final Abutment Market, Brazil, 2019 – 2029 |
172 |
| Figure 6‑28: Final Abutment Market by Segment, Brazil, 2019 – 2029 (US$M) |
173 |
| Figure 6‑29: Final Abutment Market by Segment, Brazil, 2019 – 2029 (R$M) |
174 |
| Figure 6‑30: Stock Abutment Market, Brazil, 2019 – 2029 |
176 |
| Figure 6‑31: Custom Cast Abutment Market, Brazil, 2019 – 2029 |
177 |
| Figure 6‑32: CAD/CAM Abutment Market, Brazil, 2019 – 2029 |
179 |
| Figure 6‑33: Final Abutment Market by Material, Brazil, 2019 – 2029 (US$M) |
180 |
| Figure 6‑34: Final Abutment Market by Material, Brazil, 2019 – 2029 (R$M) |
181 |
| Figure 6‑35: Titanium Abutment Market, Brazil, 2019 – 2029 |
182 |
| Figure 6‑36: Ceramic/Zirconia Abutment Market, Brazil, 2019 – 2029 |
184 |
| Figure 6‑37: Gold Abutment Market, Brazil, 2019 – 2029 |
185 |
| Figure 6‑38: Total Dental Implant Instrument Kit Market, Brazil, 2019 – 2029 |
187 |
| Figure 6‑39: Total Treatment Planning Software Market, Brazil, 2019 – 2029 |
190 |
| Figure 6‑40: Treatment Planning Software Market Units Installed Analysis, Brazil, 2019 – 2029 |
191 |
| Figure 6‑41: Total Surgical Guide Market, Brazil, 2019 – 2029 |
193 |
| Figure 6‑42: Leading Competitors, Dental Implant and Final Abutment Market, Brazil, 2022 |
204 |
| Figure 6‑43: Leading Competitors, Dental Implant Market, Brazil, 2022 |
211 |
| Figure 6‑44: Leading Competitors, Final Abutment Market, Brazil, 2022 |
216 |
| Figure 6‑45: Leading Competitors, Dental Implant Instrument Kit Market, Brazil, 2022 |
219 |
| Figure 6‑46: Leading Competitors, Treatment Planning Software Market, Brazil, 2022 |
221 |
| Figure 6‑47: Leading Competitors, Surgical Guide Market, Brazil, 2022 |
223 |
| Figure 7‑1: Dental Implant and Final Abutment Market Share Ranking by Segment, Colombia, 2022 |
229 |
| Figure 7‑2: Factors Impacting the Dental Implant and Final Abutment Market by Segment, Colombia |
230 |
| Figure 7‑3: Dental Implant and Final Abutment End User Analysis |
231 |
| Figure 7‑4: Dental Implant and Final Abutment Markets Covered (1 of 2) |
232 |
| Figure 7‑5: Dental Implant and Final Abutment Markets Covered (2 of 2) |
233 |
| Figure 7‑6: Dental Implants Placed by End User Specialization, Colombia, 2019 – 2029 |
240 |
| Figure 7‑7: General Practitioner Implant Placement and Restoration Penetration, Colombia, 2019 – 2029 |
241 |
| Figure 7‑8: Specialist Implant Placement and Restoration Penetration, Colombia, 2019 – 2029 |
242 |
| Figure 7‑9: Dental Implant Units Sold by Procedure Type, Colombia, 2019 – 2029 |
245 |
| Figure 7‑10: Dental Implant Units Sold by Shape, Colombia, 2019 – 2029 |
247 |
| Figure 7‑11: Dental Implant Units Sold by Connection Type, Colombia, 2019 – 2029 |
250 |
| Figure 7‑12: Dental Implant Units Sold by Application, Colombia, 2019 – 2029 |
252 |
| Figure 7‑13: Final Abutment Units Sold by Procedure Type, Colombia, 2019 – 2029 |
255 |
| Figure 7‑14: Dental Implant and Final Abutment Market by Segment, Colombia, 2019 – 2029 (US$M) |
257 |
| Figure 7‑15: Dental Implant and Final Abutment Market by Segment, Colombia, 2019 – 2029 (COPM) |
258 |
| Figure 7‑16: Total Dental Implant Market, Colombia, 2019 – 2029 |
262 |
| Figure 7‑17: Dental Implant Market by Segment, Colombia, 2019 – 2029 (US$M) |
263 |
| Figure 7‑18: Dental Implant Market by Segment, Colombia, 2019 – 2029 (COPM) |
264 |
| Figure 7‑19: Premium Dental Implant Market, Colombia, 2019 – 2029 |
266 |
| Figure 7‑20: Value Dental Implant Market, Colombia, 2019 – 2029 |
268 |
| Figure 7‑21: Discount Dental Implant Market, Colombia, 2019 – 2029 |
270 |
| Figure 7‑22: Mini Dental Implant Market, Colombia, 2019 – 2029 |
272 |
| Figure 7‑23: Dental Implant Market by Segment, Colombia, 2019 – 2029 (US$M) |
273 |
| Figure 7‑24: Dental Implant Market by Segment, Colombia, 2019 – 2029 (COPM) |
274 |
| Figure 7‑25: Titanium Implant Market, Colombia, 2019 – 2029 |
275 |
| Figure 7‑26: Ceramic/Zirconia Implant Market, Colombia, 2019 – 2029 |
276 |
| Figure 7‑27: Total Final Abutment Market, Colombia, 2019 – 2029 |
278 |
| Figure 7‑28: Final Abutment Market by Segment, Colombia, 2019 – 2029 (US$M) |
279 |
| Figure 7‑29: Final Abutment Market by Segment, Colombia, 2019 – 2029 (COPM) |
280 |
| Figure 7‑30: Stock Abutment Market, Colombia, 2019 – 2029 |
281 |
| Figure 7‑31: Custom Cast Abutment Market, Colombia, 2019 – 2029 |
282 |
| Figure 7‑32: CAD/CAM Abutment Market, Colombia, 2019 – 2029 |
284 |
| Figure 7‑33: Final Abutment Market by Material, Colombia, 2019 – 2029 (US$M) |
285 |
| Figure 7‑34: Final Abutment Market by Material, Colombia, 2019 – 2029 (COPM) |
286 |
| Figure 7‑35: Titanium Abutment Market, Colombia, 2019 – 2029 |
287 |
| Figure 7‑36: Ceramic/Zirconia Abutment Market, Colombia, 2019 – 2029 |
289 |
| Figure 7‑37: Gold Abutment Market, Colombia, 2019 – 2029 |
291 |
| Figure 7‑38: Total Dental Implant Instrument Kit Market, Colombia, 2019 – 2029 |
293 |
| Figure 7‑39: Total Treatment Planning Software Market, Colombia, 2019 – 2029 (1 of 2) |
296 |
| Figure 7‑40: Total Treatment Planning Software Market, Colombia, 2019 – 2029 (2 of 2) |
296 |
| Figure 7‑41: Total Treatment Planning Software Market, Colombia, 2019 – 2029 |
297 |
| Figure 7‑42: Total Surgical Guide Market, Colombia, 2019 – 2029 |
299 |
| Figure 7‑43: Leading Competitors, Dental Implant and Final Abutment Market, Colombia, 2022 |
308 |
| Figure 7‑44: Leading Competitors, Dental Implant Market, Colombia, 2022 |
313 |
| Figure 7‑45: Leading Competitors, Final Abutment Market, Colombia, 2022 |
317 |
| Figure 7‑46: Leading Competitors, Dental Implant Instrument Kit Market, Colombia, 2022 |
320 |
| Figure 7‑47: Leading Competitors, Treatment Planning Software Market, Colombia, 2022 |
322 |
| Figure 7‑48: Leading Competitors, Surgical Guide Market, Colombia, 2022 |
324 |
| Figure 8‑1: Dental Implant and Final Abutment Market Share Ranking by Segment, Mexico, 2022 |
329 |
| Figure 8‑2: Factors Impacting the Dental Implant and Final Abutment Market by Segment, Mexico |
330 |
| Figure 8‑3: Dental Implant and Final Abutment End User Analysis |
331 |
| Figure 8‑4: Dental Implant and Final Abutment Markets Covered (1 of 2) |
332 |
| Figure 8‑5: Dental Implant and Final Abutment Markets Covered (2 of 2) |
333 |
| Figure 8‑6: Dental Implants Placed by End User Specialization, Mexico, 2019 – 2029 |
340 |
| Figure 8‑7: General Practitioner Implant Placement and Restoration Penetration, Mexico, 2019 – 2029 |
341 |
| Figure 8‑8: Specialist Implant Placement and Restoration Penetration, Mexico, 2019 – 2029 |
342 |
| Figure 8‑9: Dental Implant Units Sold by Procedure Type, Mexico, 2019 – 2029 |
345 |
| Figure 8‑10: Dental Implant Units Sold by Shape, Mexico, 2019 – 2029 |
347 |
| Figure 8‑11: Dental Implant Units Sold by Connection Type, Mexico, 2019 – 2029 |
350 |
| Figure 8‑12: Dental Implant Units Sold by Application, Mexico, 2019 – 2029 |
352 |
| Figure 8‑13: Final Abutment Units Sold by Procedure Type, Mexico, 2019 – 2029 |
355 |
| Figure 8‑14: Dental Implant and Final Abutment Market by Segment, Mexico, 2019 – 2029 (US$M) |
357 |
| Figure 8‑15: Dental Implant and Final Abutment Market by Segment, Mexico, 2019 – 2029 (MXNM) |
358 |
| Figure 8‑16: Total Dental Implant Market, Mexico, 2019 – 2029 |
363 |
| Figure 8‑17: Dental Implant Market by Segment, Mexico, 2019 – 2029 (US$M) |
366 |
| Figure 8‑18: Dental Implant Market by Segment, Mexico, 2019 – 2029 (MXNM) |
367 |
| Figure 8‑19: Premium Dental Implant Market, Mexico, 2019 – 2029 |
369 |
| Figure 8‑20: Value Dental Implant Market, Mexico, 2019 – 2029 |
371 |
| Figure 8‑21: Discount Dental Implant Market, Mexico, 2019 – 2029 |
373 |
| Figure 8‑22: Mini Dental Implant Market, Mexico, 2019 – 2029 |
375 |
| Figure 8‑23: Dental Implant Market by Segment, Mexico, 2019 – 2029 (US$M) |
376 |
| Figure 8‑24: Dental Implant Market by Segment, Mexico, 2019 – 2029 (MXNM) |
377 |
| Figure 8‑25: Titanium Implant Market, Mexico, 2019 – 2029 |
379 |
| Figure 8‑26: Ceramic/Zirconia Implant Market, Mexico, 2019 – 2029 |
381 |
| Figure 8‑27: Total Final Abutment Market, Mexico, 2019 – 2029 |
383 |
| Figure 8‑28: Final Abutment Market by Segment, Mexico, 2019 – 2029 (US$M) |
384 |
| Figure 8‑29: Final Abutment Market by Segment, Mexico, 2019 – 2029 (MXNM) |
385 |
| Figure 8‑30: Stock Abutment Market, Mexico, 2019 – 2029 |
387 |
| Figure 8‑31: Custom Cast Abutment Market, Mexico, 2019 – 2029 |
389 |
| Figure 8‑32: CAD/CAM Abutment Market, Mexico, 2019 – 2029 |
391 |
| Figure 8‑33: Final Abutment Market by Material, Mexico, 2019 – 2029 (US$M) |
392 |
| Figure 8‑34: Final Abutment Market by Material, Mexico, 2019 – 2029 (MXNM) |
393 |
| Figure 8‑35: Titanium Abutment Market, Mexico, 2019 – 2029 |
395 |
| Figure 8‑36: Ceramic/Zirconia Abutment Market, Mexico, 2019 – 2029 |
397 |
| Figure 8‑37: Gold Abutment Market, Mexico, 2019 – 2029 |
399 |
| Figure 8‑38: Total Dental Implant Instrument Kit Market, Mexico, 2019 – 2029 |
401 |
| Figure 8‑39: Total Treatment Planning Software Market, Mexico, 2019 – 2029 (1 of 2) |
404 |
| Figure 8‑40: Total Treatment Planning Software Market, Mexico, 2019 – 2029 (2 of 2) |
404 |
| Figure 8‑41: Total Treatment Planning Software Market, Mexico, 2019 – 2029 |
405 |
| Figure 8‑42: Total Surgical Guide Market, Mexico, 2019 – 2029 |
407 |
| Figure 8‑43: Leading Competitors, Dental Implant and Final Abutment Market, Mexico, 2022 |
416 |
| Figure 8‑44: Leading Competitors, Dental Implant Market, Mexico, 2022 |
422 |
| Figure 8‑45: Leading Competitors, Final Abutment Market, Mexico, 2022 |
426 |
| Figure 8‑46: Leading Competitors, Dental Implant Instrument Kit Market, Mexico, 2022 |
429 |
| Figure 8‑47: Leading Competitors, Treatment Planning Software Market, Mexico, 2022 |
431 |
| Figure 8‑48: Leading Competitors, Surgical Guide Market, Mexico, 2022 |
433 |

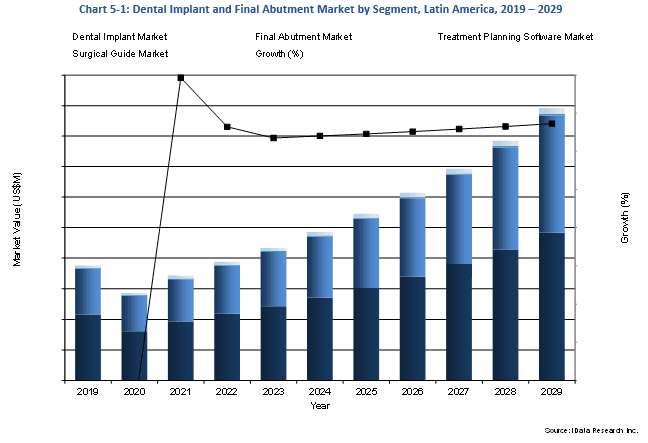 Market growth in Latin America will be driven by an array of factors, including, but not limited to, the increasing acceptance of advanced technologies and improved training courses in implantology. As more general practitioners receive training in implantology techniques such as the utilization of treatment planning software for implant placement and computer-guided surgery, the need to specialize will become diminished. Companies have invested in training programs to familiarize dentists with their products, thereby building brand awareness and loyalty to the company. Established market players can afford to invest much more money this way, giving them a crucial advantage. The more the dentists look toward implantology as a feasible option for their patient, the more the dental implant market will expand.


