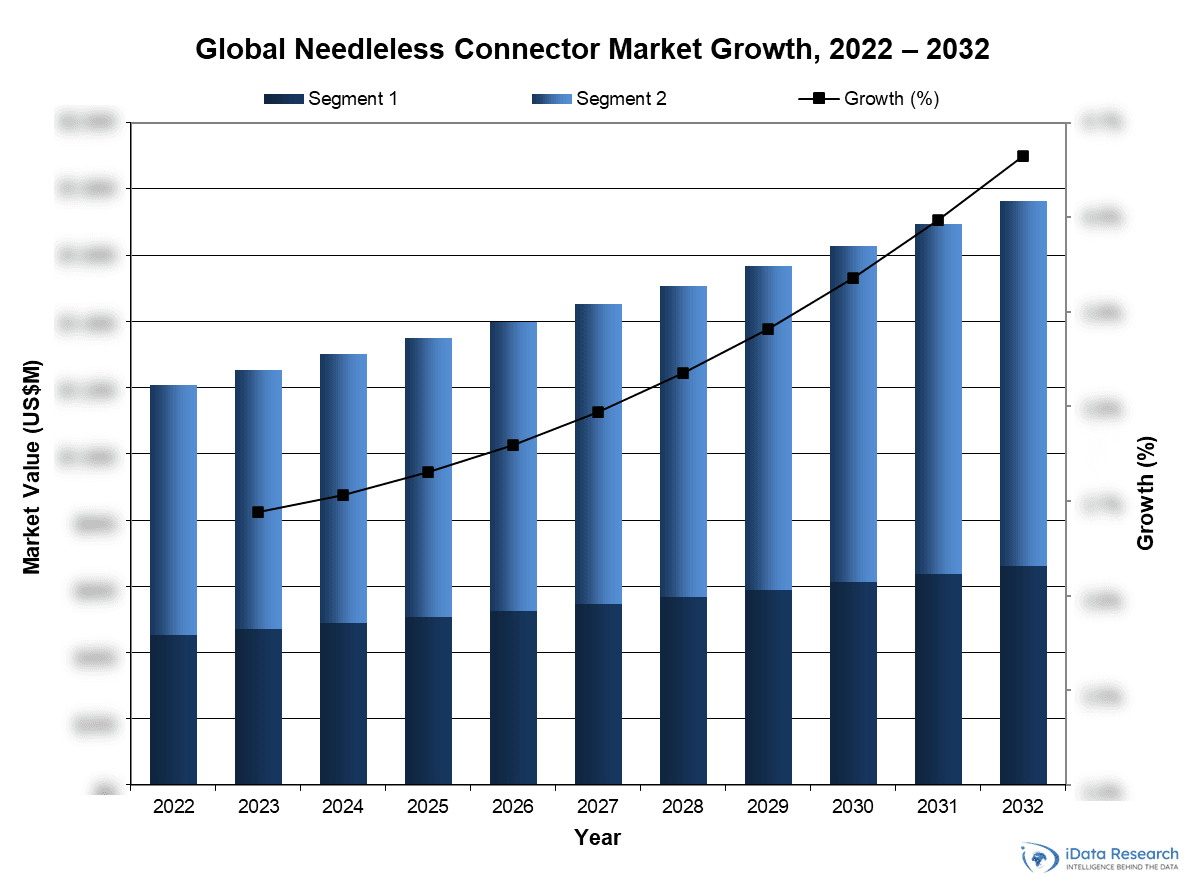
Infusion Therapy Market Size, Share & COVID19 Impact Analysis | Europe | 2020-2026 | MedSuite | Includes: Infusion Pumps, Intravenous Sets, Needless Connectors, Stopcocks & Blood Transfusion Sets
- Year: 2020
- Scope: 2016-2026
- Region: Europe
- Pages: 558
- Published Date: 10/16/2020
- Type: MedSuite
In 2020, the European infusion therapy device market size was valued at almost €927 billion, with over 137 million intravenous pump sets sold every year. In spite of COVID19, the market size is expected to increase at a compound annual growth rate (CAGR) of 1.3% to reach €1.1 billion in 2026.
Throughout this medical market research, we analyzed 46 infusion therapy companies across Europe and used our comprehensive methodology to understand the market sizes, unit sales, company market shares, and to create accurate forecasts.
While this MedSuite report contains all the EU Infusion Therapy market analysis and data, each of the market segments is also available as stand-alone MedCore reports. This allows you to get access to only the market research that you need.
Data Types Included
- Unit Sales, Average Selling Prices, Market Value & Growth Trends
- Market Forecasts Until 2026, and Historical Data to 2016
- Market Drivers & Limiters for Each Infusion Therapy market
- Competitive Analysis with Market Shares for Each Segment
- Recent Mergers & Acquisitions
- COVID19 Impact On the European Infusion Therapy Market
- Disease Overviews and Demographic Information
- Company Profiles, Product Portfolios and SWOT for Top Competitors
Infusion Therapy Market Insights
The expansion of alternate care is expected to somewhat offset the negative impact caused by COVID-19 over the forecast period. Many healthcare markets are already trending towards alternate care since it relieves some of the strain that is placed on hospitals. During a global health pandemic, this becomes especially important. Furthermore, alternate care settings tend to pay higher prices per device compared to acute care, which drives up the total market ASP.
Currently, the standard of care for infusions in Europe is gravity drip infusion, administered through a gravity set. However, sales of pump sets have been growing faster and are growing in terms of share of total infusions performed. Over the course of the forecast period, this trend is expected to continue and it is possible that over a long enough period of time, pump infusions may become the standard of care in many European countries.
COVID19 Impact on the Infusion Therapy Market in Europe
COVID-19 is expected to play a significant role in this market throughout the forecast period. Due to a lower number of elective procedures, as well as restrictions limiting sales representatives and technicians from entering hospitals, many facilities have been delaying the purchase of new medical devices such as infusion pumps. This is expected to have a negative impact on the infusion pump market in 2020 and 2021. Since infusion pump sales make up a sizable portion of the total market value, the infusion therapy device market is expected to take a downturn in these years as well.
Infusion Therapy Market Share Insight
B. Braun was the leading competitor in the total European infusion therapy device market by 2020. B. Braun’s largest revenues were in the IV set and infusion pump markets, but the company also led the market for stopcocks.
Becton Dickinson was the second-leading competitor in the European market. The company was involved in most of the infusion therapy markets covered in this research and was strongest in the large volume infusion pump segment in 2019.
The third leading competitor in the European infusion therapy market was Fresenius Kabi. The company has been experiencing strong growth due to its lower manufacturing costs, which has translated into lower prices for hospitals and GPOs.
RESEARCH REGIONAL COVERAGE
Throughout this research series, iData Research has covered several countries in great detail. Each country may be purchased as a stand-alone report, tailoring the data to your needs. The countries covered are:
- Germany
- France
- U.K.
- Italy
- Spain
- Benelux (Belgium, Netherlands, and Luxembourg)
- Scandinavia (Norway, Finland, Sweden, and Denmark)
- Switzerland
- Austria
- Portugal
SEGMENTS COVERED
Feel free to click on each title to view detailed market segmentation. Please note that the analysis of each of the Infusion Therapy market segments can be purchased as separate reports, MedCores.
- Infusion Pump Market – MedCore – The market analysis is further broken down by:
- Product Type: Large Volume Pumps, Syringe Pumps, Patient-Controlled Analgesia Pumps, Electronic Ambulatory Pumps, and Disposable Ambulatory Pumps;
- Care Setting: Acute and Alternate Care Settings.
- Intravenous Set Market – MedCore – The market is comprised of the segments broken down by:
- Product Type: Pump Sets, Gravity Sets, Secondary Sets, and Extension Sets;
- Care Setting: Acute and Alternate Care Settings
- Needleless Connector Market – MedCore – The market is further segmented by:
- Displacement Type: Negative, Positive, and Neutral Displacement;
- Delivery Type: Standalone and Integrated;
- Care Setting: Acute and Alternate Care Settings.
- Stopcock Market – MedCore – The in-depth analysis of the Stopcock Market.
- Blood Transfusion Set Market – MedCore – The chapter provides an overview of the Blood Transfusion Set market.
Detailed Market Segmentation
DON’T SEE THE SEGMENT OR DATA YOU NEED?
Feel free to contact us or send a request by pressing one of the buttons below.
TABLE OF CONTENTS I
LIST OF FIGURES X
LIST OF CHARTS XXIX
EXECUTIVE SUMMARY 1
EUROPEAN INFUSION THERAPY DEVICE MARKET OVERVIEW 1
COMPETITIVE ANALYSIS 4
MARKET TRENDS 6
MARKET DEVELOPMENTS 7
MARKETS INCLUDED 8
KEY REPORT UPDATES 10
VERSION HISTORY 11
RESEARCH METHODOLOGY 12
Step 1: Project Initiation & Team Selection 12
Step 2: Prepare Data Systems and Perform Secondary Research 15
Step 3: Preparation for Interviews & Questionnaire Design 17
Step 4: Performing Primary Research 18
Step 5: Research Analysis: Establishing Baseline Estimates 20
Step 6: Market Forecast and Analysis 21
Step 7: Identify Strategic Opportunities 23
Step 8: Final Review and Market Release 24
Step 9: Customer Feedback and Market Monitoring 25
IMPACT OF COVID-19 ON THE EUROPEAN INFUSION THERAPY DEVICE MARKET 26
2.1 INTRODUCTION 26
2.2 MULTI-SCENARIO ANALYSIS 28
2.2.1.1 Best Case Scenario 28
2.2.1.2 Base Case Scenario 30
2.2.1.3 Worst Case Scenario 32
DISEASE OVERVIEW 35
3.1.1 Congestive Heart Failure 35
3.1.2 Crohn’s Disease 36
3.1.3 Hemophilia 37
3.1.4 Immune Deficiencies 38
3.1.5 Multiple Sclerosis 38
3.1.6 Cancer 39
PRODUCT ASSESSMENT 42
4.1 INTRODUCTION 42
4.2 PRODUCT PORTFOLIOS 42
4.2.1 Large Volume Infusion Pump 42
4.2.2 Syringe Pumps 44
4.2.3 Patient-Controlled Analgesia Pumps 46
4.2.4 Electronic Ambulatory Pumps 48
4.2.5 Disposable Ambulatory Infusion Pump 50
4.2.6 Intravenous Sets 51
4.2.6.1 Pump Sets 51
4.2.6.2 Gravity Sets 51
4.2.6.3 Secondary Sets 52
4.2.6.4 Extension Sets 52
4.2.7 Needleless Connectors 54
4.2.7.1 Split Septum and Blunt Cannula 54
4.2.7.2 Mechanical Valves 54
4.2.7.3 Negative Displacement Mechanical Valves 55
4.2.7.4 Positive Displacement Mechanical Valves 55
4.2.7.5 Neutral Displacement Mechanical Valves 55
4.2.7.6 Anti-Reflux Neutral Displacement Mechanical Valves 55
4.2.7.7 Antimicrobial Needleless Connectors 56
4.2.8 Stopcocks 57
4.2.9 Intravenous Filters 58
4.2.10 Blood Transfusion Devices 59
4.2.10.1 Blood Transfusion Sets 59
4.2.10.2 Blood Warmers 60
4.3 FDA RECALLS 62
4.3.1 Argon Medical Devices 62
4.3.1.1 Stopcocks 62
4.3.2 Baxter 63
4.3.2.1 Infusion Pump 63
4.3.2.2 Intravenous Sets 65
4.3.2.3 Needleless Connectors 66
4.3.2.4 Blood Transfusion Devices 66
4.3.3 Becton Dickinson 67
4.3.3.1 Intravenous Sets 67
4.3.3.2 Infusion Pumps 68
4.3.4 Fresenius 68
4.3.4.1 Infusion Pumps 68
4.3.5 ICU Medical 69
4.3.5.1 Infusion Pumps 69
4.3.5.2 Intravenous Sets 69
4.3.6 Medtronic 71
4.3.6.1 Intravenous Sets 71
4.3.7 MOOG Corporation 72
4.3.7.1 Intravenous Sets 72
4.3.8 Smiths Medical 73
4.3.8.1 Infusion Pump 73
4.3.8.2 Intravenous Sets 75
4.3.8.3 Stopcocks 75
4.3.9 Vygon USA 76
4.3.9.1 Intravenous Sets 76
4.3.9.2 Stopcocks 76
4.3.10 Zyno Medical Products 77
4.3.10.1 Intravenous Sets 77
4.4 CLINICAL TRIALS 78
4.4.1 Careggi Hospital 79
4.4.2 Jeffrey N. Bruce 79
4.4.3 Johaan Wolfgang Goethe University Hospital 80
4.4.4 Mahidol University 80
4.4.5 Medallion Therapeutics, Inc. 81
4.4.6 Memorial Sloan Kettering Cancer Center 82
4.4.7 Michael J Cavnar, MD 83
4.4.8 National Cancer Institute 84
4.4.9 Octapharma 85
4.4.10 Xiangya Hospital of Central South University 86
4.4.11 Yonsei University 86
EUROPEAN INFUSION THERAPY DEVICE MARKET OVERVIEW 88
5.1 INTRODUCTION 88
5.2 CURRENCY EXCHANGE RATE 89
5.3 MARKET OVERVIEW 90
5.4 TREND ANALYSIS BY SEGMENT 96
5.5 DRIVERS AND LIMITERS 99
5.5.1 Market Drivers 99
5.5.2 Market Limiters 100
5.6 COMPETITIVE MARKET SHARE ANALYSIS 103
5.7 MERGERS AND ACQUISITIONS 110
5.8 COMPANY PROFILES 112
5.8.1 Avanos Medical 112
5.8.2 Baxter 113
5.8.3 B. Braun 114
5.8.4 Becton Dickinson 115
5.8.5 ICU Medical 117
5.8.6 Smiths Medical 118
5.9 SWOT ANALYSIS 119
5.9.1 Avanos Medical 120
5.9.2 Baxter 121
5.9.3 B. Braun 122
5.9.4 Becton Dickinson 123
5.9.5 ICU Medical 124
5.9.6 Smiths Medical 125
COUNTRY PROFILES 126
6.1 INTRODUCTION 126
6.1.1 Population 126
6.1.2 GDP Per Capita 126
6.1.3 Price Index 126
6.2 GERMANY 127
6.3 FRANCE 128
6.4 UNITED KINGDOM 129
6.5 ITALY 130
6.6 SPAIN 131
6.7 BENELUX 132
6.8 SCANDINAVIA 133
6.9 AUSTRIA 134
6.10 SWITZERLAND 135
6.11 PORTUGAL 136
INFUSION PUMP MARKET 137
7.1 INTRODUCTION 137
7.1.1 Large Volume Infusion Pumps 138
7.1.2 Syringe Infusion Pumps 139
7.1.3 Patient-Controlled Analgesia Infusion Pumps 139
7.1.4 Electronic Ambulatory Infusion Pumps 139
7.1.5 Disposable Ambulatory Infusion Pumps 140
7.2 MARKET OVERVIEW 141
7.3 MARKET ANALYSIS AND FORECAST 147
7.3.1 Total Large Volume Infusion Pump Market 147
7.3.1.1 Large Volume Infusion Pump Market by Care Setting 155
7.3.1.1.1 Acute Care Large Volume Infusion Pump Market 158
7.3.1.1.2 Alternate Care Large Volume Infusion Pump Market 165
7.3.2 Total Syringe Infusion Pump Market 172
7.3.2.1 Syringe Infusion Pump Market by Care Setting 180
7.3.2.1.1 Acute Care Syringe Infusion Pump Market 183
7.3.2.1.2 Alternate Care Syringe Infusion Pump Market 190
7.3.3 Total Patient-Controlled Analgesia Infusion Pump Market 197
7.3.4 Total Electronic Ambulatory Infusion Pump Market 204
7.3.4.1 Electronic Ambulatory Infusion Pump Market by Care Setting 212
7.3.4.1.1 Acute Care Electronic Ambulatory Infusion Pump Market 215
7.3.4.1.2 Alternate Care Electronic Ambulatory Infusion Pump Market 222
7.3.5 Total Disposable Ambulatory Infusion Pump Market 229
7.3.5.1 Disposable Ambulatory Infusion Pump Market by Type 236
7.3.5.2 Non-Pain Disposable Ambulatory Infusion Pump Market 240
7.3.5.3 Pain Disposable Ambulatory Infusion Pump Market 247
7.4 UNIT ANALYSIS 254
7.4.1 Large Volume Infusion Pump Units by Purchase Type 254
7.4.1.1 Purchased Large Volume Infusion Pump Units 256
7.4.1.2 Placement Plan Large Volume Infusion Pump Units 257
7.4.2 Syringe Infusion Pump Units by Purchase Type 258
7.4.2.1 Purchased Syringe Infusion Pump Units 261
7.4.2.2 Placement Plan Syringe Infusion Pump Units 262
7.4.3 Disposable Ambulatory Infusion Pump Units by Care Setting 263
7.4.3.1 Acute Care Disposable Ambulatory Infusion Pump Units 266
7.4.3.2 Alternate Care Disposable Ambulatory Infusion Pump Units 267
7.5 DRIVERS AND LIMITERS 268
7.5.1 Market Drivers 268
7.5.2 Market Limiters 269
7.6 COMPETITIVE MARKET SHARE ANALYSIS 271
INTRAVENOUS SET MARKET 282
8.1 INTRODUCTION 282
8.2 MARKET OVERVIEW 283
8.3 MARKET ANALYSIS AND FORECAST 288
8.3.1 Total Pump Intravenous Set Market 288
8.3.1.1 Pump Intravenous Set Market by Care Setting 296
8.3.1.1.1 Acute Care Pump Intravenous Set Market 299
8.3.1.1.2 Alternate Care Pump Intravenous Set Market 306
8.3.1.2 Pump Intravenous Set Market by Device Type 313
8.3.1.2.1 Dedicated Pump Intravenous Set Market by Pump Type 316
8.3.1.2.2 Non-Dedicated Pump Intravenous Set Market 340
8.3.2 Total Gravity Intravenous Set Market 347
8.3.2.1 Gravity Intravenous Set Market by Care Setting 355
8.3.2.1.1 Acute Care Gravity Intravenous Set Market 358
8.3.2.1.2 Alternate Care Gravity Intravenous Set Market 365
8.3.2.2 Gravity Intravenous Set Market by Device Type 372
8.3.2.2.1 Gravity Set with Airstop Market 375
8.3.2.2.2 Gravity Set without Airstop Market 382
8.3.3 Total Secondary Intravenous Set Market 389
8.3.3.1 Secondary Intravenous Set Market by Care Setting 397
8.3.3.1.1 Acute Care Secondary Intravenous Set Market 400
8.3.3.1.2 Alternate Care Secondary Intravenous Set Market 407
8.3.4 Total Extension Intravenous Set Market 414
8.3.4.1 Extension Intravenous Set Market by Care Setting 421
8.3.4.1.1 Acute Care Extension Intravenous Set Market 424
8.3.4.1.2 Alternate Care Extension Intravenous Set Market 431
8.4 DRIVERS AND LIMITERS 438
8.4.1 Market Drivers 438
8.4.2 Market Limiters 439
8.5 COMPETITIVE MARKET SHARE ANALYSIS 441
NEEDLELESS CONNECTOR MARKET 447
9.1 INTRODUCTION 447
9.2 MARKET OVERVIEW 449
9.2.1 Market Overview by Displacement Type 449
9.2.2 Market Overview by Device Type 455
9.2.3 Market Overview by Care Setting 460
9.3 MARKET ANALYSIS AND FORECAST 465
9.3.1 Total Needleless Connector Market 465
9.3.2 Needleless Connector Market by Displacement Type 473
9.3.2.1 Negative Displacement Needleless Connector Market 473
9.3.2.2 Positive Displacement Needleless Connector Market 480
9.3.2.3 Neutral Displacement Needleless Connector Market 487
9.3.3 Needleless Connector Market by Device Type 494
9.3.3.1 Standalone Needleless Connector Market 494
9.3.3.2 Integrated Needleless Connector Market 501
9.3.4 Needleless Connector Market by Care Setting 508
9.3.4.1 Acute Care Needleless Connector Market 508
9.3.4.2 Alternate Care Needleless Connector Market 515
9.4 DRIVERS AND LIMITERS 522
9.4.1 Market Drivers 522
9.4.2 Market Limiters 523
9.5 COMPETITIVE MARKET SHARE ANALYSIS 525
STOPCOCK MARKET 529
10.1 INTRODUCTION 529
10.2 MARKET ANALYSIS AND FORECAST 531
10.3 DRIVERS AND LIMITERS 539
10.3.1 Market Drivers 539
10.3.2 Market Limiters 539
10.4 COMPETITIVE MARKET SHARE ANALYSIS 541
APPENDIX: BLOOD TRANSFUSION SETS 546
11.1 INTRODUCTION 546
11.2 MARKET ANALYSIS AND FORECAST 547
11.3 DRIVERS AND LIMITERS 555
11.3.1 Market Drivers 555
11.3.2 Market Limiters 555
ABBREVIATIONS 557
|
|
LIST OF CHARTS
Chart 1 1: Infusion Therapy Device Market by Segment, Europe, 2016 – 2026 3
Chart 1 2: Infusion Therapy Device Market Overview, Europe, 2019 & 2026 3
Chart 2 1: Multi-Scenario Infusion Therapy Device Market, Europe, 2016 – 2026 34
Chart 5 1: Infusion Therapy Device Market by Segment, Europe, 2016 – 2026 93
Chart 5 2: Infusion Therapy Device Market Breakdown, Europe, 2019 94
Chart 5 3: Infusion Therapy Device Market Breakdown, Europe, 2026 95
Chart 5 4: Growth Rates by Segment, Infusion Therapy Device Market, Europe, 2017 – 2026 98
Chart 5 5: Leading Competitors, Infusion Therapy Device Market, Europe, 2019 109
Chart 6 1: Country Profile, Germany, 2019 127
Chart 6 2: Country Profile, France, 2019 128
Chart 6 3: Country Profile, United Kingdom, 2019 129
Chart 6 4: Country Profile, Italy, 2019 130
Chart 6 5: Country Profile, Spain, 2019 131
Chart 6 6: Country Profile, Benelux, 2019 132
Chart 6 7: Country Profile, Scandinavia, 2019 133
Chart 6 8: Country Profile, Austria, 2019 134
Chart 6 9: Country Profile, Switzerland, 2019 135
Chart 6 10: Country Profile, Portugal, 2019 136
Chart 7 1: Infusion Pump Market by Type, Europe, 2016 – 2026 144
Chart 7 2: Infusion Pump Market Breakdown, Europe, 2019 145
Chart 7 3: Infusion Pump Market Breakdown, Europe, 2026 146
Chart 7 4: Large Volume Infusion Pump Market, Europe, 2016 – 2026 149
Chart 7 5: Large Volume Infusion Pump Market by Segment, Europe, 2016 – 2026 157
Chart 7 6: Acute Care Large Volume Infusion Pump Market, Europe, 2016 – 2026 159
Chart 7 7: Alternate Care Large Volume Infusion Pump Market, Europe, 2016 – 2026 166
Chart 7 8: Syringe Infusion Pump Market, Europe, 2016 – 2026 174
Chart 7 9: Syringe Infusion Pump Market by Segment, Europe, 2016 – 2026 182
Chart 7 10: Acute Care Syringe Infusion Pump Market, Europe, 2016 – 2026 184
Chart 7 11: Alternate Care Syringe Infusion Pump Market, Europe, 2016 – 2026 191
Chart 7 12: Patient-Controlled Analgesia Infusion Pump Market, Europe, 2016 – 2026 198
Chart 7 13: Electronic Ambulatory Infusion Pump Market, Europe, 2016 – 2026 206
Chart 7 14: Electronic Ambulatory Infusion Pump Market by Segment, Europe, 2016 – 2026 214
Chart 7 15: Acute Care Electronic Ambulatory Infusion Pump Market, Europe, 2016 – 2026 216
Chart 7 16: Alternate Care Electronic Ambulatory Infusion Pump Market, Europe, 2016 – 2026 223
Chart 7 17: Total Disposable Ambulatory Infusion Pump Market, Europe, 2016 – 2026 230
Chart 7 18: Disposable Ambulatory Infusion Pump Market by Segment, Europe, 2016 – 2026 239
Chart 7 19: Non-Pain Disposable Ambulatory Infusion Pump Market, Europe, 2016 – 2026 241
Chart 7 20: Pain Disposable Ambulatory Infusion Pump Market, Europe, 2016 – 2026 248
Chart 7 21: Large Volume Infusion Pump Units Sold by Purchase Type, Europe, 2016 – 2026 255
Chart 7 22: Syringe Infusion Pump Units Sold by Purchase Type, Europe, 2016 – 2026 260
Chart 7 23: Disposable Ambulatory Infusion Pump Units Sold by Care Setting, Europe, 2016 – 2026 265
Chart 7 24: Leading Competitors, Infusion Pump Market, Europe, 2019 277
Chart 8 1: Intravenous Set Market by Type, Europe, 2016 – 2026 285
Chart 8 2: Intravenous Set Market Breakdown, Europe, 2019 286
Chart 8 3: Intravenous Set Market Breakdown, Europe, 2026 287
Chart 8 4: Total Pump Intravenous Set Market, Europe, 2016 – 2026 290
Chart 8 5: Pump Intravenous Set Market by Care Setting, Europe, 2016 – 2026 298
Chart 8 6: Acute Care Pump Intravenous Set Market, Europe, 2016 – 2026 300
Chart 8 7: Alternate Care Pump Intravenous Set Market, Europe, 2016 – 2026 307
Chart 8 8: Pump Intravenous Set Market by Type, Europe, 2016 – 2026 315
Chart 8 9: Dedicated Pump Intravenous Set Market by Pump Type, Europe, 2016 – 2026 318
Chart 8 10: Dedicated Pump Intravenous Set Market, Europe, 2016 – 2026 320
Chart 8 11: Large Volume Dedicated Pump Intravenous Set Market, Europe, 2016 – 2026 327
Chart 8 12: Other Dedicated Pump Intravenous Set Market, Europe, 2016 – 2026 334
Chart 8 13: Non-Dedicated Pump Intravenous Set Market, Europe, 2016 – 2026 341
Chart 8 14: Total Gravity Intravenous Set Market, Europe, 2016 – 2026 349
Chart 8 15: Gravity Intravenous Set Market by Care Setting, Europe, 2016 – 2026 357
Chart 8 16: Acute Care Gravity Intravenous Set Market, Europe, 2016 – 2026 359
Chart 8 17: Alternate Care Gravity Intravenous Set Market, Europe, 2016 – 2026 366
Chart 8 18: Gravity Intravenous Set Market by Type, Europe, 2016 – 2026 374
Chart 8 19: Gravity Set with Airstop Market, Europe, 2016 – 2026 376
Chart 8 20: Gravity Set without Airstop Market, Europe, 2016 – 2026 383
Chart 8 21: Total Secondary Intravenous Set Market, Europe, 2016 – 2026 391
Chart 8 22: Secondary Intravenous Set Market by Care Setting, Europe, 2016 – 2026 399
Chart 8 23: Acute Care Secondary Intravenous Set Market, Europe, 2016 – 2026 401
Chart 8 24: Alternate Care Secondary Intravenous Set Market, Europe, 2016 – 2026 408
Chart 8 25: Total Extension Intravenous Set Market, Europe, 2016 – 2026 415
Chart 8 26: Extension Intravenous Set Market by Care Setting, Europe, 2016 – 2026 423
Chart 8 27: Acute Care Extension Intravenous Set Market, Europe, 2016 – 2026 425
Chart 8 28: Alternate Care Extension Intravenous Set Market, Europe, 2016 – 2026 432
Chart 8 29: Leading Competitors, Intravenous Set Market, Europe, 2019 445
Chart 9 1: Needleless Connector Market by Displacement Type, Europe, 2016 – 2026 452
Chart 9 2: Needleless Connector Market Breakdown by Displacement Type, Europe, 2019 453
Chart 9 3: Needleless Connector Market Breakdown by Displacement Type, Europe, 2026 454
Chart 9 4: Needleless Connector Market by Type, Europe, 2016 – 2026 457
Chart 9 5: Needleless Connector Market Breakdown by Type, Europe, 2019 458
Chart 9 6: Needleless Connector Market Breakdown by Type, Europe, 2026 459
Chart 9 7: Needleless Connector Market by Care Setting, Europe, 2016 – 2026 462
Chart 9 8: Needleless Connector Market Breakdown by Care Setting, Europe, 2019 463
Chart 9 9: Needleless Connector Market Breakdown by Care Setting, Europe, 2026 464
Chart 9 10: Needleless Connector Market, Europe, 2016 – 2026 467
Chart 9 11: Negative Displacement Needleless Connector Market, Europe, 2016 – 2026 474
Chart 9 12: Positive Displacement Needleless Connector Market, Europe, 2016 – 2026 481
Chart 9 13: Neutral Displacement Needleless Connector Market, Europe, 2016 – 2026 488
Chart 9 14: Standalone Needleless Connector Market, Europe, 2016 – 2026 495
Chart 9 15: Integrated Needleless Connector Market, Europe, 2016 – 2026 502
Chart 9 16: Acute Care Needleless Connector Market, Europe, 2016 – 2026 509
Chart 9 17: Alternate Care Needleless Connector Market, Europe, 2016 – 2026 516
Chart 9 18: Leading Competitors, Needleless Connector Market, Europe, 2019 528
Chart 10 1: Stopcock Market, Europe, 2016 – 2026 533
Chart 10 2: Leading Competitors, Stopcock Market, Europe, 2019 545
Chart 11 1: Blood Transfusion Market, Europe, 2016 – 2026 549
LIST OF FIGURES
Figure 1 1: Infusion Therapy Device Market Share Ranking by Segment, Europe, 2019 4
Figure 1 2: Companies Researched in this Report 5
Figure 1 3: Factors Impacting the Infusion Therapy Device Market by Segment, Europe 6
Figure 1 4: Recent Events in the Infusion Therapy Device Market, Europe, 2016 – 2020 7
Figure 1 5: Infusion Therapy Device Markets Covered, Europe, 2019 (1 of 2) 8
Figure 1 6: Infusion Therapy Device Markets Covered, Europe, 2019 (2 of 2) 9
Figure 1 7: Key Report Updates 10
Figure 1 8: Version History 11
Figure 2 1: Infusion Therapy Device Market by Segment, Best Case Scenario, Europe, 2016 – 2026 (€M) 28
Figure 2 2: Infusion Therapy Device Market by Segment, Best Case Scenario, Europe, 2016 – 2026 (US$M) 29
Figure 2 3: Infusion Therapy Device Market by Segment, Base Case Scenario, Europe, 2016 – 2026 (€M) 30
Figure 2 4: Infusion Therapy Device Market by Segment, Base Case Scenario, Europe, 2016 – 2026 (US$M) 31
Figure 2 5: Infusion Therapy Device Market by Segment, Worst Case Scenario, Europe, 2016 – 2026 (€M) 32
Figure 2 6: Infusion Therapy Device Market by Segment, Worst Case Scenario, Europe, 2016 – 2026 (US$M) 33
Figure 4 1: Large Volume Infusion Pumps by Company 43
Figure 4 2: Syringe Pumps by Company 45
Figure 4 3: Patient-Controlled Analgesia Pumps by Company 47
Figure 4 4: Electronic Ambulatory Pumps by Company 49
Figure 4 5: Disposable Ambulatory Infusion Pumps by Company 50
Figure 4 6: Intravenous Sets by Company (1 of 2) 52
Figure 4 7: Intravenous Sets by Company (2 of 2) 53
Figure 4 8: Needleless Connectors by Company 56
Figure 4 9: Stopcocks by Company 57
Figure 4 10: Intravenous Filters by Company 58
Figure 4 11: Blood Transfusion Sets by Company 59
Figure 4 12: Blood Warmers by Company 61
Figure 4 13: Class 2 Device Recall Argon Medical Devices Stopcocks 62
Figure 4 14: Class 2 Device Recall Baxter SIGMA Spectrum Infusion Pump with Master Drug Library 63
Figure 4 15: Class 2 Device Recall Baxter SIGMA Spectrum Infusion Pump with Master Drug Library (Version 6) 63
Figure 4 16: Class 2 Device Recall Sigma Spectrum Infusion Pump with master Drug Library Version 6. 64
Figure 4 17: Class 2 Device Recall Baxter SIGMA Spectrum Infusion Pump with Master Drug Library (Version 6 and Version 8) 64
Figure 4 18: Class 2 Device Recall SPECTRUM IQ INFUSION SYSTEM WITH DOSE IQ SAFETY SOFTWARE 65
Figure 4 19: Class 2 Device Recall Baxter SIGMA Spectrum Infusion Pump 65
Figure 4 20: Class 2 Device Recall Clearlink System ContinuFlo Administration Sets 65
Figure 4 21: Class 2 Device Recall ONELINK Needlefree IV Connector 66
Figure 4 22: Class 2 Device Recall TherMax Blood Warmer Unit 66
Figure 4 23: Class 2 Device Recall BD Alaris PCEA Administration Set 67
Figure 4 24: Class 1 Device Recall CareFusion Alaris Pump 68
Figure 4 25: Class 2 Device Recall Volumat MC Agilia 68
Figure 4 26: Class 2 Device Recall Plum 360 Infusion System with MedNet/ Smart Card Plug n Play Module 69
Figure 4 27: Class 2 Device Recall Sapphire Primary 1.2 Micron Filter Set Microbore Plum Microbore Infusion Sets with inline Filter 69
Figure 4 28: Class 2 Device Recall Intravascular Administration Set 70
Figure 4 29: Class 2 Device Recall High Pressure Sets 400 psi 71
Figure 4 30: Class 2 Device Recall Medtronic MiniMed(TM) Silhouette(TM) 71
Figure 4 31: Class 2 Device Recall MOOG Curlin Infusion Administration Set 72
Figure 4 32: Class 2 Device Recall MOOG Curlin Infusion Administration Set 72
Figure 4 33: Class 2 Device Recall Graseby 3300 Pump and Graseby 3000 Seri8es Pump Accessories 73
Figure 4 34: Class 2 Device Recall CADDLegacy 73
Figure 4 35: Class 2 Device Recall Medfusion Syringe Pump, 4000 Series 73
Figure 4 36: Class 2 Device Recall Medfusion Syringe Pump 74
Figure 4 37: Class 2 Device Recall Medfusion Syringe Infusion Pump 74
Figure 4 38: Class 2 Device Recall Medfusion Model 4000 Syringe Infusion Pump 74
Figure 4 39: Class 1 Device Recall Medfusion Model 4000 Pump 75
Figure 4 40: Class 2 Device Recall CADD High Volume Administration Set 75
Figure 4 41: Class 2 Device Recall Medex stopcocks and manifolds 75
Figure 4 42: Class 2 Device Recall AMS636, 60" Microbore extension set. 76
Figure 4 43: Class 2 Device Recall 3Way Standardbore Stopcock 76
Figure 4 44: Class 2 Device Recall Zyno 77
Figure 4 45: Class 2 Device Recall Zyno 77
Figure 4 46: In-line Filtration Reduces Postoperative Phlebitis. 79
Figure 4 47: Chronic Convection Enhanced Delivery of Topotecan 79
Figure 4 48: In-line Filters on ICU 80
Figure 4 49: Efficacy of Intravenous In-line Filter in Patient Undergoing Cardiac Surgery 80
Figure 4 50: The Clinical Evaluation of Implantable Pump System For Safety And Delivery Accuracy In Patients Requiring Intrathecal Administration Of Morphine Sulfate For Chronic Pain 81
Figure 4 51: A Study of the Use of the Medtronic Pump and Codman Catheter to Give Chemotherapy to Patients With Colorectal Carcinoma or Cholangiocarcinoma 82
Figure 4 52: Codman Catheter/Synchromed Pump Hepatic Artery Chemotherapy for Unresectable Colorectal Metastases/Intrahepatic Cholangiocarcinoma 83
Figure 4 53: Hepatic Artery Infusion Pump Chemotherapy With Floxuridine and Dexamethasone in Combination With Systemic Chemotherapy for Patients With Colorectal Cancer Metastatic to the Liver 84
Figure 4 54: A Study to Compare Quality of Life and Satisfaction in Primary Immunodeficient Patients Treated With Subcutaneous Injections of Gammanorm® 165 mg/mL Administered With Two Different Delivery Devices: Injections Using Pump or Rapid Push 85
Figure 4 55: Hepatic Artery Infusion Pump for NPC Liver Metastases 86
Figure 4 56: The Comparison of Postoperative Pain After Colon Resection in Intravenous Patient-controlled Analgesia Between Conventional Mode and Optimizing B.I Mode With 'PAINSTOP' Equipment 86
Figure 4 57: The Efficacy and Safety of Accufuser Omnibus® (Elastomeric Infusion Pump); Comparative Clinical Trial 87
Figure 5 1: Currency Exchange Rate, 2019 89
Figure 5 2: Infusion Therapy Device Market by Segment, Europe, 2016 – 2026 (€M) 91
Figure 5 3: Infusion Therapy Device Market by Segment, Europe, 2016 – 2026 (US$M) 92
Figure 5 4: Infusion Therapy Device Market Growth by Segment, Europe, 2016 – 2026 97
Figure 5 5: Drivers and Limiters, Infusion Therapy Device Market, Europe, 2019 102
Figure 5 6: Leading Competitors, Infusion Therapy Device Market, Europe, 2019 108
Figure 5 7: SWOT Analysis, Avanos Medical 120
Figure 5 8: SWOT Analysis, Baxter 121
Figure 5 9: SWOT Analysis, B. Braun 122
Figure 5 10: SWOT Analysis, Becton Dickinson 123
Figure 5 11: SWOT Analysis, ICU Medical 124
Figure 5 12: SWOT Analysis, Smiths Medical 125
Figure 7 1: Infusion Pump Market by Type, Europe, 2016 – 2026 (€M) 142
Figure 7 2: Infusion Pump Market by Type, Europe, 2016 – 2026 (US$M) 143
Figure 7 3: Large Volume Infusion Pump Market, Europe, 2016 – 2026 148
Figure 7 4: Units Sold by Country, Large Volume Infusion Pump Market, Europe, 2016 – 2026 150
Figure 7 5: Average Selling Price by Country, Large Volume Infusion Pump Market, Europe, 2016 – 2026 (€) 151
Figure 7 6: Average Selling Price by Country, Large Volume Infusion Pump Market, Europe, 2016 – 2026 (US$) 152
Figure 7 7: Market Value by Country, Large Volume Infusion Pump Market, Europe, 2016 – 2026 (€M) 153
Figure 7 8: Market Value by Country, Large Volume Infusion Pump Market, Europe, 2016 – 2026 (US$M) 154
Figure 7 9: Large Volume Infusion Pump Market by Segment, Europe, 2016 – 2026 (€M) 155
Figure 7 10: Large Volume Infusion Pump Market by Segment, Europe, 2016 – 2026 (US$M) 156
Figure 7 11: Acute Care Large Volume Infusion Pump Market, Europe, 2016 – 2026 158
Figure 7 12: Units Sold by Country, Acute Care Large Volume Infusion Pump Market, Europe, 2016 – 2026 160
Figure 7 13: Average Selling Price by Country, Acute Care Large Volume Infusion Pump Market, Europe, 2016 – 2026 (€) 161
Figure 7 14: Average Selling Price by Country, Acute Care Large Volume Infusion Pump Market, Europe, 2016 – 2026 (US$) 162
Figure 7 15: Market Value by Country, Acute Care Large Volume Infusion Pump Market, Europe, 2016 – 2026 (€M) 163
Figure 7 16: Market Value by Country, Acute Care Large Volume Infusion Pump Market, Europe, 2016 – 2026 (US$M) 164
Figure 7 17: Alternate Care Large Volume Infusion Pump Market, Europe, 2016 – 2026 165
Figure 7 18: Units Sold by Country, Alternate Care Large Volume Infusion Pump Market, Europe, 2016 – 2026 167
Figure 7 19: Average Selling Price by Country, Alternate Care Large Volume Infusion Pump Market, Europe, 2016 – 2026 (€) 168
Figure 7 20: Average Selling Price by Country, Alternate Care Large Volume Infusion Pump Market, Europe, 2016 – 2026 (US$) 169
Figure 7 21: Market Value by Country, Alternate Care Large Volume Infusion Pump Market, Europe, 2016 – 2026 (€M) 170
Figure 7 22: Market Value by Country, Alternate Care Large Volume Infusion Pump Market, Europe, 2016 – 2026 (US$M) 171
Figure 7 23: Syringe Infusion Pump Market, Europe, 2016 – 2026 173
Figure 7 24: Units Sold by Country, Syringe Infusion Pump Market, Europe, 2016 – 2026 175
Figure 7 25: Average Selling Price by Country, Syringe Infusion Pump Market, Europe, 2016 – 2026 (€) 176
Figure 7 26: Average Selling Price by Country, Syringe Infusion Pump Market, Europe, 2016 – 2026 (US$) 177
Figure 7 27: Market Value by Country, Syringe Infusion Pump Market, Europe, 2016 – 2026 (€M) 178
Figure 7 28: Market Value by Country, Syringe Infusion Pump Market, Europe, 2016 – 2026 (US$M) 179
Figure 7 29: Syringe Infusion Pump Market by Segment, Europe, 2016 – 2026 (€M) 180
Figure 7 30: Syringe Infusion Pump Market by Segment, Europe, 2016 – 2026 (US$M) 181
Figure 7 31: Acute Care Syringe Infusion Pump Market, Europe, 2016 – 2026 183
Figure 7 32: Units Sold by Country, Acute Care Syringe Infusion Pump Market, Europe, 2016 – 2026 185
Figure 7 33: Average Selling Price by Country, Acute Care Syringe Infusion Pump Market, Europe, 2016 – 2026 (€) 186
Figure 7 34: Average Selling Price by Country, Acute Care Syringe Infusion Pump Market, Europe, 2016 – 2026 (US$) 187
Figure 7 35: Market Value by Country, Acute Care Syringe Infusion Pump Market, Europe, 2016 – 2026 (€M) 188
Figure 7 36: Market Value by Country, Acute Care Syringe Infusion Pump Market, Europe, 2016 – 2026 (US$M) 189
Figure 7 37: Alternate Care Syringe Infusion Pump Market, Europe, 2016 – 2026 190
Figure 7 38: Units Sold by Country, Alternate Care Syringe Infusion Pump Market, Europe, 2016 – 2026 192
Figure 7 39: Average Selling Price by Country, Alternate Care Syringe Infusion Pump Market, Europe, 2016 – 2026 (€) 193
Figure 7 40: Average Selling Price by Country, Alternate Care Syringe Infusion Pump Market, Europe, 2016 – 2026 (US$) 194
Figure 7 41: Market Value by Country, Alternate Care Syringe Infusion Pump Market, Europe, 2016 – 2026 (€M) 195
Figure 7 42: Market Value by Country, Alternate Care Syringe Infusion Pump Market, Europe, 2016 – 2026 (US$M) 196
Figure 7 43: Patient-Controlled Analgesia Infusion Pump Market, Europe, 2016 – 2026 197
Figure 7 44: Units Sold by Country, Patient-Controlled Analgesia Infusion Pump Market, Europe, 2016 – 2026 199
Figure 7 45: Average Selling Price by Country, Patient-Controlled Analgesia Infusion Pump Market, Europe, 2016 – 2026 (€) 200
Figure 7 46: Average Selling Price by Country, Patient-Controlled Analgesia Infusion Pump Market, Europe, 2016 – 2026 (US$) 201
Figure 7 47: Market Value by Country, Patient-Controlled Analgesia Infusion Pump Market, Europe, 2016 – 2026 (€M) 202
Figure 7 48: Market Value by Country, Patient-Controlled Analgesia Infusion Pump Market, Europe, 2016 – 2026 (US$M) 203
Figure 7 49: Electronic Ambulatory Infusion Pump Market, Europe, 2016 – 2026 205
Figure 7 50: Units Sold by Country, Electronic Ambulatory Infusion Pump Market, Europe, 2016 – 2026 207
Figure 7 51: Average Selling Price by Country, Electronic Ambulatory Infusion Pump Market, Europe, 2016 – 2026 (€) 208
Figure 7 52: Average Selling Price by Country, Electronic Ambulatory Infusion Pump Market, Europe, 2016 – 2026 (US$) 209
Figure 7 53: Market Value by Country, Electronic Ambulatory Infusion Pump Market, Europe, 2016 – 2026 (€M) 210
Figure 7 54: Market Value by Country, Electronic Ambulatory Infusion Pump Market, Europe, 2016 – 2026 (US$M) 211
Figure 7 55: Electronic Ambulatory Infusion Pump Market by Segment, Europe, 2016 – 2026 (€M) 212
Figure 7 56: Electronic Ambulatory Infusion Pump Market by Segment, Europe, 2016 – 2026 (US$M) 213
Figure 7 57: Acute Care Electronic Ambulatory Infusion Pump Market, Europe, 2016 – 2026 215
Figure 7 58: Units Sold by Country, Acute Care Electronic Ambulatory Infusion Pump Market, Europe, 2016 – 2026 217
Figure 7 59: Average Selling Price by Country, Acute Care Electronic Ambulatory Infusion Pump Market, Europe, 2016 – 2026 (€) 218
Figure 7 60: Average Selling Price by Country, Acute Care Electronic Ambulatory Infusion Pump Market, Europe, 2016 – 2026 (US$) 219
Figure 7 61: Market Value by Country, Acute Care Electronic Ambulatory Infusion Pump Market, Europe, 2016 – 2026 (€M) 220
Figure 7 62: Market Value by Country, Acute Care Electronic Ambulatory Infusion Pump Market, Europe, 2016 – 2026 (US$M) 221
Figure 7 63: Alternate Care Electronic Ambulatory Infusion Pump Market, Europe, 2016 – 2026 222
Figure 7 64: Units Sold by Country, Alternate Care Electronic Ambulatory Infusion Pump Market, Europe, 2016 – 2026 224
Figure 7 65: Average Selling Price by Country, Alternate Care Electronic Ambulatory Infusion Pump Market, Europe, 2016 – 2026 (€) 225
Figure 7 66: Average Selling Price by Country, Alternate Care Electronic Ambulatory Infusion Pump Market, Europe, 2016 – 2026 (US$) 226
Figure 7 67: Market Value by Country, Alternate Care Electronic Ambulatory Infusion Pump Market, Europe, 2016 – 2026 (€M) 227
Figure 7 68: Market Value by Country, Alternate Care Electronic Ambulatory Infusion Pump Market, Europe, 2016 – 2026 (US$M) 228
Figure 7 69: Total Disposable Ambulatory Infusion Pump Market, Europe, 2016 – 2026 229
Figure 7 70: Units Sold by Country, Total Disposable Ambulatory Infusion Pump Market, Europe, 2016 – 2026 231
Figure 7 71: Average Selling Price by Country, Total Disposable Ambulatory Infusion Pump Market, Europe, 2016 – 2026 (€) 232
Figure 7 72: Average Selling Price by Country, Total Disposable Ambulatory Infusion Pump Market, Europe, 2016 – 2026 (US$) 233
Figure 7 73: Market Value by Country, Total Disposable Ambulatory Infusion Pump Market, Europe, 2016 – 2026 (€M) 234
Figure 7 74: Market Value by Country, Total Disposable Ambulatory Infusion Pump Market, Europe, 2016 – 2026 (US$M) 235
Figure 7 75: Disposable Ambulatory Infusion Pump Market by Segment, Europe, 2016 – 2026 (€M) 237
Figure 7 76: Disposable Ambulatory Infusion Pump Market by Segment, Europe, 2016 – 2026 (US$M) 238
Figure 7 77: Non-Pain Disposable Ambulatory Infusion Pump Market, Europe, 2016 – 2026 240
Figure 7 78: Units Sold by Country, Non-Pain Disposable Ambulatory Infusion Pump Market, Europe, 2016 – 2026 242
Figure 7 79: Average Selling Price by Country, Non-Pain Disposable Ambulatory Infusion Pump Market, Europe, 2016 – 2026 (€) 243
Figure 7 80: Average Selling Price by Country, Non-Pain Disposable Ambulatory Infusion Pump Market, Europe, 2016 – 2026 (US$) 244
Figure 7 81: Market Value by Country, Non-Pain Disposable Ambulatory Infusion Pump Market, Europe, 2016 – 2026 (€M) 245
Figure 7 82: Market Value by Country, Non-Pain Disposable Ambulatory Infusion Pump Market, Europe, 2016 – 2026 (US$M) 246
Figure 7 83: Pain Disposable Ambulatory Infusion Pump Market, Europe, 2016 – 2026 247
Figure 7 84: Units Sold by Country, Pain Disposable Ambulatory Infusion Pump Market, Europe, 2016 – 2026 249
Figure 7 85: Average Selling Price by Country, Pain Disposable Ambulatory Infusion Pump Market, Europe, 2016 – 2026 (€) 250
Figure 7 86: Average Selling Price by Country, Pain Disposable Ambulatory Infusion Pump Market, Europe, 2016 – 2026 (US$) 251
Figure 7 87: Market Value by Country, Pain Disposable Ambulatory Infusion Pump Market, Europe, 2016 – 2026 (€M) 252
Figure 7 88: Market Value by Country, Pain Disposable Ambulatory Infusion Pump Market, Europe, 2016 – 2026 (US$M) 253
Figure 7 89: Large Volume Infusion Pump Units Sold by Purchase Type, Europe, 2016 – 2026 254
Figure 7 90: Units Sold by Country, Purchased Large Volume Infusion Pump Market, Europe, 2016 – 2026 256
Figure 7 91: Units Sold by Country, Placement Plan Large Volume Infusion Pump Market, Europe, 2016 – 2026 257
Figure 7 92: Syringe Infusion Pump Units Sold by Purchase Type, Europe, 2016 – 2026 259
Figure 7 93: Units Sold by Country, Purchased Syringe Infusion Pump Market, Europe, 2016 – 2026 261
Figure 7 94: Units Sold by Country, Placement Plan Syringe Infusion Pump Market, Europe, 2016 – 2026 262
Figure 7 95: Disposable Ambulatory Infusion Pump Units Sold by Care Setting, Europe, 2016 – 2026 264
Figure 7 96: Units Sold by Country, Acute Care Disposable Ambulatory Infusion Pump Market, Europe, 2016 – 2026 266
Figure 7 97: Units Sold by Country, Alternate Care Disposable Ambulatory Infusion Pump Market, Europe, 2016 – 2026 267
Figure 7 98: Drivers and Limiters, Infusion Pump Market, Europe, 2019 270
Figure 7 99: Leading Competitors, Infusion Pump Market, Europe, 2019 276
Figure 7 100: Leading Competitors by Country, Large Volume Infusion Pump Market, Europe, 2019 278
Figure 7 101: Leading Competitors by Country, Syringe Infusion Pump Market, Europe, 2019 279
Figure 7 102: Leading Competitors by Country, Electronic Ambulatory Infusion Pump Market, Europe, 2019 280
Figure 7 103: Leading Competitors by Country, Disposable Ambulatory Infusion Pump Market, Europe, 2019 281
Figure 8 1: Intravenous Set Market by Type, Europe, 2016 – 2026 (€M) 284
Figure 8 2: Intravenous Set Market by Type, Europe, 2016 – 2026 (US$M) 284
Figure 8 3: Total Pump Intravenous Set Market, Europe, 2016 – 2026 289
Figure 8 4: Units Sold by Country, Total Pump Intravenous Set Market, Europe, 2016 – 2026 291
Figure 8 5: Average Selling Price by Country, Total Pump Intravenous Set Market, Europe, 2016 – 2026 (€) 292
Figure 8 6: Average Selling Price by Country, Total Pump Intravenous Set Market, Europe, 2016 – 2026 (US$) 293
Figure 8 7: Market Value by Country, Total Pump Intravenous Set Market, Europe, 2016 – 2026 (€M) 294
Figure 8 8: Market Value by Country, Total Pump Intravenous Set Market, Europe, 2016 – 2026 (US$M) 295
Figure 8 9: Pump Intravenous Set Market by Care Setting, Europe, 2016 – 2026 (€M) 296
Figure 8 10: Pump Intravenous Set Market by Care Setting, Europe, 2016 – 2026 (US$M) 297
Figure 8 11: Acute Care Pump Intravenous Set Market, Europe, 2016 – 2026 299
Figure 8 12: Units Sold by Country, Acute Care Pump Intravenous Set Market, Europe, 2016 – 2026 301
Figure 8 13: Average Selling Price by Country, Acute Care Pump Intravenous Set Market, Europe, 2016 – 2026 (€) 302
Figure 8 14: Average Selling Price by Country, Acute Care Pump Intravenous Set Market, Europe, 2016 – 2026 (US$) 303
Figure 8 15: Market Value by Country, Acute Care Pump Intravenous Set Market, Europe, 2016 – 2026 (€M) 304
Figure 8 16: Market Value by Country, Acute Care Pump Intravenous Set Market, Europe, 2016 – 2026 (US$M) 305
Figure 8 17: Alternate Care Pump Intravenous Set Market, Europe, 2016 – 2026 306
Figure 8 18: Units Sold by Country, Alternate Care Pump Intravenous Set Market, Europe, 2016 – 2026 308
Figure 8 19: Average Selling Price by Country, Alternate Care Pump Intravenous Set Market, Europe, 2016 – 2026 (€) 309
Figure 8 20: Average Selling Price by Country, Alternate Care Pump Intravenous Set Market, Europe, 2016 – 2026 (US$) 310
Figure 8 21: Market Value by Country, Alternate Care Pump Intravenous Set Market, Europe, 2016 – 2026 (€M) 311
Figure 8 22: Market Value by Country, Alternate Care Pump Intravenous Set Market, Europe, 2016 – 2026 (US$M) 312
Figure 8 23: Pump Intravenous Set Market by Type, Europe, 2016 – 2026 (€M) 314
Figure 8 24: Pump Intravenous Set Market by Type, Europe, 2016 – 2026 (US$M) 314
Figure 8 25: Dedicated Pump Intravenous Set Market by Pump Type, Europe, 2016 – 2026 (€M) 316
Figure 8 26: Dedicated Pump Intravenous Set Market by Pump Type, Europe, 2016 – 2026 (US$M) 317
Figure 8 27: Dedicated Pump Intravenous Set Market, Europe, 2016 – 2026 319
Figure 8 28: Units Sold by Country, Dedicated Pump Intravenous Set Market, Europe, 2016 – 2026 321
Figure 8 29: Average Selling Price by Country, Dedicated Pump Intravenous Set Market, Europe, 2016 – 2026 (€) 322
Figure 8 30: Average Selling Price by Country, Dedicated Pump Intravenous Set Market, Europe, 2016 – 2026 (US$) 323
Figure 8 31: Market Value by Country, Dedicated Pump Intravenous Set Market, Europe, 2016 – 2026 (€M) 324
Figure 8 32: Market Value by Country, Dedicated Pump Intravenous Set Market, Europe, 2016 – 2026 (US$M) 325
Figure 8 33: Large Volume Dedicated Pump Intravenous Set Market, Europe, 2016 – 2026 326
Figure 8 34: Units Sold by Country, Large Volume Dedicated Pump Intravenous Set Market, Europe, 2016 – 2026 328
Figure 8 35: Average Selling Price by Country, Large Volume Dedicated Pump Intravenous Set Market, Europe, 2016 – 2026 (€) 329
Figure 8 36: Average Selling Price by Country, Large Volume Dedicated Pump Intravenous Set Market, Europe, 2016 – 2026 (US$) 330
Figure 8 37: Market Value by Country, Large Volume Dedicated Pump Intravenous Set Market, Europe, 2016 – 2026 (€M) 331
Figure 8 38: Market Value by Country, Large Volume Dedicated Pump Intravenous Set Market, Europe, 2016 – 2026 (US$M) 332
Figure 8 39: Other Dedicated Pump Intravenous Set Market, Europe, 2016 – 2026 333
Figure 8 40: Units Sold by Country, Other Dedicated Pump Intravenous Set Market, Europe, 2016 – 2026 335
Figure 8 41: Average Selling Price by Country, Other Dedicated Pump Intravenous Set Market, Europe, 2016 – 2026 (€) 336
Figure 8 42: Average Selling Price by Country, Other Dedicated Pump Intravenous Set Market, Europe, 2016 – 2026 (US$) 337
Figure 8 43: Market Value by Country, Other Dedicated Pump Intravenous Set Market, Europe, 2016 – 2026 (€M) 338
Figure 8 44: Market Value by Country, Other Dedicated Pump Intravenous Set Market, Europe, 2016 – 2026 (US$M) 339
Figure 8 45: Non-Dedicated Pump Intravenous Set Market, Europe, 2016 – 2026 340
Figure 8 46: Units Sold by Country, Non-Dedicated Pump Intravenous Set Market, Europe, 2016 – 2026 342
Figure 8 47: Average Selling Price by Country, Non-Dedicated Pump Intravenous Set Market, Europe, 2016 – 2026 (€) 343
Figure 8 48: Average Selling Price by Country, Non-Dedicated Pump Intravenous Set Market, Europe, 2016 – 2026 (US$) 344
Figure 8 49: Market Value by Country, Non-Dedicated Pump Intravenous Set Market, Europe, 2016 – 2026 (€M) 345
Figure 8 50: Market Value by Country, Non-Dedicated Pump Intravenous Set Market, Europe, 2016 – 2026 (US$M) 346
Figure 8 51: Total Gravity Intravenous Set Market, Europe, 2016 – 2026 348
Figure 8 52: Units Sold by Country, Total Gravity Intravenous Set Market, Europe, 2016 – 2026 350
Figure 8 53: Average Selling Price by Country, Total Gravity Intravenous Set Market, Europe, 2016 – 2026 (€) 351
Figure 8 54: Average Selling Price by Country, Total Gravity Intravenous Set Market, Europe, 2016 – 2026 (US$) 352
Figure 8 55: Market Value by Country, Total Gravity Intravenous Set Market, Europe, 2016 – 2026 (€M) 353
Figure 8 56: Market Value by Country, Total Gravity Intravenous Set Market, Europe, 2016 – 2026 (US$M) 354
Figure 8 57: Gravity Intravenous Set Market by Care Setting, Europe, 2016 – 2026 (€M) 355
Figure 8 58: Gravity Intravenous Set Market by Care Setting, Europe, 2016 – 2026 (US$M) 356
Figure 8 59: Acute Care Gravity Intravenous Set Market, Europe, 2016 – 2026 358
Figure 8 60: Units Sold by Country, Acute Care Gravity Intravenous Set Market, Europe, 2016 – 2026 360
Figure 8 61: Average Selling Price by Country, Acute Care Gravity Intravenous Set Market, Europe, 2016 – 2026 (€) 361
Figure 8 62: Average Selling Price by Country, Acute Care Gravity Intravenous Set Market, Europe, 2016 – 2026 (US$) 362
Figure 8 63: Market Value by Country, Acute Care Gravity Intravenous Set Market, Europe, 2016 – 2026 (€M) 363
Figure 8 64: Market Value by Country, Acute Care Gravity Intravenous Set Market, Europe, 2016 – 2026 (US$M) 364
Figure 8 65: Alternate Care Gravity Intravenous Set Market, Europe, 2016 – 2026 365
Figure 8 66: Units Sold by Country, Alternate Care Gravity Intravenous Set Market, Europe, 2016 – 2026 367
Figure 8 67: Average Selling Price by Country, Alternate Care Gravity Intravenous Set Market, Europe, 2016 – 2026 (€) 368
Figure 8 68: Average Selling Price by Country, Alternate Care Gravity Intravenous Set Market, Europe, 2016 – 2026 (US$) 369
Figure 8 69: Market Value by Country, Alternate Care Gravity Intravenous Set Market, Europe, 2016 – 2026 (€M) 370
Figure 8 70: Market Value by Country, Alternate Care Gravity Intravenous Set Market, Europe, 2016 – 2026 (US$M) 371
Figure 8 71: Gravity Intravenous Set Market by Type, Europe, 2016 – 2026 (€M) 372
Figure 8 72: Gravity Intravenous Set Market by Type, Europe, 2016 – 2026 (US$M) 373
Figure 8 73: Gravity Set with Airstop Market, Europe, 2016 – 2026 375
Figure 8 74: Units Sold by Country, Gravity Set with Airstop Market, Europe, 2016 – 2026 377
Figure 8 75: Average Selling Price by Country, Gravity Set with Airstop Market, Europe, 2016 – 2026 (€) 378
Figure 8 76: Average Selling Price by Country, Gravity Set with Airstop Market, Europe, 2016 – 2026 (US$) 379
Figure 8 77: Market Value by Country, Gravity Set with Airstop Market, Europe, 2016 – 2026 (€M) 380
Figure 8 78: Market Value by Country, Gravity Set with Airstop Market, Europe, 2016 – 2026 (US$M) 381
Figure 8 79: Gravity Set without Airstop Market, Europe, 2016 – 2026 382
Figure 8 80: Units Sold by Country, Gravity Set without Airstop Market, Europe, 2016 – 2026 384
Figure 8 81: Average Selling Price by Country, Gravity Set without Airstop Market, Europe, 2016 – 2026 (€) 385
Figure 8 82: Average Selling Price by Country, Gravity Set without Airstop Market, Europe, 2016 – 2026 (US$) 386
Figure 8 83: Market Value by Country, Gravity Set without Airstop Market, Europe, 2016 – 2026 (€M) 387
Figure 8 84: Market Value by Country, Gravity Set without Airstop Market, Europe, 2016 – 2026 (US$M) 388
Figure 8 85: Total Secondary Intravenous Set Market, Europe, 2016 – 2026 390
Figure 8 86: Units Sold by Country, Total Secondary Intravenous Set Market, Europe, 2016 – 2026 392
Figure 8 87: Average Selling Price by Country, Total Secondary Intravenous Set Market, Europe, 2016 – 2026 (€) 393
Figure 8 88: Average Selling Price by Country, Total Secondary Intravenous Set Market, Europe, 2016 – 2026 (US$) 394
Figure 8 89: Market Value by Country, Total Secondary Intravenous Set Market, Europe, 2016 – 2026 (€M) 395
Figure 8 90: Market Value by Country, Total Secondary Intravenous Set Market, Europe, 2016 – 2026 (US$M) 396
Figure 8 91: Secondary Intravenous Set Market by Care Setting, Europe, 2016 – 2026 (€M) 397
Figure 8 92: Secondary Intravenous Set Market by Care Setting, Europe, 2016 – 2026 (US$M) 398
Figure 8 93: Acute Care Secondary Intravenous Set Market, Europe, 2016 – 2026 400
Figure 8 94: Units Sold by Country, Acute Care Secondary Intravenous Set Market, Europe, 2016 – 2026 402
Figure 8 95: Average Selling Price by Country, Acute Care Secondary Intravenous Set Market, Europe, 2016 – 2026 (€) 403
Figure 8 96: Average Selling Price by Country, Acute Care Secondary Intravenous Set Market, Europe, 2016 – 2026 (US$) 404
Figure 8 97: Market Value by Country, Acute Care Secondary Intravenous Set Market, Europe, 2016 – 2026 (€M) 405
Figure 8 98: Market Value by Country, Acute Care Secondary Intravenous Set Market, Europe, 2016 – 2026 (US$M) 406
Figure 8 99: Alternate Care Secondary Intravenous Set Market, Europe, 2016 – 2026 407
Figure 8 100: Units Sold by Country, Alternate Care Secondary Intravenous Set Market, Europe, 2016 – 2026 409
Figure 8 101: Average Selling Price by Country, Alternate Care Secondary Intravenous Set Market, Europe, 2016 – 2026 (€) 410
Figure 8 102: Average Selling Price by Country, Alternate Care Secondary Intravenous Set Market, Europe, 2016 – 2026 (US$) 411
Figure 8 103: Market Value by Country, Alternate Care Secondary Intravenous Set Market, Europe, 2016 – 2026 (€M) 412
Figure 8 104: Market Value by Country, Alternate Care Secondary Intravenous Set Market, Europe, 2016 – 2026 (US$M) 413
Figure 8 105: Total Extension Intravenous Set Market, Europe, 2016 – 2026 414
Figure 8 106: Units Sold by Country, Total Extension Intravenous Set Market, Europe, 2016 – 2026 416
Figure 8 107: Average Selling Price by Country, Total Extension Intravenous Set Market, Europe, 2016 – 2026 (€) 417
Figure 8 108: Average Selling Price by Country, Total Extension Intravenous Set Market, Europe, 2016 – 2026 (US$) 418
Figure 8 109: Market Value by Country, Total Extension Intravenous Set Market, Europe, 2016 – 2026 (€M) 419
Figure 8 110: Market Value by Country, Total Extension Intravenous Set Market, Europe, 2016 – 2026 (US$M) 420
Figure 8 111: Extension Intravenous Set Market by Care Setting, Europe, 2016 – 2026 (€M) 421
Figure 8 112: Extension Intravenous Set Market by Care Setting, Europe, 2016 – 2026 (US$M) 422
Figure 8 113: Acute Care Extension Intravenous Set Market, Europe, 2016 – 2026 424
Figure 8 114: Units Sold by Country, Acute Care Extension Intravenous Set Market, Europe, 2016 – 2026 426
Figure 8 115: Average Selling Price by Country, Acute Care Extension Intravenous Set Market, Europe, 2016 – 2026 (€) 427
Figure 8 116: Average Selling Price by Country, Acute Care Extension Intravenous Set Market, Europe, 2016 – 2026 (US$) 428
Figure 8 117: Market Value by Country, Acute Care Extension Intravenous Set Market, Europe, 2016 – 2026 (€M) 429
Figure 8 118: Market Value by Country, Acute Care Extension Intravenous Set Market, Europe, 2016 – 2026 (US$M) 430
Figure 8 119: Alternate Care Extension Intravenous Set Market, Europe, 2016 – 2026 431
Figure 8 120: Units Sold by Country, Alternate Care Extension Intravenous Set Market, Europe, 2016 – 2026 433
Figure 8 121: Average Selling Price by Country, Alternate Care Extension Intravenous Set Market, Europe, 2016 – 2026 (€) 434
Figure 8 122: Average Selling Price by Country, Alternate Care Extension Intravenous Set Market, Europe, 2016 – 2026 (US$) 435
Figure 8 123: Market Value by Country, Alternate Care Extension Intravenous Set Market, Europe, 2016 – 2026 (€M) 436
Figure 8 124: Market Value by Country, Alternate Care Extension Intravenous Set Market, Europe, 2016 – 2026 (US$M) 437
Figure 8 125: Drivers and Limiters, Intravenous Set Market, Europe, 2019 440
Figure 8 126: Leading Competitors, Intravenous Set Market, Europe, 2019 444
Figure 8 127: Leading Competitors by Country, Intravenous Set Market, Europe, 2019 446
Figure 9 1: Needleless Connector Market by Displacement Type, Europe, 2016 – 2026 (€M) 450
Figure 9 2: Needleless Connector Market by Displacement Type, Europe, 2016 – 2026 (US$M) 451
Figure 9 3: Needleless Connector Market by Type, Europe, 2016 – 2026 (€M) 455
Figure 9 4: Needleless Connector Market by Type, Europe, 2016 – 2026 (US$M) 456
Figure 9 5: Needleless Connector Market by Care Setting, Europe, 2016 – 2026 (€M) 460
Figure 9 6: Needleless Connector Market by Care Setting, Europe, 2016 – 2026 (US$M) 461
Figure 9 7: Needleless Connector Market, Europe, 2016 – 2026 466
Figure 9 8: Units Sold by Country, Needleless Connector Market, Europe, 2016 – 2026 468
Figure 9 9: Average Selling Price by Country, Needleless Connector Market, Europe, 2016 – 2026 (€) 469
Figure 9 10: Average Selling Price by Country, Needleless Connector Market, Europe, 2016 – 2026 (US$) 470
Figure 9 11: Market Value by Country, Needleless Connector Market, Europe, 2016 – 2026 (€M) 471
Figure 9 12: Market Value by Country, Needleless Connector Market, Europe, 2016 – 2026 (US$M) 472
Figure 9 13: Negative Displacement Needleless Connector Market, Europe, 2016 – 2026 473
Figure 9 14: Units Sold by Country, Negative Displacement Needleless Connector Market, Europe, 2016 – 2026 475
Figure 9 15: Average Selling Price by Country, Negative Displacement Needleless Connector Market, Europe, 2016 – 2026 (€) 476
Figure 9 16: Average Selling Price by Country, Negative Displacement Needleless Connector Market, Europe, 2016 – 2026 (US$) 477
Figure 9 17: Market Value by Country, Negative Displacement Needleless Connector Market, Europe, 2016 – 2026 (€M) 478
Figure 9 18: Market Value by Country, Negative Displacement Needleless Connector Market, Europe, 2016 – 2026 (US$M) 479
Figure 9 19: Positive Displacement Needleless Connector Market, Europe, 2016 – 2026 480
Figure 9 20: Units Sold by Country, Positive Displacement Needleless Connector Market, Europe, 2016 – 2026 482
Figure 9 21: Average Selling Price by Country, Positive Displacement Needleless Connector Market, Europe, 2016 – 2026 (€) 483
Figure 9 22: Average Selling Price by Country, Positive Displacement Needleless Connector Market, Europe, 2016 – 2026 (US$) 484
Figure 9 23: Market Value by Country, Positive Displacement Needleless Connector Market, Europe, 2016 – 2026 (€M) 485
Figure 9 24: Market Value by Country, Positive Displacement Needleless Connector Market, Europe, 2016 – 2026 (US$M) 486
Figure 9 25: Neutral Displacement Needleless Connector Market, Europe, 2016 – 2026 487
Figure 9 26: Units Sold by Country, Neutral Displacement Needleless Connector Market, Europe, 2016 – 2026 489
Figure 9 27: Average Selling Price by Country, Neutral Displacement Needleless Connector Market, Europe, 2016 – 2026 (€) 490
Figure 9 28: Average Selling Price by Country, Neutral Displacement Needleless Connector Market, Europe, 2016 – 2026 (US$) 491
Figure 9 29: Market Value by Country, Neutral Displacement Needleless Connector Market, Europe, 2016 – 2026 (€M) 492
Figure 9 30: Market Value by Country, Neutral Displacement Needleless Connector Market, Europe, 2016 – 2026 (US$M) 493
Figure 9 31: Standalone Needleless Connector Market, Europe, 2016 – 2026 494
Figure 9 32: Units Sold by Country, Standalone Needleless Connector Market, Europe, 2016 – 2026 496
Figure 9 33: Average Selling Price by Country, Standalone Needleless Connector Market, Europe, 2016 – 2026 (€) 497
Figure 9 34: Average Selling Price by Country, Standalone Needleless Connector Market, Europe, 2016 – 2026 (US$) 498
Figure 9 35: Market Value by Country, Standalone Needleless Connector Market, Europe, 2016 – 2026 (€M) 499
Figure 9 36: Market Value by Country, Standalone Needleless Connector Market, Europe, 2016 – 2026 (US$M) 500
Figure 9 37: Integrated Needleless Connector Market, Europe, 2016 – 2026 501
Figure 9 38: Units Sold by Country, Integrated Needleless Connector Market, Europe, 2016 – 2026 503
Figure 9 39: Average Selling Price by Country, Integrated Needleless Connector Market, Europe, 2016 – 2026 (€) 504
Figure 9 40: Average Selling Price by Country, Integrated Needleless Connector Market, Europe, 2016 – 2026 (US$) 505
Figure 9 41: Market Value by Country, Integrated Needleless Connector Market, Europe, 2016 – 2026 (€M) 506
Figure 9 42: Market Value by Country, Integrated Needleless Connector Market, Europe, 2016 – 2026 (US$M) 507
Figure 9 43: Acute Care Needleless Connector Market, Europe, 2016 – 2026 508
Figure 9 44: Units Sold by Country, Acute Care Needleless Connector Market, Europe, 2016 – 2026 510
Figure 9 45: Average Selling Price by Country, Acute Care Needleless Connector Market, Europe, 2016 – 2026 (€) 511
Figure 9 46: Average Selling Price by Country, Acute Care Needleless Connector Market, Europe, 2016 – 2026 (US$) 512
Figure 9 47: Market Value by Country, Acute Care Needleless Connector Market, Europe, 2016 – 2026 (€M) 513
Figure 9 48: Market Value by Country, Acute Care Needleless Connector Market, Europe, 2016 – 2026 (US$M) 514
Figure 9 49: Alternate Care Needleless Connector Market, Europe, 2016 – 2026 515
Figure 9 50: Units Sold by Country, Alternate Care Needleless Connector Market, Europe, 2016 – 2026 517
Figure 9 51: Average Selling Price by Country, Alternate Care Needleless Connector Market, Europe, 2016 – 2026 (€) 518
Figure 9 52: Average Selling Price by Country, Alternate Care Needleless Connector Market, Europe, 2016 – 2026 (US$) 519
Figure 9 53: Market Value by Country, Alternate Care Needleless Connector Market, Europe, 2016 – 2026 (€M) 520
Figure 9 54: Market Value by Country, Alternate Care Needleless Connector Market, Europe, 2016 – 2026 (US$M) 521
Figure 9 55: Drivers and Limiters, Needleless Connector Market, Europe, 2019 524
Figure 9 56: Leading Competitors by Country, Needleless Connector Market, Europe, 2019 527
Figure 10 1: Stopcock Market, Europe, 2016 – 2026 532
Figure 10 2: Units Sold by Country, Stopcock Market, Europe, 2016 – 2026 534
Figure 10 3: Average Selling Price by Country, Stopcock Market, Europe, 2016 – 2026 (€) 535
Figure 10 4: Average Selling Price by Country, Stopcock Market, Europe, 2016 – 2026 (US$) 536
Figure 10 5: Market Value by Country, Stopcock Market, Europe, 2016 – 2026 (€M) 537
Figure 10 6: Market Value by Country, Stopcock Market, Europe, 2016 – 2026 (US$M) 538
Figure 10 7: Drivers and Limiters, Stopcock Market, Europe, 2019 540
Figure 10 8: Leading Competitors by Country, Stopcock Market, Europe, 2019 544
Figure 11 1: Blood Transfusion Set Market, Europe, 2016 – 2026 548
Figure 11 2: Units Sold by Country, Blood Transfusion Set Market, Europe, 2016 – 2026 550
Figure 11 3: Average Selling Price by Country, Blood Transfusion Set Market, Europe, 2016 – 2026 (€) 551
Figure 11 4: Average Selling Price by Country, Blood Transfusion Set Market, Europe, 2016 – 2026 (US$) 552
Figure 11 5: Market Value by Country, Blood Transfusion Set Market, Europe, 2016 – 2026 (€M) 553
Figure 11 6: Market Value by Country, Blood Transfusion Set Market, Europe, 2016 – 2026 (US$M) 554
Figure 11 7: Drivers and Limiters, Blood Transfusion Set Market, Europe, 2019 556
iData’s 9-Step Research Methodology
Our reports follow an in-depth 9-step methodology which focuses on the following research systems:- Original primary research that consists of the most up-to-date market data
- Strong foundation of quantitative and qualitative research
- Focused on the needs and strategic challenges of the industry participants
Step 1: Project Initiation & Team Selection During this preliminary investigation, all staff members involved in the industry discusses the topic in detail.
Step 2: Prepare Data Systems and Perform Secondary Research The first task of the research team is to prepare for the data collection process: Filing systems and relational databases are developed as needed.
Step 3: Preparation for Interviews & Questionnaire Design The core of all iData research reports is primary market research. Interviews with industry insiders represent the single most reliable way to obtain accurate, current data about market conditions, trends, threats and opportunities.
Step 4: Performing Primary Research At this stage, interviews are performed using contacts and information acquired in the secondary research phase.
Step 5: Research Analysis: Establishing Baseline Estimates Following the completion of the primary research phase, the collected information must be synthesized into an accurate view of the market status. The most important question is the current state of the market.
Step 6: Market Forecast and Analysis iData Research uses a proprietary method to combine statistical data and opinions of industry experts to forecast future market values.
Step 7: Identify Strategic Opportunities iData analysts identify in broad terms why some companies are gaining or losing share within a given market segment.
Step 8: Final Review and Market Release An integral part of the iData research methodology is a built-in philosophy of quality control and continuing improvement is integral to the iData philosophy.
Step 9: Customer Feedback and Market Monitoring iData philosophy of continuous improvement requires that reports and consulting projects be monitored after release for customer feedback and market accuracy.
Explore Options
Report Summary | FREE |
Infusion Therapy Market Size, Share & COVID19 Impact Analysis | Europe | 2020-2026 | MedSuite | Includes: Infusion Pumps, Intravenous Sets, Needless Connectors, Stopcocks & Blood Transfusion Sets
$295 – $10,995
- 2020
- 2016-2026
- Europe
- 10/16/2020
- 558
- MedSuite


