Figure 1-1: Gastrointestinal Endoscopic Device Market Share Ranking by Segment, Global, 2025 (1 of 2)
|
Figure 1-2: Gastrointestinal Endoscopic Device Market Share Ranking by Segment, Global, 2025 (2 of 2)
|
Figure 1-3: Companies Researched in This Report (1 of 2)
|
Figure 1-4: Companies Researched in This Report (2 of 2)
|
Figure 1-5: Factors Impacting the Gastrointestinal Endoscopic Device Market by Segment, Global (1 of 2)
|
Figure 1-6: Factors Impacting the Gastrointestinal Endoscopic Device Market by Segment, Global (2 of 2)
|
Figure 1-7: Recent Events in the Gastrointestinal Endoscopic Device Market, Global, 2022 – 2025 (1 of 4)
|
Figure 1-8: Recent Events in the Gastrointestinal Endoscopic Device Market, Global, 2022 – 2025 (2 of 4)
|
Figure 1-9: Recent Events in the Gastrointestinal Endoscopic Device Market, Global, 2022 – 2025 (3 of 4)
|
Figure 1-10: Recent Events in the Gastrointestinal Endoscopic Device Market, Global, 2022 – 2025 (4 of 4)
|
Figure 1-11: Gastrointestinal Endoscopic Device Procedure Segmentation
|
Figure 1-12: Gastrointestinal Endoscopic Device Market Segmentation (1 of 2)
|
Figure 1-13: Gastrointestinal Endoscopic Device Market Segmentation (2 of 2)
|
Figure 1-14: Gastrointestinal Endoscopic Device Regions Covered, Global (1 of 2)
|
Figure 1-15: Gastrointestinal Endoscopic Device Regions Covered, Global (2 of 2)
|
Figure 1-16: Key Report Updates (1 of 2)
|
Figure 1-17: Key Report Updates (2 of 2)
|
Figure 1-18: Version History
|
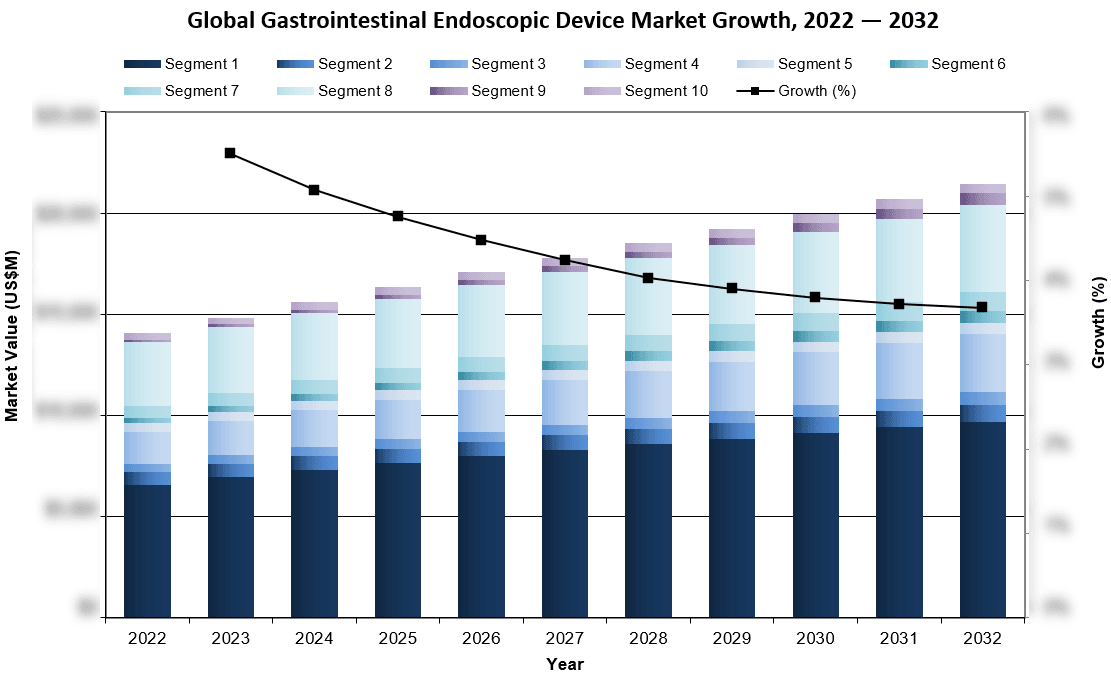
Figure 3-1: Gastrointestinal Endoscopic Device Market by Segment, Global, 2022 – 2032 (US$M) (1 of 2)
|
Figure 3-2: Gastrointestinal Endoscopic Device Market by Segment, Global, 2022 – 2032 (US$M) (2 of 2)
|
Figure 3-3: Gastrointestinal Endoscopic Device Market by Region, Global, 2022 – 2032 (US$M)
|
Figure 3-4: Leading Competitors, Global Gastrointestinal Device Market by Segment, Global, 2025 (1 of 2)
|
Figure 3-5: Leading Competitors, Global Gastrointestinal Device Market by Segment, Global, 2025 (2 of 2)
|
Figure 3-6: Other Notable Competitors, Global, 2025
|
Figure 4-1: Gastrointestinal Endoscope Procedure Segmentation
|
Figure 4-2: Gastrointestinal Endoscope Market Segmentation
|
Figure 4-3: Gastrointestinal Endoscope Regions Covered, Global (1 of 2)
|
Figure 4-4: Gastrointestinal Endoscope Regions Covered, Global (2 of 2)
|
Figure 4-5: Gastrointestinal Endoscopy Procedures by Segment, Global, 2022 – 2032
|
Figure 4-6: Gastrointestinal Endoscopy Procedures by Region, Global, 2022 – 2032
|
Figure 4-7: Gastrointestinal Endoscopy Procedures by Country, North America, 2022 – 2032
|
Figure 4-8: Gastrointestinal Endoscopy Procedures by Country, Latin America, 2022 – 2032 (1 of 2)
|
Figure 4-9: Gastrointestinal Endoscopy Procedures by Country, Latin America, 2022 – 2032 (2 of 2)
|
Figure 4-10: Gastrointestinal Endoscopy Procedures by Country, Western Europe, 2022 – 2032
|
Figure 4-11: Gastrointestinal Endoscopy Procedures by Country, Central & Eastern Europe, 2022 – 2032 (1 of 2)
|
Figure 4-12: Gastrointestinal Endoscopy Procedures by Country, Central & Eastern Europe, 2022 – 2032 (2 of 2)
|
Figure 4-13: Gastrointestinal Endoscopy Procedures by Country, Middle East, 2022 – 2032
|
Figure 4-14: Gastrointestinal Endoscopy Procedures by Country, Asia-Pacific, 2022 – 2032 (1 of 3)
|
Figure 4-15: Gastrointestinal Endoscopy Procedures by Country, Asia-Pacific, 2022 – 2032 (2 of 3)
|
Figure 4-16: Gastrointestinal Endoscopy Procedures by Country, Asia-Pacific, 2022 – 2032 (3 of 3)
|
Figure 4-17: Gastrointestinal Endoscopy Procedures by Country, Africa, 2022 – 2032
|
Figure 4-18: Upper GI (UGI/EGD) Procedures by Region, Global, 2022 – 2032
|
Figure 4-19: Upper GI (UGI/EGD) Procedures by Country, North America, 2022 – 2032
|
Figure 4-20: Upper GI (UGI/EGD) Procedures by Country, Latin America, 2022 – 2032 (1 of 2)
|
Figure 4-21: Upper GI (UGI/EGD) Procedures by Country, Latin America, 2022 – 2032 (2 of 2)
|
Figure 4-22: Upper GI (UGI/EGD) Procedures by Country, Western Europe, 2022 – 2032
|
Figure 4-23: Upper GI (UGI/EGD) Procedures by Country, Central & Eastern Europe, 2022 – 2032 (1 of 2)
|
Figure 4-24: Upper GI (UGI/EGD) Procedures by Country, Central & Eastern Europe, 2022 – 2032 (2 of 2)
|
Figure 4-25: Upper GI (UGI/EGD) Procedures by Country, Middle East, 2022 – 2032
|
Figure 4-26: Upper GI (UGI/EGD) Procedures by Country, Asia-Pacific, 2022 – 2032 (1 of 3)
|
Figure 4-27: Upper GI (UGI/EGD) Procedures by Country, Asia-Pacific, 2022 – 2032 (2 of 3)
|
Figure 4-28: Upper GI (UGI/EGD) Procedures by Country, Asia-Pacific, 2022 – 2032 (3 of 3)
|
Figure 4-29: Upper GI (UGI/EGD) Procedures by Country, Africa, 2022 – 2032
|
Figure 4-30: Colonoscopy Procedures by Region, Global, 2022 – 2032
|
Figure 4-31: Colonoscopy Procedures by Country, North America, 2022 – 2032
|
Figure 4-32: Colonoscopy Procedures by Country, Latin America, 2022 – 2032 (1 of 2)
|
Figure 4-33: Colonoscopy Procedures by Country, Latin America, 2022 – 2032 (2 of 2)
|
Figure 4-34: Colonoscopy Procedures by Country, Western Europe, 2022 – 2032
|
Figure 4-35: Colonoscopy Procedures by Country, Central & Eastern Europe, 2022 – 2032 (1 of 2)
|
Figure 4-36: Colonoscopy Procedures by Country, Central & Eastern Europe, 2022 – 2032 (2 of 2)
|
Figure 4-37: Colonoscopy Procedures by Country, Middle East, 2022 – 2032
|
Figure 4-38: Colonoscopy Procedures by Country, Asia-Pacific, 2022 – 2032 (1 of 3)
|
Figure 4-39: Colonoscopy Procedures by Country, Asia-Pacific, 2022 – 2032 (2 of 3)
|
Figure 4-40: Colonoscopy Procedures by Country, Asia-Pacific, 2022 – 2032 (3 of 3)
|
Figure 4-41: Colonoscopy Procedures by Country, Africa, 2022 – 2032
|
Figure 4-42: Enteroscopy Procedures by Region, Global, 2022 – 2032
|
Figure 4-43: Enteroscopy Procedures by Country, North America, 2022 – 2032
|
Figure 4-44: Enteroscopy Procedures by Country, Latin America, 2022 – 2032 (1 of 2)
|
Figure 4-45: Enteroscopy Procedures by Country, Latin America, 2022 – 2032 (2 of 2)
|
Figure 4-46: Enteroscopy Procedures by Country, Western Europe, 2022 – 2032
|
Figure 4-47: Enteroscopy Procedures by Country, Central & Eastern Europe, 2022 – 2032 (1 of 2)
|
Figure 4-48: Enteroscopy Procedures by Country, Central & Eastern Europe, 2022 – 2032 (2 of 2)
|
Figure 4-49: Enteroscopy Procedures by Country, Middle East, 2022 – 2032
|
Figure 4-50: Enteroscopy Procedures by Country, Asia-Pacific, 2022 – 2032 (1 of 3)
|
Figure 4-51: Enteroscopy Procedures by Country, Asia-Pacific, 2022 – 2032 (2 of 3)
|
Figure 4-52: Enteroscopy Procedures by Country, Asia-Pacific, 2022 – 2032 (3 of 3)
|
Figure 4-53: Enteroscopy Procedures by Country, Africa, 2022 – 2032
|
Figure 4-54: Ultrasound Endoscopy Procedures by Region, Global, 2022 – 2032
|
Figure 4-55: Ultrasound Endoscopy Procedures by Country, North America, 2022 – 2032
|
Figure 4-56: Ultrasound Endoscopy Procedures by Country, Latin America, 2022 – 2032 (1 of 2)
|
Figure 4-57: Ultrasound Endoscopy Procedures by Country, Latin America, 2022 – 2032 (2 of 2)
|
Figure 4-58: Ultrasound Endoscopy Procedures by Country, Western Europe, 2022 – 2032
|
Figure 4-59: Ultrasound Endoscopy Procedures by Country, Central & Eastern Europe, 2022 – 2032 (1 of 2)
|
Figure 4-60: Ultrasound Endoscopy Procedures by Country, Central & Eastern Europe, 2022 – 2032 (2 of 2)
|
Figure 4-61: Ultrasound Endoscopy Procedures by Country, Middle East, 2022 – 2032
|
Figure 4-62: Ultrasound Endoscopy Procedures by Country, Asia-Pacific, 2022 – 2032 (1 of 3)
|
Figure 4-63: Ultrasound Endoscopy Procedures by Country, Asia-Pacific, 2022 – 2032 (2 of 3)
|
Figure 4-64: Ultrasound Endoscopy Procedures by Country, Asia-Pacific, 2022 – 2032 (3 of 3)
|
Figure 4-65: Ultrasound Endoscopy Procedures by Country, Africa, 2022 – 2032
|
Figure 4-66: Gastrointestinal (GI) Endoscope Market by Segment, Global, 2022 – 2032 (US$M)
|
Figure 4-67: Gastrointestinal (GI) Endoscope Market by Region, Global, 2022 – 2032 (US$M)
|
Figure 4-68: Reusable Gastrointestinal Endoscope Market by Segment, Global, 2022 – 2032 (US$M)
|
Figure 4-69: New Units Reusable Gastrointestinal Endoscope Market by Segment, Global, 2022 – 2032 (US$M)
|
Figure 4-70: Reusable Gastrointestinal Endoscope Service Market by Segment, Global, 2022 – 2032 (US$M)
|
Figure 4-71: Total New Units Reusable Gastrointestinal Endoscope Market, Global, 2022 – 2032
|
Figure 4-72: Units Sold by Region, Total New Units Reusable Gastrointestinal Endoscope Market, Global, 2022 – 2032
|
Figure 4-73: Average Selling Price by Region, Reusable Gastrointestinal Endoscope Market, Global, 2022 – 2032 (US$)
|
Figure 4-74: Market Value by Region, Reusable Gastrointestinal Endoscope Market, Global, 2022 – 2032 (US$M)
|
Figure 4-75: Reusable Gastrointestinal Endoscope Service Market, Global, 2022 – 2032
|
Figure 4-76: Units Serviced by Region, Reusable Gastrointestinal Endoscope Service Market, Global, 2022 – 2032
|
Figure 4-77: Average Selling Price by Region, Reusable Gastrointestinal Endoscope Service Market, Global, 2022 – 2032 (US$)
|
Figure 4-78: Market Value by Region, Reusable Gastrointestinal Endoscope Service Market, Global, 2022 – 2032 (US$M)
|
Figure 4-79: Reusable Colonoscope Market by Segment, Global, 2022 – 2032 (US$M)
|
Figure 4-80: New Unit Reusable Colonoscope Market, Global, 2022 – 2032
|
Figure 4-81: Units Sold by Region, New Unit Reusable Colonoscope Market, Global, 2022 – 2032
|
Figure 4-82: Average Selling Price by Region, New Unit Reusable Colonoscope Market, Global, 2022 – 2032 (US$)
|
Figure 4-83: Market Value by Region, New Unit Reusable Colonoscope Market, Global, 2022 – 2032 (US$M)
|
Figure 4-84: Reusable Colonoscope Service Market, Global, 2022 – 2032
|
Figure 4-85: Units Serviced by Region, Reusable Colonoscope Service Market, Global, 2022 – 2032
|
Figure 4-86: Average Selling Price by Region, Reusable Colonoscope Service Market, Global, 2022 – 2032 (US$)
|
Figure 4-87: Market Value by Region, Reusable Colonoscope Service Market, Global, 2022 – 2032 (US$M)
|
Figure 4-88: Duodenoscope Market by Segment, Global, 2022 – 2032 (US$M)
|
Figure 4-89: New Unit Reusable Duodenoscope Market, Global, 2022 – 2032
|
Figure 4-90: Units Sold by Region, New Unit Reusable Duodenoscope Market, Global, 2022 – 2032
|
Figure 4-91: Average Selling Price by Region, New Unit Duodenoscope Market, Global, 2022 – 2032 (US$)
|
Figure 4-92: Market Value by Region, New Unit Reusable Duodenoscope Market, Global, 2022 – 2032 (US$M)
|
Figure 4-93: Reusable Duodenoscopes Service Market, Global, 2022 – 2032
|
Figure 4-94: Units Serviced by Region, Reusable Duodenoscopes Service Market, Global, 2022 – 2032
|
Figure 4-95: Average Selling Price by Region, Reusable Duodenoscopes Service Market, Global, 2022 – 2032 (US$)
|
Figure 4-96: Market Value by Region, Reusable Duodenoscopes Service Market, Global, 2022 – 2032 (US$M)
|
Figure 4-97: Enteroscope Market by Segment, Global, 2022 – 2032 (US$M)
|
Figure 4-98: New Unit Reusable Enteroscope Market, Global, 2022 – 2032
|
Figure 4-99: Units Sold by Region, New Unit Reusable Enteroscope Market, Global, 2022 – 2032
|
Figure 4-100: Average Selling Price by Region, New Unit Enteroscope Market, Global, 2022 – 2032 (US$)
|
Figure 4-101: Market Value by Region, New Unit Reusable Enteroscope Market, Global, 2022 – 2032 (US$M)
|
Figure 4-102: Reusable Enteroscopes Service Market, Global, 2022 – 2032
|
Figure 4-103: Units Serviced by Region, Reusable Enteroscopes Service Market, Global, 2022 – 2032
|
Figure 4-104: Average Selling Price by Region, Reusable Enteroscopes Service Market, Global, 2022 – 2032 (US$)
|
Figure 4-105: Market Value by Region, Reusable Enteroscopes Service Market, Global, 2022 – 2032 (US$M)
|
Figure 4-106: Ultrasound Endoscope Market by Segment, Global, 2022 – 2032 (US$M)
|
Figure 4-107: New Unit Reusable Ultrasound Endoscope Market, Global, 2022 – 2032
|
Figure 4-108: Units Sold by Region, New Unit Reusable Ultrasound Endoscope Market, Global, 2022 – 2032
|
Figure 4-109: Average Selling Price by Region, New Unit Ultrasound Endoscope Market, Global, 2022 – 2032 (US$)
|
Figure 4-110: Market Value by Region, New Unit Reusable Ultrasound Endoscope Market, Global, 2022 – 2032 (US$M)
|
Figure 4-111: Reusable Ultrasound Endoscopes Service Market, Global, 2022 – 2032
|
Figure 4-112: Units Serviced by Region, Reusable Ultrasound Endoscopes Service Market, Global, 2022 – 2032
|
Figure 4-113: Average Selling Price by Region, Reusable Ultrasound Endoscopes Service Market, Global, 2022 – 2032 (US$)
|
Figure 4-114: Market Value by Region, Reusable Ultrasound Endoscopes Service Market, Global, 2022 – 2032 (US$M)
|
Figure 4-115: Reusable Gastroscope Market by Segment, Global, 2022 – 2032 (US$M)
|
Figure 4-116: New Unit Reusable Gastroscope Market, Global, 2022 – 2032
|
Figure 4-117: Units Sold by Region, New Unit Reusable Gastroscope Market, Global, 2022 – 2032
|
Figure 4-118: Average Selling Price by Region, New Unit Reusable Gastroscope Market, Global, 2022 – 2032 (US$)
|
Figure 4-119: Market Value by Region, New Unit Reusable Gastroscope Market, Global, 2022 – 2032 (US$M)
|
Figure 4-120: Reusable Gastroscope Service Market, Global, 2022 – 2032
|
Figure 4-121: Units Serviced by Region, Reusable Gastroscope Service Market, Global, 2022 – 2032
|
Figure 4-122: Average Selling Price by Region, Reusable Gastroscope Service Market, Global, 2022 – 2032 (US$)
|
Figure 4-123: Market Value by Region, Reusable Gastroscope Service Market, Global, 2022 – 2032 (US$M)
|
Figure 4-124: Single-Use Gastrointestinal Endoscope Market by Segment, Global, 2022 – 2032 (US$M)
|
Figure 4-125: Total Single-Use Gastrointestinal Endoscope Market, Global, 2022 – 2032
|
Figure 4-126: Units Sold by Region, Single-Use Gastrointestinal Endoscope Market, Global, 2022 – 2032
|
Figure 4-127: Average Selling Price by Region, Single-Use Gastrointestinal Endoscope Market, Global, 2022 – 2032 (US$)
|
Figure 4-128: Market Value by Region, Single-Use Gastrointestinal Endoscope Market, Global, 2022 – 2032 (US$M)
|
Figure 4-129: Duodenoscope Market, Global, 2022 – 2032
|
Figure 4-130: Units Sold by Region, Duodenoscope Market, Global, 2022 – 2032
|
Figure 4-131: Average Selling Price by Region, Duodenoscope Market, Global, 2022 – 2032 (US$)
|
Figure 4-132: Market Value by Region, Duodenoscope Market, Global, 2022 – 2032 (US$M)
|
Figure 4-133: Cholangioscope Market, Global, 2022 – 2032
|
Figure 4-134: Units Sold by Region, Cholangioscope Market, Global, 2022 – 2032
|
Figure 4-135: Average Selling Price by Region, Cholangioscope Market, Global, 2022 – 2032 (US$)
|
Figure 4-136: Market Value by Region, Cholangioscope Market, Global, 2022 – 2032 (US$M)
|
Figure 4-137: Gastroscope Market, Global, 2022 – 2032
|
Figure 4-138: Units Sold by Region, Gastroscope Market, Global, 2022 – 2032
|
Figure 4-139: Average Selling Price by Region, Gastroscope Market, Global, 2022 – 2032 (US$)
|
Figure 4-140: Market Value by Region, Gastroscope Market, Global, 2022 – 2032 (US$M)
|
Figure 4-141: Choledochoscope Market, Global, 2022 – 2032
|
Figure 4-142: Units Sold by Region, Choledochoscope Market, Global, 2022 – 2032
|
Figure 4-143: Average Selling Price by Region, Choledochoscope Market, Global, 2022 – 2032 (US$)
|
Figure 4-144: Market Value by Region, Choledochoscope Market, Global, 2022 – 2032 (US$M)
|
Figure 4-145: Leading Competitors, Gastrointestinal Endoscope Market, Global, 2025
|
Figure 5-1: Capsule Endoscopy Regions Covered, Global (1 of 2)
|
Figure 5-2: Capsule Endoscopy Regions Covered, Global (2 of 2)
|
Figure 5-3: Capsule Endoscopy Procedures by Region, Global, 2022 – 2032
|
Figure 5-4: Capsule Endoscopy Procedures by Country, North America, 2022 – 2032
|
Figure 5-5: Capsule Endoscopy Procedures by Country, Latin America, 2022 – 2032 (1 of 2)
|
Figure 5-6: Capsule Endoscopy Procedures by Country, Latin America, 2022 – 2032 (2 of 2)
|
Figure 5-7: Capsule Endoscopy Procedures by Country, Western Europe, 2022 – 2032
|
Figure 5-8: Capsule Endoscopy Procedures by Country, Central & Eastern Europe, 2022 – 2032 (1 of 2)
|
Figure 5-9: Capsule Endoscopy Procedures by Country, Central & Eastern Europe, 2022 – 2032 (2 of 2)
|
Figure 5-10: Capsule Endoscopy Procedures by Country, Middle East, 2022 – 2032
|
Figure 5-11: Capsule Endoscopy Procedures by Country, Asia-Pacific, 2022 – 2032 (1 of 3)
|
Figure 5-12: Capsule Endoscopy Procedures by Country, Asia-Pacific, 2022 – 2032 (2 of 3)
|
Figure 5-13: Capsule Endoscopy Procedures by Country, Asia-Pacific, 2022 – 2032 (3 of 3)
|
Figure 5-14: Capsule Endoscopy Procedures by Country, Africa, 2022 – 2032
|
Figure 5-15: Capsule Endoscopy Market by Segment, Global., 2022 – 2032 (US$M)
|
Figure 5-16: Capsule Endoscopy Market by Region, Global, 2022 – 2032 (US$M)
|
Figure 5-17: Capsule Endoscopy Market, U.S., 2022 – 2032
|
Figure 5-18: Units Sold by Region, Capsule Endoscopy Market, Global, 2022 – 2032
|
Figure 5-19: Average Selling Price by Region, Capsule Endoscopy Market, Global, 2022 – 2032 (US$)
|
Figure 5-20: Market Value by Region, Capsule Endoscopy Market, Global, 2022 – 2032 (US$M)
|
Figure 5-21: Camera Capsule Market, U.S., 2022 – 2032
|
Figure 5-22: Units Sold by Region, Camera Capsule Market, Global, 2022 – 2032
|
Figure 5-23: Average Selling Price by Region, Camera Capsule Market, Global, 2022 – 2032 (US$)
|
Figure 5-24: Market Value by Region, Camera Capsule Market, Global, 2022 – 2032 (US$M)
|
Figure 5-25: Data Recorder Market, U.S., 2022 – 2032
|
Figure 5-26: Units Sold by Region, Data Recorder Market, Global, 2022 – 2032
|
Figure 5-27: Average Selling Price by Region, Data Recorder Market, Global, 2022 – 2032 (US$)
|
Figure 5-28: Market Value by Region, Data Recorder Market, Global, 2022 – 2032 (US$M)
|
Figure 5-29: Leading Competitors, Capsule Endoscopy Market, Global, 2025
|
Figure 6-1: Stenting & Dilation Procedure Segmentation
|
Figure 6-2: Stenting & Dilation Market Segmentation
|
Figure 6-3: Stenting & Dilation Regions Covered, Global (1 of 2)
|
Figure 6-4: Stenting & Dilation Regions Covered, Global (2 of 2)
|
Figure 6-5: Stenting and Dilation Procedures by Segment, Global, 2022 – 2032
|
Figure 6-6: Stenting & Dilation Procedures by Region, Global, 2022 – 2032
|
Figure 6-7: Stenting & Dilation Procedures by Country, North America, 2022 – 2032
|
Figure 6-8: Stenting & Dilation Procedures by Country, Latin America, 2022 – 2032 (1 of 2)
|
Figure 6-9: Stenting & Dilation Procedures by Country, Latin America, 2022 – 2032 (2 of 2)
|
Figure 6-10: Stenting & Dilation Procedures by Country, Western Europe, 2022 – 2032
|
Figure 6-11: Stenting & Dilation Procedures by Country, Central & Eastern Europe, 2022 – 2032 (1 of 2)
|
Figure 6-12: Stenting & Dilation Procedures by Country, Central & Eastern Europe, 2022 – 2032 (2 of 2)
|
Figure 6-13: Stenting & Dilation Procedures by Country, Middle East, 2022 – 2032
|
Figure 6-14: Stenting & Dilation Procedures by Country, Asia-Pacific, 2022 – 2032 (1 of 3)
|
Figure 6-15: Stenting & Dilation Procedures by Country, Asia-Pacific, 2022 – 2032 (2 of 3)
|
Figure 6-16: Stenting & Dilation Procedures by Country, Asia-Pacific, 2022 – 2032 (3 of 3)
|
Figure 6-17: Stenting & Dilation Procedures by Country, Africa, 2022 – 2032
|
Figure 6-18: Stenting Procedures by Segment, Global, 2022 – 2032
|
Figure 6-19: Stenting Procedures by Region, Global, 2022 – 2032
|
Figure 6-20: Stenting Procedures by Country, North America, 2022 – 2032
|
Figure 6-21: Stenting Procedures by Country, Latin America, 2022 – 2032 (1 of 2)
|
Figure 6-22: Stenting Procedures by Country, Latin America, 2022 – 2032 (2 of 2)
|
Figure 6-23: Stenting Procedures by Country, Western Europe, 2022 – 2032
|
Figure 6-24: Stenting Procedures by Country, Central & Eastern Europe, 2022 – 2032 (1 of 2)
|
Figure 6-25: Stenting Procedures by Country, Central & Eastern Europe, 2022 – 2032 (2 of 2)
|
Figure 6-26: Stenting Procedures by Country, Middle East, 2022 – 2032
|
Figure 6-27: Stenting Procedures by Country, Asia-Pacific, 2022 – 2032 (1 of 3)
|
Figure 6-28: Stenting Procedures by Country, Asia-Pacific, 2022 – 2032 (2 of 3)
|
Figure 6-29: Stenting Procedures by Country, Asia-Pacific, 2022 – 2032 (3 of 3)
|
Figure 6-30: Stenting Procedures by Country, Africa, 2022 – 2032
|
Figure 6-31: Esophageal Stenting Procedures by Region, Global, 2022 – 2032
|
Figure 6-32: Esophageal Stenting Procedures by Country, North America, 2022 – 2032
|
Figure 6-33: Esophageal Stenting Procedures by Country, Latin America, 2022 – 2032 (1 of 2)
|
Figure 6-34: Esophageal Stenting Procedures by Country, Latin America, 2022 – 2032 (2 of 2)
|
Figure 6-35: Esophageal Stenting Procedures by Country, Western Europe, 2022 – 2032
|
Figure 6-36: Esophageal Stenting Procedures by Country, Central & Eastern Europe, 2022 – 2032 (1 of 2)
|
Figure 6-37: Esophageal Stenting Procedures by Country, Central & Eastern Europe, 2022 – 2032 (2 of 2)
|
Figure 6-38: Esophageal Stenting Procedures by Country, Middle East, 2022 – 2032
|
Figure 6-39: Esophageal Stenting Procedures by Country, Asia-Pacific, 2022 – 2032 (1 of 3)
|
Figure 6-40: Esophageal Stenting Procedures by Country, Asia-Pacific, 2022 – 2032 (2 of 3)
|
Figure 6-41: Esophageal Stenting Procedures by Country, Asia-Pacific, 2022 – 2032 (3 of 3)
|
Figure 6-42: Esophageal Stenting Procedures by Country, Africa, 2022 – 2032
|
Figure 6-43: Duodenal Stenting Procedures by Region, Global, 2022 – 2032
|
Figure 6-44: Duodenal Stenting Procedures by Country, North America, 2022 – 2032
|
Figure 6-45: Duodenal Stenting Procedures by Country, Latin America, 2022 – 2032 (1 of 2)
|
Figure 6-46: Duodenal Stenting Procedures by Country, Latin America, 2022 – 2032 (2 of 2)
|
Figure 6-47: Duodenal Stenting Procedures by Country, Western Europe, 2022 – 2032
|
Figure 6-48: Duodenal Stenting Procedures by Country, Central & Eastern Europe, 2022 – 2032 (1 of 2)
|
Figure 6-49: Duodenal Stenting Procedures by Country, Central & Eastern Europe, 2022 – 2032 (2 of 2)
|
Figure 6-50: Duodenal Stenting Procedures by Country, Middle East, 2022 – 2032
|
Figure 6-51: Duodenal Stenting Procedures by Country, Asia-Pacific, 2022 – 2032 (1 of 3)
|
Figure 6-52: Duodenal Stenting Procedures by Country, Asia-Pacific, 2022 – 2032 (2 of 3)
|
Figure 6-53: Duodenal Stenting Procedures by Country, Asia-Pacific, 2022 – 2032 (3 of 3)
|
Figure 6-54: Duodenal Stenting Procedures by Country, Africa, 2022 – 2032
|
Figure 6-55: Colonic Stenting Procedures by Region, Global, 2022 – 2032
|
Figure 6-56: Colonic Stenting Procedures by Country, North America, 2022 – 2032
|
Figure 6-57: Colonic Stenting Procedures by Country, Latin America, 2022 – 2032 (1 of 2)
|
Figure 6-58: Colonic Stenting Procedures by Country, Latin America, 2022 – 2032 (2 of 2)
|
Figure 6-59: Colonic Stenting Procedures by Country, Western Europe, 2022 – 2032
|
Figure 6-60: Colonic Stenting Procedures by Country, Central & Eastern Europe, 2022 – 2032 (1 of 2)
|
Figure 6-61: Colonic Stenting Procedures by Country, Central & Eastern Europe, 2022 – 2032 (2 of 2)
|
Figure 6-62: Colonic Stenting Procedures by Country, Middle East, 2022 – 2032
|
Figure 6-63: Colonic Stenting Procedures by Country, Asia-Pacific, 2022 – 2032 (1 of 3)
|
Figure 6-64: Colonic Stenting Procedures by Country, Asia-Pacific, 2022 – 2032 (2 of 3)
|
Figure 6-65: Colonic Stenting Procedures by Country, Asia-Pacific, 2022 – 2032 (3 of 3)
|
Figure 6-66: Colonic Stenting Procedures by Country, Africa, 2022 – 2032
|
Figure 6-67: Dilation Procedures by Segment, Global, 2022 – 2032
|
Figure 6-68: Dilation Procedures by Region, Global, 2022 – 2032
|
Figure 6-69: Dilation Procedures by Country, North America, 2022 – 2032
|
Figure 6-70: Dilation Procedures by Country, Latin America, 2022 – 2032 (1 of 2)
|
Figure 6-71: Dilation Procedures by Country, Latin America, 2022 – 2032 (2 of 2)
|
Figure 6-72: Dilation Procedures by Country, Western Europe, 2022 – 2032
|
Figure 6-73: Dilation Procedures by Country, Central & Eastern Europe, 2022 – 2032 (1 of 2)
|
Figure 6-74: Dilation Procedures by Country, Central & Eastern Europe, 2022 – 2032 (2 of 2)
|
Figure 6-75: Dilation Procedures by Country, Middle East, 2022 – 2032
|
Figure 6-76: Dilation Procedures by Country, Asia-Pacific, 2022 – 2032 (1 of 3)
|
Figure 6-77: Dilation Procedures by Country, Asia-Pacific, 2022 – 2032 (2 of 3)
|
Figure 6-78: Dilation Procedures by Country, Asia-Pacific, 2022 – 2032 (3 of 3)
|
Figure 6-79: Dilation Procedures by Country, Africa, 2022 – 2032
|
Figure 6-80: Esophageal Dilation Procedures by Region, Global, 2022 – 2032
|
Figure 6-81: Esophageal Dilation Procedures by Country, North America, 2022 – 2032
|
Figure 6-82: Esophageal Dilation Procedures by Country, Latin America, 2022 – 2032 (1 of 2)
|
Figure 6-83: Esophageal Dilation Procedures by Country, Latin America, 2022 – 2032 (2 of 2)
|
Figure 6-84: Esophageal Dilation Procedures by Country, Western Europe, 2022 – 2032
|
Figure 6-85: Esophageal Dilation Procedures by Country, Central & Eastern Europe, 2022 – 2032 (1 of 2)
|
Figure 6-86: Esophageal Dilation Procedures by Country, Central & Eastern Europe, 2022 – 2032 (2 of 2)
|
Figure 6-87: Esophageal Dilation Procedures by Country, Middle East, 2022 – 2032
|
Figure 6-88: Esophageal Dilation Procedures by Country, Asia-Pacific, 2022 – 2032 (1 of 3)
|
Figure 6-89: Esophageal Dilation Procedures by Country, Asia-Pacific, 2022 – 2032 (2 of 3)
|
Figure 6-90: Esophageal Dilation Procedures by Country, Asia-Pacific, 2022 – 2032 (3 of 3)
|
Figure 6-91: Esophageal Dilation Procedures by Country, Africa, 2022 – 2032
|
Figure 6-92: Duodenal Dilation Procedures by Region, Global, 2022 – 2032
|
Figure 6-93: Duodenal Dilation Procedures by Country, North America, 2022 – 2032
|
Figure 6-94: Duodenal Dilation Procedures by Country, Latin America, 2022 – 2032 (1 of 2)
|
Figure 6-95: Duodenal Dilation Procedures by Country, Latin America, 2022 – 2032 (2 of 2)
|
Figure 6-96: Duodenal Dilation Procedures by Country, Western Europe, 2022 – 2032
|
Figure 6-97: Duodenal Dilation Procedures by Country, Central & Eastern Europe, 2022 – 2032 (1 of 2)
|
Figure 6-98: Duodenal Dilation Procedures by Country, Central & Eastern Europe, 2022 – 2032 (2 of 2)
|
Figure 6-99: Duodenal Dilation Procedures by Country, Middle East, 2022 – 2032
|
Figure 6-100: Duodenal Dilation Procedures by Country, Asia-Pacific, 2022 – 2032 (1 of 3)
|
Figure 6-101: Duodenal Dilation Procedures by Country, Asia-Pacific, 2022 – 2032 (2 of 3)
|
Figure 6-102: Duodenal Dilation Procedures by Country, Asia-Pacific, 2022 – 2032 (3 of 3)
|
Figure 6-103: Duodenal Dilation Procedures by Country, Africa, 2022 – 2032
|
Figure 6-104: Colonic Dilation Procedures by Region, Global, 2022 – 2032
|
Figure 6-105: Colonic Dilation Procedures by Country, North America, 2022 – 2032
|
Figure 6-106: Colonic Dilation Procedures by Country, Latin America, 2022 – 2032 (1 of 2)
|
Figure 6-107: Colonic Dilation Procedures by Country, Latin America, 2022 – 2032 (2 of 2)
|
Figure 6-108: Colonic Dilation Procedures by Country, Western Europe, 2022 – 2032
|
Figure 6-109: Colonic Dilation Procedures by Country, Central & Eastern Europe, 2022 – 2032 (1 of 2)
|
Figure 6-110: Colonic Dilation Procedures by Country, Central & Eastern Europe, 2022 – 2032 (2 of 2)
|
Figure 6-111: Colonic Dilation Procedures by Country, Middle East, 2022 – 2032
|
Figure 6-112: Colonic Dilation Procedures by Country, Asia-Pacific, 2022 – 2032 (1 of 3)
|
Figure 6-113: Colonic Dilation Procedures by Country, Asia-Pacific, 2022 – 2032 (2 of 3)
|
Figure 6-114: Colonic Dilation Procedures by Country, Asia-Pacific, 2022 – 2032 (3 of 3)
|
Figure 6-115: Colonic Dilation Procedures by Country, Africa, 2022 – 2032
|
Figure 6-116: Stenting & Dilation Market by Segment, Global, 2022 – 2032 (US$M)
|
Figure 6-117: Stenting & Dilation Market by Region, Global, 2022 – 2032 (US$M)
|
Figure 6-118: Stenting & Dilation Market, Global, 2022 – 2032
|
Figure 6-119: Units Sold by Region, Stenting & Dilation Market, Global, 2022 – 2032
|
Figure 6-120: Average Selling Price by Region, Stenting & Dilation Market, Global, 2022 – 2032 (US$)
|
Figure 6-121: Market Value by Region, Stenting & Dilation Market, Global, 2022 – 2032 (US$M)
|
Figure 6-122: Esophageal Stent Market by Segment, Global, 2022 – 2032 (US$M)
|
Figure 6-123: Total Esophageal Stent Market, Global, 2022 – 2032
|
Figure 6-124: Units Sold by Region, Esophageal Stent Market, Global, 2022 – 2032
|
Figure 6-125: Average Selling Price by Region, Esophageal Stent Market, Global, 2022 – 2032 (US$)
|
Figure 6-126: Market Value by Region, Esophageal Stent Market, Global, 2022 – 2032 (US$M)
|
Figure 6-127: Covered-Metal Esophageal Stent Market, Global, 2022 – 2032
|
Figure 6-128: Units Sold by Region, Covered-Metal Esophageal Stent Market, Global, 2022 – 2032
|
Figure 6-129: Average Selling Price by Region, Covered-Metal Esophageal Stent Market, Global, 2022 – 2032 (US$)
|
Figure 6-130: Market Value by Region, Covered-Metal Esophageal Stent Market, Global, 2022 – 2032 (US$M)
|
Figure 6-131: Bare-Metal Esophageal Stent Market, Global, 2022 – 2032
|
Figure 6-132: Units Sold by Region, Bare-Metal Esophageal Stent Market, Global, 2022 – 2032
|
Figure 6-133: Average Selling Price by Region, Bare-Metal Esophageal Stent Market, Global, 2022 – 2032 (US$)
|
Figure 6-134: Market Value by Region, Bare-Metal Esophageal Stent Market, Global, 2022 – 2032 (US$M)
|
Figure 6-135: Plastic Esophageal Stent Market, Global, 2022 – 2032
|
Figure 6-136: Units Sold by Region, Plastic Esophageal Stent Market, Global, 2022 – 2032
|
Figure 6-137: Average Selling Price by Region, Plastic Esophageal Stent Market, Global, 2022 – 2032 (US$)
|
Figure 6-138: Market Value by Region, Plastic Esophageal Stent Market, Global, 2022 – 2032 (US$M)
|
Figure 6-139: Duodenal Stent Market, Global, 2022 – 2032
|
Figure 6-140: Units Sold by Region, Duodenal Stent Market, Global, 2022 – 2032
|
Figure 6-141: Average Selling Price by Region, Duodenal Stent Market, Global, 2022 – 2032 (US$)
|
Figure 6-142: Market Value by Region, Duodenal Stent Market, Global, 2022 – 2032 (US$M)
|
Figure 6-143: Colonic Stent Market, Global, 2022 – 2032
|
Figure 6-144: Units Sold by Region, Colonic Stent Market, Global, 2022 – 2032
|
Figure 6-145: Average Selling Price by Region, Colonic Stent Market, Global, 2022 – 2032 (US$)
|
Figure 6-146: Market Value by Region, Colonic Stent Market, Global, 2022 – 2032 (US$M)
|
Figure 6-147: Esophageal Dilation Balloon Market, Global, 2022 – 2032
|
Figure 6-148: Units Sold by Region, Esophageal Dilation Balloon Market, Global, 2022 – 2032
|
Figure 6-149: Average Selling Price by Region, Esophageal Dilation Balloon Market, Global, 2022 – 2032 (US$)
|
Figure 6-150: Market Value by Region, Esophageal Dilation Balloon Market, Global, 2022 – 2032 (US$M)
|
Figure 6-151: Duodenal Dilation Balloon Market, Global, 2022 – 2032
|
Figure 6-152: Units Sold by Region, Duodenal Dilation Balloon Market, Global, 2022 – 2032
|
Figure 6-153: Average Selling Price by Region, Duodenal Dilation Balloon Market, Global, 2022 – 2032 (US$)
|
Figure 6-154: Market Value by Region, Duodenal Dilation Balloon Market, Global, 2022 – 2032 (US$M)
|
Figure 6-155: Colonic Dilation Balloon Market, Global, 2022 – 2032
|
Figure 6-156: Units Sold by Region, Colonic Dilation Balloon Market, Global, 2022 – 2032
|
Figure 6-157: Average Selling Price by Region, Colonic Dilation Balloon Market, Global, 2022 – 2032 (US$)
|
Figure 6-158: Market Value by Region, Colonic Dilation Balloon Market, Global, 2022 – 2032 (US$M)
|
Figure 6-159: Leading Competitors, Stenting & Dilation Market, Global, 2025
|
Figure 7-1: Endoscopic Retrograde Cholangiopancreatography Device Procedure Segmentation
|
Figure 7-2: Endoscopic Retrograde Cholangiopancreatography Device Market Segmentation
|
Figure 7-3: Endoscopic Retrograde Cholangiopancreatography Device Regions Covered, Global (1 of 2)
|
Figure 7-4: Endoscopic Retrograde Cholangiopancreatography Device Regions Covered, Global (2 of 2)
|
Figure 7-5: ERCP Procedures by Region, Global, 2022 – 2032
|
Figure 7-6: ERCP Procedures by Country, North America, 2022 – 2032
|
Figure 7-7: ERCP Procedures by Country, Latin America, 2022 – 2032 (1 of 2)
|
Figure 7-8: ERCP Procedures by Country, Latin America, 2022 – 2032 (2 of 2)
|
Figure 7-9: ERCP Procedures by Country, Western Europe, 2022 – 2032
|
Figure 7-10: ERCP Procedures by Country, Central & Eastern Europe, 2022 – 2032 (1 of 2)
|
Figure 7-11: ERCP Procedures by Country, Central & Eastern Europe, 2022 – 2032 (2 of 2)
|
Figure 7-12: ERCP Procedures by Country, Middle East, 2022 – 2032
|
Figure 7-13: ERCP Procedures by Country, Asia-Pacific, 2022 – 2032 (1 of 3)
|
Figure 7-14: ERCP Procedures by Country, Asia-Pacific, 2022 – 2032 (2 of 3)
|
Figure 7-15: ERCP Procedures by Country, Asia-Pacific, 2022 – 2032 (3 of 3)
|
Figure 7-16: ERCP Procedures by Country, Africa, 2022 – 2032
|
Figure 7-17: Endoscopic Retrograde Cholangiopancreatography (ERCP) Device Market by Segment, Global, 2022 – 2032 (US$M)
|
Figure 7-18: Endoscopic Retrograde Cholangiopancreatography (ERCP) Device Market by Region, Global, 2022 – 2032 (US$M)
|
Figure 7-19: Endoscopic Retrograde Cholangiopancreatography (ERCP) Device Market, Global, 2022 – 2032
|
Figure 7-20: Units Sold by Region, Endoscopic Retrograde Cholangiopancreatography (ERCP) Device Market, Global, 2022 – 2032
|
Figure 7-21: Average Selling Price by Region, Endoscopic Retrograde Cholangiopancreatography (ERCP) Device Market, Global, 2022 – 2032 (US$)
|
Figure 7-22: Market Value by Region, Endoscopic Retrograde Cholangiopancreatography (ERCP) Device Market, Global, 2022 – 2032 (US$M)
|
Figure 7-23: Sphincterotome Market, Global, 2022 – 2032
|
Figure 7-24: Units Sold by Region, Sphincterotome Market, Global, 2022 – 2032
|
Figure 7-25: Average Selling Price by Region, Sphincterotome Market, Global, 2022 – 2032 (US$)
|
Figure 7-26: Market Value by Region, Sphincterotome Market, Global, 2022 – 2032 (US$M)
|
Figure 7-27: Biliary Stone Removal Balloon Market, Global, 2022 – 2032
|
Figure 7-28: Units Sold by Region, Biliary Stone Removal Balloon Market, Global, 2022 – 2032
|
Figure 7-29: Average Selling Price by Region, Biliary Stone Removal Balloon Market, Global, 2022 – 2032 (US$)
|
Figure 7-30: Market Value by Region, Biliary Stone Removal Balloon Market, Global, 2022 – 2032 (US$M)
|
Figure 7-31: Biliary Stone Removal Basket Market, Global, 2022 – 2032
|
Figure 7-32: Units Sold by Region, Biliary Stone Removal Basket Market, Global, 2022 – 2032
|
Figure 7-33: Average Selling Price by Region, Biliary Stone Removal Basket Market, Global, 2022 – 2032 (US$)
|
Figure 7-34: Market Value by Region, Biliary Stone Removal Basket Market, Global, 2022 – 2032 (US$M)
|
Figure 7-35: Biliary Dilation Balloon Market, Global, 2022 – 2032
|
Figure 7-36: Units Sold by Region, Biliary Dilation Balloon Market, Global, 2022 – 2032
|
Figure 7-37: Average Selling Price by Region, Biliary Dilation Balloon Market, Global, 2022 – 2032(US$)
|
Figure 7-38: Market Value by Region, Biliary Dilation Balloon Market, Global, 2022 – 2032 (US$M)
|
Figure 7-39: Biliary and Pancreatic Stent Market by Segment, Global, 2022– 2032 (US$M)
|
Figure 7-40: Total Biliary and Pancreatic Stent Market, Global, 2022 – 2032
|
Figure 7-41: Units Sold by Region, Biliary and Pancreatic Stent Market, Global, 2022 – 2032
|
Figure 7-42: Average Selling Price by Region, Biliary and Pancreatic Stent Market, Global, 2022 – 2032 (US$)
|
Figure 7-43: Market Value by Region, Biliary and Pancreatic Stent Market, Global, 2022 – 2032 (US$M)
|
Figure 7-44: Covered-Metal Biliary and Pancreatic Stent Market, Global, 2022 – 2031
|
Figure 7-45: Units Sold by Region, Covered-Metal Biliary and Pancreatic Stent Market, Global, 2022 – 2032
|
Figure 7-46: Average Selling Price by Region, Covered-Metal Biliary and Pancreatic Stent Market, Global, 2022 – 2032 (US$)
|
Figure 7-47: Market Value by Region, Covered-Metal Biliary and Pancreatic Stent Market, Global, 2022 – 2031 (US$M)
|
Figure 7-48: Bare-Metal Biliary and Pancreatic Stent Market, Global, 2022 – 2032
|
Figure 7-49: Units Sold by Region, Bare-Metal Biliary and Pancreatic Stent Market, Global, 2022 – 2032
|
Figure 7-50: Average Selling Price by Region, Bare-Metal Biliary and Pancreatic Stent Market, Global, 2022 – 2032 (US$)
|
Figure 7-51: Market Value by Region, Bare-Metal Biliary and Pancreatic Stent Market, Global, 2022 – 2032 (US$M)
|
Figure 7-52: Plastic Biliary and Pancreatic Stent Market, Global, 2022 – 2032
|
Figure 7-53: Units Sold by Region, Plastic Biliary and Pancreatic Stent Market, Global, 2022 – 2032
|
Figure 7-54: Average Selling Price by Region, Plastic Biliary and Pancreatic Stent Market, Global, 2022 – 2032 (US$)
|
Figure 7-55: Market Value by Region, Plastic Biliary and Pancreatic Stent Market, Global, 2022 – 2032 (US$M)
|
Figure 7-56: Biliary Lithotripter Market, Global, 2022 – 2032
|
Figure 7-57: Units Sold by Region, Biliary Lithotripter Market, Global, 2022 – 2032
|
Figure 7-58: Average Selling Price by Region, Biliary Lithotripter Market, Global, 2022 – 2032 (US$)
|
Figure 7-59: Market Value by Region, Biliary Lithotripter Market, Global, 2022 – 2031 (US$M)
|
Figure 7-60: ERCP Guidewire Market, Global, 2022 – 2032
|
Figure 7-61: Units Sold by Region, ERCP Guidewire Market, Global, 2022 – 2032
|
Figure 7-62: Average Selling Price by Region, ERCP Guidewire Market, Global, 2022 – 2032 (US$)
|
Figure 7-63: Market Value by Region, ERCP Guidewire Market, Global, 2022 – 2032 (US$M)
|
Figure 7-64: ERCP Cannula Market, Global, 2022 – 2032
|
Figure 7-65: Units Sold by Region, ERCP Cannula Market, Global, 2022 – 2032
|
Figure 7-66: Average Selling Price by Region, ERCP Cannula Market, Global, 2022 – 2032 (US$)
|
Figure 7-67: Market Value by Region, ERCP Cannula Market, Global, 2022 – 2032 (US$M)
|
Figure 7-68: Leading Competitors, Endoscopic Retrograde Cholangiopancreatography (ERCP) Device Market, Global, 2025
|
Figure 8-1: Biopsy Forceps & Polypectomy Snares Procedure Segmentation
|
Figure 8-2: Biopsy Forceps & Polypectomy Snares Market Segmentation
|
Figure 8-3: Biopsy Forceps & Polypectomy Snares Regions Covered, Global (1 of 2)
|
Figure 8-4: Biopsy Forceps & Polypectomy Snares Regions Covered, Global (2 of 2)
|
Figure 8-5: Tissue Biopsy Procedures by Segment, Global, 2022 – 2032
|
Figure 8-6: Tissue Biopsy Procedures by Region, Global, 2022 – 2032
|
Figure 8-7: Tissue Biopsy Procedures by Country, North America, 2022 – 2032
|
Figure 8-8: Tissue Biopsy Procedures by Country, Latin America, 2022 – 2032 (1 of 2)
|
Figure 8-9: Tissue Biopsy Procedures by Country, Latin America, 2022 – 2032 (2 of 2)
|
Figure 8-10: Tissue Biopsy Procedures by Country, Western Europe, 2022 – 2032
|
Figure 8-11: Tissue Biopsy Procedures by Country, Central & Eastern Europe, 2022 – 2032 (1 of 2)
|
Figure 8-12: Tissue Biopsy Procedures by Country, Central & Eastern Europe, 2022 – 2032 (2 of 2)
|
Figure 8-13: Tissue Biopsy Procedures by Country, Middle East, 2022 – 2032
|
Figure 8-14: Tissue Biopsy Procedures by Country, Asia-Pacific, 2022 – 2032 (1 of 3)
|
Figure 8-15: Tissue Biopsy Procedures by Country, Asia-Pacific, 2022 – 2032 (2 of 3)
|
Figure 8-16: Tissue Biopsy Procedures by Country, Asia-Pacific, 2022 – 2032 (3 of 3)
|
Figure 8-17: Tissue Biopsy Procedures by Country, Africa, 2022 – 2032
|
Figure 8-18: Biopsy Forceps Procedures by Region, Global, 2022 – 2032
|
Figure 8-19: Biopsy Forceps Procedures by Country, North America, 2022 – 2032
|
Figure 8-20: Biopsy Forceps Procedures by Country, Latin America, 2022 – 2032 (1 of 2)
|
Figure 8-21: Biopsy Forceps Procedures by Country, Latin America, 2022 – 2032 (2 of 2)
|
Figure 8-22: Biopsy Forceps Procedures by Country, Western Europe, 2022 – 2032
|
Figure 8-23: Biopsy Forceps Procedures by Country, Central & Eastern Europe, 2022 – 2032 (1 of 2)
|
Figure 8-24: Biopsy Forceps Procedures by Country, Central & Eastern Europe, 2022 – 2032 (2 of 2)
|
Figure 8-25: Biopsy Forceps Procedures by Country, Middle East, 2022 – 2032
|
Figure 8-26: Biopsy Forceps Procedures by Country, Asia-Pacific, 2022 – 2032 (1 of 3)
|
Figure 8-27: Biopsy Forceps Procedures by Country, Asia-Pacific, 2022 – 2032 (2 of 3)
|
Figure 8-28: Biopsy Forceps Procedures by Country, Asia-Pacific, 2022 – 2032 (3 of 3)
|
Figure 8-29: Biopsy Forceps Procedures by Country, Africa, 2022 – 2032
|
Figure 8-30: Polypectomy Snare Procedures by Region, Global, 2022 – 2032
|
Figure 8-31: Polypectomy Snare Procedures by Country, North America, 2022 – 2032
|
Figure 8-32: Polypectomy Snare Procedures by Country, Latin America, 2022 – 2032 (1 of 2)
|
Figure 8-33: Polypectomy Snare Procedures by Country, Latin America, 2022 – 2032 (2 of 2)
|
Figure 8-34: Polypectomy Snare Procedures by Country, Western Europe, 2022 – 2032
|
Figure 8-35: Polypectomy Snare Procedures by Country, Central & Eastern Europe, 2022 – 2032 (1 of 2)
|
Figure 8-36: Polypectomy Snare Procedures by Country, Central & Eastern Europe, 2022 – 2032 (2 of 2)
|
Figure 8-37: Polypectomy Snare Procedures by Country, Middle East, 2022 – 2032
|
Figure 8-38: Polypectomy Snare Procedures by Country, Asia-Pacific, 2022 – 2032 (1 of 3)
|
Figure 8-39: Polypectomy Snare Procedures by Country, Asia-Pacific, 2022 – 2032 (2 of 3)
|
Figure 8-40: Polypectomy Snare Procedures by Country, Asia-Pacific, 2022 – 2032 (3 of 3)
|
Figure 8-41: Polypectomy Snare Procedures by Country, Africa, 2022 – 2032
|
Figure 8-42: Biopsy Forceps & Polypectomy Snares Market by Segment, Global, 2022 – 2032 (US$M)
|
Figure 8-43: Biopsy Forceps and Polypectomy Snares Market by Region, Global, 2022 – 2032 (US$M)
|
Figure 8-44: Biopsy Forceps and Polypectomy Snares Market, Global, 2022 – 2032
|
Figure 8-45: Units Sold by Region, Biopsy Forceps and Polypectomy Snares Market, Global, 2022 – 2032
|
Figure 8-46: Average Selling Price by Region, Biopsy Forceps and Polypectomy Snares Market, Global, 2022 – 2032 (US$)
|
Figure 8-47: Market Value by Region, Biopsy Forceps and Polypectomy Snares Market, Global, 2022 – 2032 (US$M)
|
Figure 8-48: Biopsy Forceps Market, Global, 2022 – 2032
|
Figure 8-49: Units Sold by Region, Biopsy Forceps Market, Global, 2022 – 2032
|
Figure 8-50: Average Selling Price by Region, Biopsy Forceps Market, Global, 2022 – 2032 (US$)
|
Figure 8-51: Market Value by Region, Biopsy Forceps Market, Global, 2022 – 2032 (US$M)
|
Figure 8-52: Polypectomy Snare Market, Global, 2022 – 2032
|
Figure 8-53: Units Sold by Region, Polypectomy Snare Market, Global, 2022 – 2032
|
Figure 8-54: Average Selling Price by Region, Polypectomy Snare Market, Global, 2022 – 2032 (US$)
|
Figure 8-55: Market Value by Region, Polypectomy Snare Market, Global, 2022 – 2032 (US$M)
|
Figure 8-56: Leading Competitors, Biopsy Forceps & Polypectomy Snares Market, Global, 2025
|
Figure 9-1: EUS Needle Procedure Segmentation
|
Figure 9-2: EUS Needle Market Segmentation
|
Figure 9-3: EUS Needle Regions Covered, Global (1 of 2)
|
Figure 9-4: EUS Needle Regions Covered, Global (2 of 2)
|
Figure 9-5: EUS Needles Procedures by Region, Global, 2022 – 2032
|
Figure 9-6: EUS Needles Procedures by Country, North America, 2022 – 2032
|
Figure 9-7: EUS Needles Procedures by Country, Latin America, 2022 – 2032 (1 of 2)
|
Figure 9-8: EUS Needles Procedures by Country, Latin America, 2022 – 2032 (2 of 2)
|
Figure 9-9: EUS Needles Procedures by Country, Western Europe, 2022 – 2032
|
Figure 9-10: EUS Needles Procedures by Country, Central & Eastern Europe, 2022 – 2032 (1 of 2)
|
Figure 9-11: EUS Needles Procedures by Country, Central & Eastern Europe, 2022– 2032 (2 of 2)
|
Figure 9-12: EUS Needles Procedures by Country, Middle East, 2022 – 2032
|
Figure 9-13: EUS Needles Procedures by Country, Asia-Pacific, 2022 – 2032 (1 of 3)
|
Figure 9-14: EUS Needles Procedures by Country, Asia-Pacific, 2022 – 2032 (2 of 3)
|
Figure 9-15: EUS Needles Procedures by Country, Asia-Pacific, 2022 – 2032 (3 of 3)
|
Figure 9-16: EUS Needles Procedures by Country, Africa, 2022 – 2032
|
Figure 9-17: EUS Needle Market by Segment, Global, 2022 – 2032 (US$M)
|
Figure 9-18: EUS Needle Market by Segment by Region, Global, 2022 – 2032 (US$M)
|
Figure 9-19: Total EUS Needle Market, Global, 2022 – 2032
|
Figure 9-20: Units Sold by Region, EUS Needle Market, Global, 2022 – 2032
|
Figure 9-21: Average Selling Price by Region, EUS Needle Market, Global, 2022 – 2032 (US$)
|
Figure 9-22: Market Value by Region, EUS Needle Market, Global, 2012 – 2032 (US$M)
|
Figure 9-23: Fine Needle Aspiration Market, Global., 2022 – 2032
|
Figure 9-24: Units Sold by Region, Fine Needle Aspiration Market, Global, 2022 – 2032
|
Figure 9-25: Average Selling Price by Region, Fine Needle Aspiration Market, Global, 2022 – 2032 (US$)
|
Figure 9-26: Market Value by Region, Fine Needle Aspiration Market, Global, 2022 – 2032 (US$M)
|
Figure 9-27: Fine Needle Biopsy Market, Global., 2022 – 2032
|
Figure 9-28: Units Sold by Region, Fine Needle Biopsy Market, Global, 2022 – 2032
|
Figure 9-29: Average Selling Price by Region, Fine Needle Biopsy Market, Global, 2022 – 2032 (US$)
|
Figure 9-30: Market Value by Region, Fine Needle Biopsy Market, Global, 2022 – 2032 (US$M)
|
Figure 9-31: Leading Competitors, EUS Needle Market, Global, 2025
|
Figure 10-1: Endoscopic Submucosal Dissection Knife Regions Covered, Global (1 of 2)
|
Figure 10-2: Endoscopic Submucosal Dissection Knife Regions Covered, Global (2 of 2)
|
Figure 10-3: Endoscopic Submucosal Dissection Knife Market, Global, 2022 – 2032
|
Figure 10-4: Units Sold by Region, Endoscopic Submucosal Dissection Knife Market, Global, 2022 – 2032
|
Figure 10-5: Average Selling Price by Region, Endoscopic Submucosal Dissection Knife Market, Global, 2022 – 2032 (US$)
|
Figure 10-6: Market Value by Region, Endoscopic Submucosal Dissection Knife Market, Global, 2022 – 2032 (US$M)
|
Figure 10-7: Leading Competitors, Endoscopic Submucosal Dissection Knife Market, Global, 2025
|
Figure 11-1: Hemostasis Device Procedure Segmentation
|
Figure 11-2: Hemostasis Device Market Segmentation
|
Figure 11-3: Hemostasis Device Regions Covered, Global (1 of 2)
|
Figure 11-4: Hemostasis Device Regions Covered, Global (2 of 2)
|
Figure 11-5: Hemostasis Procedures by Region, Global, 2022 – 2032
|
Figure 11-6: Hemostasis Procedures by Country, North America, 2022 – 2032
|
Figure 11-7: Hemostasis Procedures by Country, Latin America, 2022 – 2032 (1 of 2)
|
Figure 11-8: Hemostasis Procedures by Country, Latin America, 2022 – 2032 (2 of 2)
|
Figure 11-9: Hemostasis Procedures by Country, Western Europe, 2022 – 2032
|
Figure 11-10: Hemostasis Procedures by Country, Central & Eastern Europe, 2022 – 2032 (1 of 2)
|
Figure 11-11: Hemostasis Procedures by Country, Central & Eastern Europe, 2022 – 2032 (2 of 2)
|
Figure 11-12: Hemostasis Procedures by Country, Middle East, 2022 – 2032
|
Figure 11-13: Hemostasis Procedures by Country, Asia-Pacific, 2022 – 2032 (1 of 3)
|
Figure 11-14: Hemostasis Procedures by Country, Asia-Pacific, 2022 – 2032 (2 of 3)
|
Figure 11-15: Hemostasis Procedures by Country, Asia-Pacific, 2022 – 2032 (3 of 3)
|
Figure 11-16: Hemostasis Procedures by Country, Africa, 2022 – 2032
|
Figure 11-17: Hemostasis Device Market by Segment, Global, 2022 – 2032 (US$M)
|
Figure 11-18: Hemostasis Device Market by Region, Global, 2022 – 2032 (US$M)
|
Figure 11-19: Hemostasis Probe Market by Segment, Global, 2022 – 2031 (US$M)
|
Figure 11-20: Total Hemostasis Probe Market, Global, 2022 – 2032
|
Figure 11-21: Units Sold by Region, Hemostasis Probe Market, Global, 2022 – 2032
|
Figure 11-22: Average Selling Price by Region, Hemostasis Probe Market, Global, 2022 – 2032 (US$)
|
Figure 11-23: Market Value by Region, Hemostasis Probe Market, Global, 2022 – 2032 (US$M)
|
Figure 11-24: Electrosurgical Probe Market, Global, 2022 – 2032
|
Figure 11-25: Units Sold by Region, Electrosurgical Probe Market, Global, 2022 – 2032
|
Figure 11-26: Average Selling Price by Region, Electrosurgical Probe Market, Global, 2022 – 2032 (US$)
|
Figure 11-27: Market Value by Region, Electrosurgical Probe Market, Global, 2022 – 2032 (US$M)
|
Figure 11-28: Heat Probe Market, Global, 2022 – 2032
|
Figure 11-29: Units Sold by Region, Heat Probe Market, Global, 2022– 2032
|
Figure 11-30: Average Selling Price by Region, Heat Probe Market, Global, 2022 – 2032 (US$)
|
Figure 11-31: Market Value by Region, Heat Probe Market, Global, 2022 – 2032 (US$M)
|
Figure 11-32: Argon Probe Market, Global, 2022 – 2032
|
Figure 11-33: Units Sold by Region, Argon Probe Market, Global, 2022 – 2032
|
Figure 11-34: Average Selling Price by Region, Argon Probe Market, Global, 2022 – 2032 (US$)
|
Figure 11-35: Market Value by Region, Argon Probe Market, Global, 2022 – 2032 (US$M)
|
Figure 11-36: Ligation Device Market by Segment, Global, 2022 – 2032 (US$M)
|
Figure 11-37: Total Ligation Device Market, Global, 2022 – 2032
|
Figure 11-38: Units Sold by Region, Ligation Device Market, Global, 2022 – 2032
|
Figure 11-39: Average Selling Price by Region, Ligation Device Market, Global, 2022 – 2032 (US$)
|
Figure 11-40: Market Value by Region, Ligation Device Market, Global, 2022 – 2032 (US$M)
|
Figure 11-41: Ligation Band Market, Global, 2022 – 2032
|
Figure 11-42: Units Sold by Region, Ligation Band Market, Global, 2022 – 2032
|
Figure 11-43: Average Selling Price by Region, Ligation Band Market, Global, 2022 – 2032 (US$)
|
Figure 11-44: Market Value by Region, Ligation Band Market, Global, 2022 – 2032 (US$M)
|
Figure 11-45: Ligation Clip Market, Global, 2022 – 2032
|
Figure 11-46: Units Sold by Region, Ligation Clip Market, Global, 2022 – 2032
|
Figure 11-47: Average Selling Price by Region, Ligation Clip Market, Global, 2022 – 2032 (US$)
|
Figure 11-48: Market Value by Region, Ligation Clip Market, Global, 2022 – 2032 (US$M)
|
Figure 11-49: Sclerotherapy Needle Market, Global, 2022 – 2032
|
Figure 11-50: Units Sold by Region, Sclerotherapy Needle Market, Global, 2022 – 2032
|
Figure 11-51: Average Selling Price by Region, Sclerotherapy Needle Market, Global, 2022 – 2032 (US$)
|
Figure 11-52: Market Value by Region, Sclerotherapy Needle Market, Global, 2022 – 2032 (US$M)
|
Figure 11-53: Hemostasis Powder Market, Global, 2022 – 2032
|
Figure 11-54: Units Sold by Region, Hemostasis Powder Market, Global, 2022 – 2032
|
Figure 11-55: Average Selling Price by Region, Hemostasis Powder Market, Global, 2022 – 2032 (US$)
|
Figure 11-56: Market Value by Region, Hemostasis Powder Market, Global, 2022 – 2032 (US$M)
|
Figure 11-57: Leading Competitors, Hemostasis Device Market, Global, 2025
|
Figure 12-1: Enteral Feeding Device Procedure Segmentation
|
Figure 12-2: Enteral Feeding Device Market Segmentation
|
Figure 12-3: Enteral Feeding Device Regions Covered, Global (1 of 2)
|
Figure 12-4: Enteral Feeding Device Regions Covered, Global (2 of 2)
|
Figure 12-5: Enteral Feeding Device Placement Procedures by Region, Global, 2022 – 2032
|
Figure 12-6: Enteral Feeding Device Placement Procedures by Country, North America, 2022 – 2032
|
Figure 12-7: Enteral Feeding Device Placement Procedures by Country, Latin America, 2022 – 2032 (1 of 2)
|
Figure 12-8: Enteral Feeding Device Placement Procedures by Country, Latin America, 2022 – 2032 (2 of 2)
|
Figure 12-9: Enteral Feeding Device Placement Procedures by Country, Western Europe, 2022 – 2032
|
Figure 12-10: Enteral Feeding Device Placement Procedures by Country, Central & Eastern Europe, 2022 – 2032 (1 of 2)
|
Figure 12-11: Enteral Feeding Device Placement Procedures by Country, Central & Eastern Europe, 2022 – 2032 (2 of 2)
|
Figure 12-12: Enteral Feeding Device Placement Procedures by Country, Middle East, 2022 – 2032
|
Figure 12-13: Enteral Feeding Device Placement Procedures by Country, Asia-Pacific, 2022 – 2032 (1 of 3)
|
Figure 12-14: Enteral Feeding Device Placement Procedures by Country, Asia-Pacific, 2022 – 2032 (2 of 3)
|
Figure 12-15: Enteral Feeding Device Placement Procedures by Country, Asia-Pacific, 2022 – 2032 (3 of 3)
|
Figure 12-16: Enteral Feeding Device Placement Procedures by Country, Africa, 2022 – 2032
|
Figure 12-17: Enteral Feeding Device Market by Segment, Global, 2022 – 2032 (US$M)
|
Figure 12-18: Enteral Feeding Device Market by Region, Global, 2022 – 2032 (US$M)
|
Figure 12-19: Enteral Feeding Tube Market by Segment, Global, 2022 – 2032 (US$M)
|
Figure 12-20: Total Enteral Feeding Tube Market, Global, 2022 – 2032
|
Figure 12-21: Units Sold by Region, Enteral Feeding Tube Market, Global, 2022 – 2032
|
Figure 12-22: Average Selling Price by Region, Enteral Feeding Tube Market, Global, 2022 – 2032 (US$)
|
Figure 12-23: Market Value by Region, Enteral Feeding Tube Market, Global, 2022 – 2032 (US$M)
|
Figure 12-24: PEG Tube Market, Global, 2022 – 2032
|
Figure 12-25: Units Sold by Region, PEG Tube Market, Global, 2022 – 2032
|
Figure 12-26: Average Selling Price by Region, PEG Tube Market, Global, 2022 – 2032 (US$)
|
Figure 12-27: Market Value by Region, PEG Tube Market, Global, 2022 – 2032 (US$M)
|
Figure 12-28: NG/NJ Tube Market, Global, 2022 – 2032
|
Figure 12-29: Units Sold by Region, NG/NJ Tube Market, Global, 2022 – 2032
|
Figure 12-30: Average Selling Price by Region, NG/NJ Tube Market, Global, 2022 – 2032 (US$)
|
Figure 12-31: Market Value by Region, NG/NJ Tube Market, Global, 2022 – 2032 (US$M)
|
Figure 12-32: PEG-J Tube Market, Global, 2022 – 2032
|
Figure 12-33: Units Sold by Region, PEG-J Tube Market, Global, 2022 – 2032
|
Figure 12-34: Average Selling Price by Region, PEG-J Tube Market, Global, 2022 – 2032 (US$)
|
Figure 12-35: Market Value by Region, PEG-J Tube Market, Global, 2022 – 2032 (US$M)
|
Figure 12-36: Enteral Feeding Pump Market, Global, 2022 – 2032
|
Figure 12-37: Units Sold by Region, Enteral Feeding Pump Market, Global, 2022 – 2032
|
Figure 12-38: Average Selling Price by Region, Enteral Feeding Pump Market, Global, 2022 – 2032 (US$)
|
Figure 12-39: Market Value by Region, Enteral Feeding Pump Market, Global, 2022 – 2032 (US$M)
|
Figure 12-40: Enteral Feeding Set Market, Global, 2022 – 2032
|
Figure 12-41: Units Sold by Region, Enteral Feeding Set Market, Global, 2022 – 2032
|
Figure 12-42: Average Selling Price by Region, Enteral Feeding Set Market, Global, 2022 – 2032 (US$)
|
Figure 12-43: Market Value by Region, Enteral Feeding Set Market, Global, 2022 – 2032 (US$M)
|
Figure 12-44: Leading Competitors, Enteral Feeding Device Market, Global, 2025
|
Figure 13-1: Anti-Reflux Device Procedure Segmentation
|
Figure 13-2: Anti-Reflux Device Regions Covered, Global (1 of 2)
|
Figure 13-3: Anti-Reflux Device Regions Covered, Global (2 of 2)
|
Figure 13-4: Anti-Reflux Device Implants Procedures by Region, Global, 2022 – 2032
|
Figure 13-5: Anti-Reflux Device Implants Procedures by Country, North America, 2022 – 2032
|
Figure 13-6: Anti-Reflux Device Implants Procedures by Country, Latin America, 2022 – 2032 (1 of 2)
|
Figure 13-7: Anti-Reflux Device Implants Procedures by Country, Latin America, 2022 – 2032 (2 of 2)
|
Figure 13-8: Anti-Reflux Device Implants Procedures by Country, Western Europe, 2022 – 2032
|
Figure 13-9: Anti-Reflux Device Implants Procedures by Country, Central & Eastern Europe, 2022 – 2032 (1 of 2)
|
Figure 13-10: Anti-Reflux Device Implants Procedures by Country, Central & Eastern Europe, 2022 – 2032 (2 of 2)
|
Figure 13-11: Anti-Reflux Device Implants Procedures by Country, Middle East, 2022 – 2032
|
Figure 13-12: Anti-Reflux Device Implants Procedures by Country, Asia-Pacific, 2022 – 2032 (1 of 3)
|
Figure 13-13: Anti-Reflux Device Implants Procedures by Country, Asia-Pacific, 2022 – 2032 (2 of 3)
|
Figure 13-14: Anti-Reflux Device Implants Procedures by Country, Asia-Pacific, 2022 – 2032 (3 of 3)
|
Figure 13-15: Anti-Reflux Device Implants Procedures by Country, Africa, 2022 – 2032
|
Figure 13-16: Anti-Reflux Device Market, Global, 2022 – 2032
|
Figure 13-17: Anti-Reflux Device Market by Region, Global, 2022 – 2032
|
Figure 13-18: Units Sold by Region, Anti-Reflux Device Market, Global, 2022 – 2032
|
Figure 13-19: Average Selling Price by Region, Anti-Reflux Device Market, Global, 2022 – 2032 (US$)
|
Figure 13-20: Market Value by Region, Anti-Reflux Device Market, Global, 2022 – 2032 (US$M)
|
Figure 13-21: Leading Competitors, Anti-Reflux Device Market, Global, 2025
|