Dental Prosthetics Market Size, Share & Trends Analysis | Australia | 2024-2030 | MedCore | Includes: Crowns, Bridges, Dentures & Dental CAD/CAM Prosthetics and 3 more

  • Year: 2024
  • Scope: 10 Years
  • Region: Australia
  • Pages: 98
  • Published Date: 12/20/2023
  • Type: MedCore

Product Description

Overall, the Australian dental prosthetics market was valued at nearly $0.8 million in 2023. This is expected to increase over the forecast period at a CAGR of 3.9% to reach over $1.0 billion.

The full report suite on the Australian market for dental prosthetics includes crowns and bridges, dentures, denture teeth, CAD/CAM prosthetics, inlays and onlays and veneers.

MARKET REPORT DATA TYPES INCLUDED

  • Unit Sales, Average Selling PricesMarket Size & Growth Trends
  • COVID-19 Impact Analysis
  • Market Drivers & Limiters
  • Market Forecasts Until 2030, and Historical Data to 2020
  • Recent Mergers & Acquisitions
  • Company Profiles and Product Portfolios
  • Leading Competitors

AUSTRALIA DENTAL PROSTHETICS MARKET TRENDS

australia dental prosthetics market

Research Scope Summary

Report AttributeDetails
 Region Australia
 Base Year 2023
 Forecast 2024-2030
 Historical Data 2020-2022
 Quantitative Coverage Market Size, Market Shares, Market Forecasts, Market Growth Rates, Units Sold, and Average Selling Prices.
 Qualitative Coverage COVID19 Impact, Market Growth Trends, Market Limiters, Product Portfolios, Disruptive Technologies, Disease Overviews.
 Data Sources Primary Interviews with Industry Leaders, Government Physician Data, Regulatory Data, Hospital Private Data, Import & Export Data, iData Research Internal Database.


FREE Sample Report

Australia Dental ProstheticS Market
6.1 Executive Summary
6.1.1 Australia Dental Prosthetics Market Overview
6.1.2 Competitive Analysis
6.1.3 Market Trends
6.1.4 Markets Included
6.2 Introduction
6.3 Currency Exchange Rate
6.4 Market Overview
6.5 Market Analysis and Forecast
6.5.1 Crown and Bridge Market
6.5.1.1 Total Crown and Bridge Market by Prosthetic Type
6.5.1.1.1 Crown Market
6.5.1.1.2 Bridge Market
6.5.1.2 Full-Cast Crown and Bridge Market by Prosthetic Type
6.5.1.2.1 Full-Cast Crown Market
6.5.1.2.2 Full-Cast Bridge Market
6.5.1.3 PFM Crown and Bridge Market
6.5.1.3.1 Non-Precious PFM Crown and Bridge Market by Prosthetic Type
6.5.1.3.2 Semi-Precious PFM Crown and Bridge Market by Prosthetic Type
6.5.1.3.3 Precious PFM Crown and Bridge Market by Prosthetic Type
6.5.1.4 Ceramic Crown and Bridge Market
6.5.1.4.1 Zirconia Crown and Bridge Market by Prosthetic Type
6.5.1.4.2 Other Ceramic Crown and Bridge Market by Prosthetic Type
6.5.2 Denture Market
6.5.2.1 Total Denture Market
6.5.2.2 Full Denture Market
6.5.2.3 Partial Denture Market
6.5.3 Denture Teeth Market
6.5.4 CAD/CAM Prosthetics Market
6.5.4.1 Total CAD/CAM Prosthetics Market
6.5.4.2 CAD/CAM Crown and Bridge Market
6.5.4.3 CAD/CAM Inlay and Onlay Market
6.5.4.4 CAD/CAM Veneer Market
6.5.4.5 CAD/CAM Denture Market
6.5.4.6 Unit Analysis
6.5.5 Inlay and Onlay Market
6.5.5.1 Total Inlay and Onlay Market by Material
6.5.5.2 Gold Inlay and Onlay Market
6.5.5.3 Zirconia Inlay and Onlay Market
6.5.5.4 Other Ceramic Inlay and Onlay Market
6.5.5.5 Composite Resin Inlay and Onlay Market
6.5.6 Veneer Market by Material
6.5.6.1 Porcelain/Ceramic Veneer Market by Material
6.5.6.1.1 Lithium Disilicate Veneer Market
6.5.6.1.2 Porcelain Veneer Market
6.5.6.2 Composite Resin Veneer Market
6.5.6.3 Zirconia Veneer Market
6.6 Drivers and Limiters
6.6.1 Market Drivers
6.6.2 Market Limiters
Chart 6‑1: Dental Prosthetic Market Overview, Australia, 2023 & 2030
Chart 6‑2: Dental Prosthetics Market by Segment, Australia, 2020 – 2030
Figure 6‑1: Factors Impacting the Dental Prosthetics Market by Segment, Australia
Figure 6‑2: Dental Prosthetics Markets Covered (1 of 2)
Figure 6‑3: Dental Prosthetics Markets Covered (2 of 2)
Figure 6‑4: Currency Exchange Rate, 2023
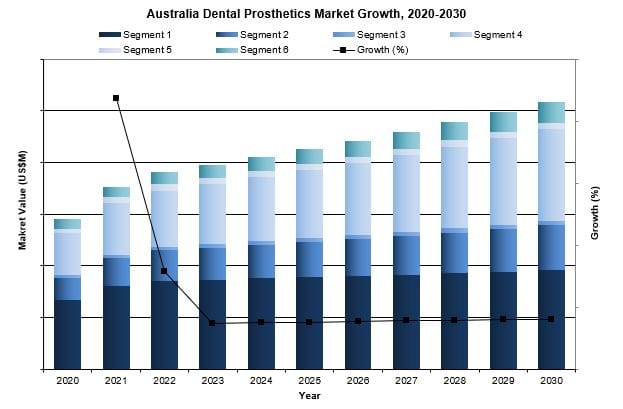
Figure 6‑5: Dental Prosthetics Market by Segment, Australia, 2020 – 2030 (US$M)
Figure 6‑6: Dental Prosthetics Market by Segment, Australia, 2020 – 2030 (AUS$M)
Figure 6‑7: Total Crown and Bridge Market, Australia, 2020 – 2030
Figure 6‑8: Total Crown and Bridge Market by Prosthetic Type, Australia, 2020 – 2030 (US$M)
Figure 6‑9: Total Crown and Bridge Market by Prosthetic Type, Australia, 2020 – 2030 (AUS$M)
Figure 6‑10: Crown Market, Australia, 2020 – 2030
Figure 6‑11: Bridge Market, Australia, 2020 – 2030
Figure 6‑12: Full-Cast Crown and Bridge Market by Prosthetic Type, Australia, 2020 – 2030 (US$M)
Figure 6‑13: Full-Cast Crown and Bridge Market by Prosthetic Type, Australia, 2020 – 2030 (AUS$M)
Figure 6‑14: Full-Cast Crown Market, Australia, 2020 – 2030
Figure 6‑15: Full-Cast Bridge Market, Australia, 2020 – 2030
Figure 6‑16: Total PFM Crown and Bridge Market, Australia, 2020 – 2030
Figure 6‑17: Non-Precious PFM Crown and Bridge Market by Prosthetic Type, Australia,  2020 – 2030 (US$M)
Figure 6‑18: Non-Precious PFM Crown and Bridge Market by Prosthetic Type, Australia, 2020 – 2030 (AUS$M)
Figure 6‑19: Non-Precious PFM Crown Market, Australia, 2020 – 2030
Figure 6‑20: Non-Precious PFM Bridge Market, Australia, 2020 – 2030
Figure 6‑21: Semi-Precious PFM Crown and Bridge Market by Prosthetic Type, Australia,  2020 – 2030 (US$M)
Figure 6‑22: Semi-Precious PFM Crown and Bridge Market by Prosthetic Type, Australia,  2020 – 2030 (AUS$M)
Figure 6‑23: Semi-Precious PFM Crown Market, Australia, 2020 – 2030
Figure 6‑24: Semi-Precious PFM Bridge Market, Australia, 2020 – 2030
Figure 6‑25: Precious PFM Crown and Bridge Market by Prosthetic Type, Australia,  2020 – 2030 (US$M)
Figure 6‑26: Precious PFM Crown and Bridge Market by Prosthetic Type, Australia,  2020 – 2030 (AUS$M)
Figure 6‑27: Precious PFM Crown Market, Australia, 2020 – 2030
Figure 6‑28: Precious PFM Bridge Market, Australia, 2020 – 2030
Figure 6‑29: Total Ceramic Crown and Bridge Market, Australia, 2020 – 2030
Figure 6‑30: Zirconia Crown and Bridge Market by Prosthetic Type, Australia, 2020 – 2030 (US$M)
Figure 6‑31: Zirconia Crown and Bridge Market by Prosthetic Type, Australia, 2020 – 2030 (AUS$M)
Figure 6‑32: Zirconia Crown Market, Australia, 2020 – 2030
Figure 6‑33: Zirconia Bridge Market, Australia, 2020 – 2030
Figure 6‑34: Other Ceramic Crown and Bridge Market by Prosthetic Type, Australia, 2020 – 2030 (US$M)
Figure 6‑35: Other Ceramic Crown and Bridge Market by Prosthetic Type, Australia, 2020 – 2030 (AUS$M)
Figure 6‑36: Other Ceramic Crown Market, Australia, 2020 – 2030
Figure 6‑37: Other Ceramic Bridge Market, Australia, 2020 – 2030
Figure 6‑38: Total Denture Market, Australia, 2020 – 2030
Figure 6‑39: Total Denture Market by Prosthetic Type, Australia, 2020 – 2030 (US$M)
Figure 6‑40: Total Denture Market by Prosthetic Type, Australia, 2020 – 2030 (AUS$M)
Figure 6‑41: Full Denture Market, Australia, 2020 – 2030
Figure 6‑42: Partial Denture Market, Australia, 2020 – 2030
Figure 6‑43: Total Denture Teeth Market, Australia, 2020 – 2030
Figure 6‑44: Total CAD/CAM Prosthetics Market, Australia, 2020 – 2030
Figure 6‑45: Total Crown and Bridge Market by Prosthetic Type, Australia, 2020 – 2030 (US$M)
Figure 6‑46: Total Crown and Bridge Market by Prosthetic Type, Australia, 2020 – 2030 (AUS$M)
Figure 6‑47: CAD/CAM Crown and Bridge Market, Australia, 2020 – 2030
Figure 6‑48: CAD/CAM Inlay and Onlay Market, Australia, 2020 – 2030
Figure 6‑49: CAD/CAM Veneer Market, Australia, 2020 – 2030
Figure 6‑50: CAD/CAM Denture Market, Australia, 2020 – 2030
Figure 6‑51: CAD/CAM Prosthetic Units Sold by Setting, Australia, 2020 – 2030
Figure 6‑52: Total Inlay and Onlay Market, Australia, 2020 – 2030
Figure 6‑53: Total Inlay and Onlay Market by Prosthetic Type, Australia, 2020 – 2030 (US$M)
Figure 6‑54: Total Inlay and Onlay Market by Prosthetic Type, Australia, 2020 – 2030 (AUS$M)
Figure 6‑55: Gold Inlay and Onlay Market, Australia, 2020 – 2030
Figure 6‑56: Zirconia Inlay and Onlay Market, Australia, 2020 – 2030
Figure 6‑57: Other Ceramic Inlay and Onlay Market, Australia, 2020 – 2030
Figure 6‑58: Composite Resin Inlay and Onlay Market, Australia, 2020 – 2030
Figure 6‑59: Total Veneer Market, Australia, 2020 – 2030
Figure 6‑60: Veneer Market by Material, Australia, 2020 – 2030 (US$M)
Figure 6‑61: Veneer Market by Material, Australia, 2020 – 2030 (AUS$M)
Figure 6‑62: Porcelain/Ceramic Veneer Market by Material, Australia, 2020 – 2030 (US$M)
Figure 6‑63: Porcelain/Ceramic Veneer Market by Material, Australia, 2020 – 2030 (AUS$M)
Figure 6‑64: Lithium Disilicate Veneer Market, Australia, 2020 – 2030
Figure 6‑65: Porcelain Veneer Market, Australia, 2020 – 2030
Figure 6‑66: Composite Resin Veneer Market, Australia, 2020 – 2030
Figure 6‑67: Zirconia Veneer Market, Australia, 2020 – 2030

iData’s 9-Step Research Methodology

Our reports follow an in-depth 9-step methodology which focuses on the following research systems:

  • Original primary research that consists of the most up-to-date market data
  • Strong foundation of quantitative and qualitative research
  • Focused on the needs and strategic challenges of the industry participants

Step 1: Project Initiation & Team Selection During this preliminary investigation, all staff members involved in the industry discusses the topic in detail.

Step 2: Prepare Data Systems and Perform Secondary Research The first task of the research team is to prepare for the data collection process: Filing systems and relational databases are developed as needed.

Step 3: Preparation for Interviews & Questionnaire Design The core of all iData research reports is primary market research. Interviews with industry insiders represent the single most reliable way to obtain accurate, current data about market conditions, trends, threats and opportunities.

Step 4: Performing Primary Research At this stage, interviews are performed using contacts and information acquired in the secondary research phase.

Step 5: Research Analysis: Establishing Baseline Estimates Following the completion of the primary research phase, the collected information must be synthesized into an accurate view of the market status. The most important question is the current state of the market.

Step 6: Market Forecast and Analysis iData Research uses a proprietary method to combine statistical data and opinions of industry experts to forecast future market values.

Step 7: Identify Strategic Opportunities iData analysts identify in broad terms why some companies are gaining or losing share within a given market segment.

Step 8: Final Review and Market Release An integral part of the iData research methodology is a built-in philosophy of quality control and continuing improvement is integral to the iData philosophy.

Step 9: Customer Feedback and Market Monitoring iData philosophy of continuous improvement requires that reports and consulting projects be monitored after release for customer feedback and market accuracy.

Click Here to Read More About Our Methodology

Explore Options

Report Summary

FREE

Select License Type

Overall, the Australian dental prosthetics market was valued at nearly $0.8 million in 2023. This is expected to increase over the forecast period at a CAGR of 3.9% to reach over $1.0 billion.

  • 2024
  • 10 Years
  • Australia
  • 98
  • MedCore
  • 12/20/2023
0
    0
    Your Cart
    Your cart is emptyReturn to Report Library