| Figure 1‑1: Overdenture and Implant Bridge Market Share Ranking by Segment, Europe, 2024 |
| Figure 1‑2: Companies Researched in This Report |
| Figure 1‑3: Factors Impacting the Overdenture and Implant Bridge Market by Segment, Europe |
| Figure 1‑4: Recent Events in the Overdenture and Implant Bridge Market, Europe, 2021 – 2024 |
| Figure 1‑5: Overdenture and Implant Bridge Market Segmentation, Europe |
| Figure 1‑6: Key Report Updates |
| Figure 1‑7: Version History |
| Figure 3‑1: Currency Exchange Rate, 2024 |
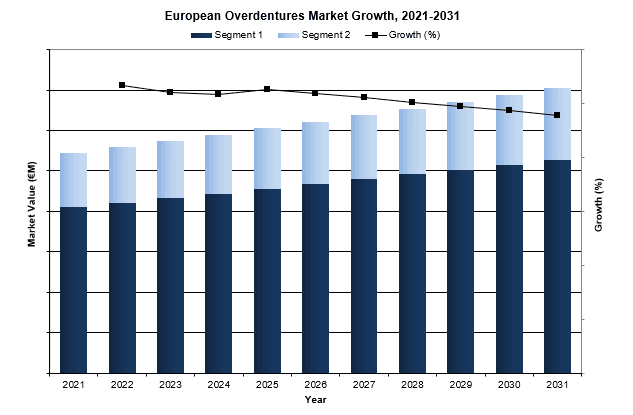
| Figure 3‑2: Overdenture and Implant Bridge Market by Segment, Europe, 2021 – 2031 (€M) |
| Figure 3‑3: Attachment and Implant Bar Market by Segment, Europe, 2021 – 2031 (€M) |
| Figure 3‑4: Overdenture and Implant Bridge Market by Segment, Europe, 2021 – 2031 (US$M) |
| Figure 3‑5: Attachment and Implant Bar Market by Segment, Europe, 2021 – 2031 (US$M) |
| Figure 3‑6: Leading Competitors, Overdenture and Implant Bridge Market, Europe, 2024 |
| Figure 5‑1: Overdenture Market by Segment, Europe, 2021 – 2031 (€M) |
| Figure 5‑2: Overdenture Market by Segment, Europe, 2021 – 2031 (US$M) |
| Figure 5‑3: Overdenture Market, Europe, 2021 – 2031 |
| Figure 5‑4: Units Sold by Country, Overdenture Market, Europe, 2021 – 2031 |
| Figure 5‑5: Average Selling Price by Country, Overdenture Market, Europe, 2021 – 2031 (€) |
| Figure 5‑6: Average Selling Price by Country, Overdenture Market, Europe, 2021 – 2031 (US$) |
| Figure 5‑7: Market Value by Country, Overdenture Market, Europe, 2021 – 2031 (€M) |
| Figure 5‑8: Market Value by Country, Overdenture Market, Europe, 2021 – 2031 (US$M) |
| Figure 5‑9: Implant-Supported (Non-Splinted) Overdenture Market, Europe, 2021 – 2031 |
| Figure 5‑10: Units Sold by Country, Implant-Supported (Non-Splinted) Overdenture Market, Europe, 2021 – 2031 |
| Figure 5‑11: Average Selling Price by Country, Implant-Supported (Non-Splinted) Overdenture Market, Europe, 2021 – 2031 (€) |
| Figure 5‑12: Average Selling Price by Country, Implant-Supported (Non-Splinted) Overdenture Market, Europe, 2021 – 2031 (US$) |
| Figure 5‑13: Market Value by Country, Implant-Supported (Non-Splinted) Overdenture Market, Europe, 2021 – 2031 (€M) |
| Figure 5‑14: Market Value by Country, Implant-Supported (Non-Splinted) Overdenture Market, Europe, 2021 – 2031 (US$M) |
| Figure 5‑15: Removable Implant Bar Overdenture Market, Europe, 2021 – 2031 |
| Figure 5‑16: Units Sold by Country, Removable Implant Bar Overdenture Market, Europe, 2021 – 2031 |
| Figure 5‑17: Average Selling Price by Country, Removable Implant Bar Overdenture Market, Europe, 2021 – 2031 (€) |
| Figure 5‑18: Average Selling Price by Country, Removable Implant Bar Overdenture Market, Europe, 2021 – 2031 (US$) |
| Figure 5‑19: Market Value by Country, Removable Implant Bar Overdenture Market, Europe, 2021 – 2031 (€M) |
| Figure 5‑20: Market Value by Country, Removable Implant Bar Overdenture Market, Europe, 2021 – 2031 (US$M) |
| Figure 5‑21: Fixed-Hybrid Overdenture Market, Europe, 2021 – 2031 |
| Figure 5‑22: Units Sold by Country, Fixed-Hybrid Overdenture Market, Europe, 2021 – 2031 |
| Figure 5‑23: Average Selling Price by Country, Fixed-Hybrid Overdenture Market, Europe, 2021 – 2031 (€) |
| Figure 5‑24: Average Selling Price by Country, Fixed-Hybrid Overdenture Market, Europe, 2021 – 2031 (US$) |
| Figure 5‑25: Market Value by Country, Fixed-Hybrid Overdenture Market, Europe, 2021 – 2031 (€M) |
| Figure 5‑26: Market Value by Country, Fixed-Hybrid Overdenture Market, Europe, 2021 – 2031 (US$M) |
| Figure 5‑27: Telescopic Overdenture Market, Europe, 2021 – 2031 |
| Figure 5‑28: Units Sold by Support Type, Overdenture Market Europe, 2021 – 2031 |
| Figure 5‑29: Traditional Implant Overdenture Units Sold by Country, Overdenture Market, Europe, 2021 – 2031 |
| Figure 5‑30: Mini Implant Units Sold by Country, Overdenture Market, Europe, 2021 – 2031 |
| Figure 5‑31: Implant Bar Units Sold by Country, Overdenture Market, Europe, 2021 – 2031 |
| Figure 6‑1: Implant Bar Market by Segment, Europe, 2021 – 2031 (€M) |
| Figure 6‑2: Implant Bar Market by Segment, Europe, 2021 – 2031 (US$M) |
| Figure 6‑3: Implant Bar Market, Europe, 2021 – 2031 |
| Figure 6‑4: Units Sold by Country, Implant Bar Market, Europe, 2021 – 2031 |
| Figure 6‑5: Average Selling Price by Country, Implant Bar Market, Europe, 2021 – 2031 (€) |
| Figure 6‑6: Average Selling Price by Country, Implant Bar Market, Europe, 2021 – 2031 (US$) |
| Figure 6‑7: Market Value by Country, Implant Bar Market, Europe, 2021 – 2031 (€M) |
| Figure 6‑8: Market Value by Country, Implant Bar Market, Europe, 2021 – 2031 (US$M) |
| Figure 6‑9: Traditional Casting Implant Bar Market, Europe, 2021 – 2031 |
| Figure 6‑10: Units Sold by Country, Traditional Casting Implant Bar Market, Europe, 2021 – 2031 |
| Figure 6‑11: Average Selling Price by Country, Traditional Casting Implant Bar Market, Europe, 2021 – 2031 (€) |
| Figure 6‑12: Average Selling Price by Country, Traditional Casting Implant Bar Market, Europe, 2021 – 2031 (US$) |
| Figure 6‑13: Market Value by Country, Traditional Casting Implant Bar Market, Europe, 2021 – 2031 (€M) |
| Figure 6‑14: Market Value by Country, Traditional Casting Implant Bar Market, Europe, 2021 – 2031 (US$M) |
| Figure 6‑15: Copy Mill Implant Bar Market, Europe, 2021 – 2031 |
| Figure 6‑16: Units Sold by Country, Copy Mill Implant Bar Market, Europe, 2021 – 2031 |
| Figure 6‑17: Average Selling Price by Country, Copy Mill Implant Bar Market, Europe, 2021 – 2031 (€) |
| Figure 6‑18: Average Selling Price by Country, Copy Mill Implant Bar Market, Europe, 2021 – 2031 (US$) |
| Figure 6‑19: Market Value by Country, Copy Mill Implant Bar Market, Europe, 2021 – 2031 (€M) |
| Figure 6‑20: Market Value by Country, Copy Mill Implant Bar Market, Europe, 2021 – 2031 (US$M) |
| Figure 6‑21: CAD/CAM Implant Bar Market, Europe, 2021 – 2031 |
| Figure 6‑22: Units Sold by Country, CAD/CAM Implant Bar Market, Europe, 2021 – 2031 |
| Figure 6‑23: Average Selling Price by Country, CAD/CAM Implant Bar Market, Europe, 2021 – 2031 (€) |
| Figure 6‑24: Average Selling Price by Country, CAD/CAM Implant Bar Market, Europe, 2021 – 2031 (US$) |
| Figure 6‑25: Market Value by Country, CAD/CAM Implant Bar Market, Europe, 2021 – 2031 (€M) |
| Figure 6‑26: Market Value by Country, CAD/CAM Implant Bar Market, Europe, 2021 – 2031 (US$M) |
| Figure 6‑27: Units Sold by Material, Implant Bar Market, Europe, 2021 – 2031 |
| Figure 6‑28: Titanium Implant Bar Units Sold by Country, Implant Bar Market, Europe, 2021 – 2031 |
| Figure 6‑29: Other Materials Implant Bar Units Sold by Country, Implant Bar Market, Europe, 2021 – 2031 |
| Figure 6‑30: Units Sold by Prosthetic Type, Implant Bar Market, Europe, 2021 – 2031 |
| Figure 6‑31: Removable Implant Bar Units Sold by Country, Implant Bar Market, Europe, 2021 – 2031 |
| Figure 6‑32: Fixed-Hybrid Implant Bar Units Sold by Country, Implant Bar Market, Europe, 2021 – 2031 |
| Figure 6‑33: Leading Competitors, Implant Bar Market, Europe, 2024 |
| Figure 6‑34: Leading Competitors by Country, Implant Bar Market, by CAD/CAM Milling Facilities, Europe, 2024 |
| Figure 7‑1: Attachment Market by Segment, Europe, 2021 – 2031 (€M) |
| Figure 7‑2: Attachment Market by Segment, Europe, 2021 – 2031 (US$M) |
| Figure 7‑3: Total Attachment Market, Europe, 2021 – 2031 |
| Figure 7‑4: Units Sold by Country, Attachment Market, Europe, 2021 – 2031 |
| Figure 7‑5: Average Selling Price by Country, Attachment Market, Europe, 2021 – 2031 (€) |
| Figure 7‑6: Average Selling Price by Country, Attachment Market, Europe, 2021 – 2031 (US$) |
| Figure 7‑7: Market Value by Country, Attachment Market, Europe, 2021 – 2031 (€M) |
| Figure 7‑8: Market Value by Country, Attachment Market, Europe, 2021 – 2031 (US$M) |
| Figure 7‑9: Removable Attachment Market by Segment, Europe, 2021 – 2031 (€M) |
| Figure 7‑10: Removable Attachment Market by Segment, Europe, 2021 – 2031 (US$M) |
| Figure 7‑11: Total Removable Attachment Market, Europe, 2021 – 2031 |
| Figure 7‑12: Units Sold by Country, Total Removable Attachment Market, Europe, 2021 – 2031 |
| Figure 7‑13: Average Selling Price by Country, Total Removable Attachment Market, Europe, 2021 – 2031 (€) |
| Figure 7‑14: Average Selling Price by Country, Total Removable Attachment Market, Europe, 2021 – 2031 (US$) |
| Figure 7‑15: Market Value by Country, Total Removable Attachment Market, Europe, 2021 – 2031 (€M) |
| Figure 7‑16: Market Value by Country, Total Removable Attachment Market, Europe, 2021 – 2031 (US$M) |
| Figure 7‑17: Implant-Level Attachment Market, Europe, 2021 – 2031 |
| Figure 7‑18: Units Sold by Country, Implant-Level Attachment Market, Europe, 2021 – 2031 |
| Figure 7‑19: Average Selling Price by Country, Implant-Level Attachment Market, Europe, 2021 – 2031 (€) |
| Figure 7‑20: Average Selling Price by Country, Implant-Level Attachment Market, Europe, 2021 – 2031 (US$) |
| Figure 7‑21: Market Value by Country, Implant-Level Attachment Market, Europe, 2021 – 2031 (€M) |
| Figure 7‑22: Market Value by Country, Implant-Level Attachment Market, Europe, 2021 – 2031 (US$M) |
| Figure 7‑23: Bar-Level Attachment Market, Europe, 2021 – 2031 |
| Figure 7‑24: Units Sold by Country, Bar-Level Attachment Market, Europe, 2021 – 2031 |
| Figure 7‑25: Average Selling Price by Country, Bar-Level Attachment Market, Europe, 2021 – 2031 (€) |
| Figure 7‑26: Average Selling Price by Country, Bar-Level Attachment Market, Europe, 2021 – 2031 (US$) |
| Figure 7‑27: Market Value by Country, Bar-Level Attachment Market, Europe, 2021 – 2031 (€M) |
| Figure 7‑28: Market Value by Country, Bar-Level Attachment Market, Europe, 2021– 2031 (US$M) |
| Figure 7‑29: Fixed Attachment Market, Europe, 2021 – 2031 |
| Figure 7‑30: Units Sold by Country, Fixed Attachment Market, Europe, 2021 – 2031 |
| Figure 7‑31: Average Selling Price by Country, Fixed Attachment Market, Europe, 2021 – 2031 (€) |
| Figure 7‑32: Average Selling Price by Country, Fixed Attachment Market, Europe, 2021 – 2031 (US$) |
| Figure 7‑33: Market Value by Country, Fixed Attachment Market, Europe, 2021 – 2031 (€M) |
| Figure 7‑34: Market Value by Country, Fixed Attachment Market, Europe, 2021 – 2031 (US$M) |
| Figure 7‑35: Leading Competitors, Attachment Market, by Attachment Type, Europe, 2024 |
| Figure 7‑36: Leading Competitors by Country, Attachment Market, Europe, 2024 |
| Figure 8‑1: Implant Bridges Market by Segment, Europe, 2021 – 2031 (€M) |
| Figure 8‑2: Implant Bridges Market by Segment, Europe, 2021 – 2031 (US$M) |
| Figure 8‑3: Implant Bridges Market, Europe, 2021 – 2031 |
| Figure 8‑4: Units Sold by Country, Implant Bridges Market, Europe, 2021 – 2031 |
| Figure 8‑5: Average Selling Price by Country, Implant Bridges Market, Europe, 2021 – 2031 (€) |
| Figure 8‑6: Average Selling Price by Country, Implant Bridges Market, Europe, 2021 – 2031 (US$) |
| Figure 8‑7: Market Value by Country, Implant Bridges Market, Europe, 2021 – 2031 (€M) |
| Figure 8‑8: Market Value by Country, Implant Bridges Market, Europe, 2021 – 2031 (US$M) |
| Figure 8‑9: Cement-Retained Implant Bridge Market, Europe, 2021 – 2031 |
| Figure 8‑10: Units Sold by Country, Cement-Retained Implant Bridge Market, Europe, 2021 – 2031 |
| Figure 8‑11: Average Selling Price by Country, Cement-Retained Implant Bridge Market, Europe, 2021 – 2031 (€) |
| Figure 8‑12: Average Selling Price by Country, Cement-Retained Implant Bridge Market, Europe, 2021 – 2031 (US$) |
| Figure 8‑13: Market Value by Country, Cement-Retained Implant Bridge Market, Europe, 2021 – 2031 (€M) |
| Figure 8‑14: Market Value by Country, Cement-Retained Implant Bridge Market, Europe, 2021 – 2031 (US$M) |
| Figure 8‑15: Screw-Retained Implant Bridge Market, Europe, 2021 – 2031 |
| Figure 8‑16: Units Sold by Country, Screw-Retained Implant Bridge Market, Europe, 2021 – 2031 |
| Figure 8‑17: Average Selling Price by Country, Screw-Retained Implant Bridge Market, Europe, 2021 – 2031 (€) |
| Figure 8‑18: Average Selling Price by Country, Screw-Retained Implant Bridge Market, Europe, 2021 – 2031 (US$) |
| Figure 8‑19: Market Value by Country, Screw-Retained Implant Bridge Market, Europe, 2021 – 2031 (€M) |
| Figure 8‑20: Market Value by Country, Screw-Retained Implant Bridge Market, Europe, 2021 – 2031 (US$M) |
| Figure 8‑21: Units Sold by Size, Implant Bridge Market, Europe, 2021 – 2031 |
| Figure 8‑22: Partial Implant Bridge Units Sold by Country, Implant Bridge Market, Europe, 2021 – 2031 |
| Figure 8‑23: Full-Arch Implant Bridge Units Sold by Country, Implant Bridge Market, Europe, 2021 – 2031 |
| Figure 8‑24: Units Sold by Size, Implant Bridge Market, Europe, 2021 – 2031 |
| Figure 8‑25: Zirconia Implant Bridge Units Sold by Country, Implant Bridge Market, Europe, 2021 – 2031 |
| Figure 8‑26: Titanium Implant Bridge Units Sold by Country, Implant Bridge Market, Europe, 2021 – 2031 |
| Figure 8‑27: Cobalt Chromium Implant Bridge Units Sold by Country, Implant Bridge Market, Europe, 2021 – 2031 |
| Figure 8‑28: Leading Competitors by Country, Implant Bridges Market, Europe, 2024 |

 This report provides a comprehensive analysis of the implant bar market, focusing on CAD/CAM-manufactured implant bars while excluding those produced by traditional dental laboratories. Although laboratories account for a significant portion of implant bar production, the market for laboratory-produced bars remains highly fragmented compared to the more consolidated CAD/CAM segment.
 This report provides a comprehensive analysis of the implant bar market, focusing on CAD/CAM-manufactured implant bars while excluding those produced by traditional dental laboratories. Although laboratories account for a significant portion of implant bar production, the market for laboratory-produced bars remains highly fragmented compared to the more consolidated CAD/CAM segment.


