| Figure 1‑1: Dental Materials Market Share Ranking by Segment, Global, 2022 (1 of 2) |
| Figure 1‑2: Dental Materials Market Share Ranking by Segment, Global, 2022 (2 of 2) |
| Figure 1‑3: Companies Researched in This Report (1 of 2) |
| Figure 1‑4: Companies Researched in This Report (2 of 2) |
| Figure 1‑5: Factors Impacting the Dental Materials Market by Segment, Global (1 of 2) |
| Figure 1‑6: Factors Impacting the Dental Materials Market by Segment, Global (2 of 2) |
| Figure 1‑7: Recent Events in the Dental Materials Market, Global, 2022 – 2025 (1 of 2) |
| Figure 1‑8: Recent Events in the Dental Materials Market, Global, 2022 – 2025 (2 of 2) |
| Figure 1‑9: Dental Materials Procedures Covered |
| Figure 1‑10: Dental Materials Markets Covered (1 of 3) |
| Figure 1‑11: Dental Materials Markets Covered (2 of 3) |
| Figure 1‑12: Dental Materials Markets Covered (3 of 3) |
| Figure 1‑13: Dental Materials Regions Covered, Global (1 of 2) |
| Figure 1‑14: Dental Materials Regions Covered, Global (2 of 2) |
| Figure 1‑15: Key Report Updates |
| Figure 1‑16: Version History |
| Figure 3‑1: Dental Materials Market by Segment, Global, 2022 – 2032 (US$M) (1 of 2) |
| Figure 3‑2: Dental Materials Market by Segment, Global, 2022 – 2032 (US$M) (2 of 2) |
| Figure 3‑3: Dental Materials Market by Region, Global, 2022 – 2032 (US$M) |
| Figure 3‑4: Leading Competitors, Dental Materials Market by Segment, Global, 2025 (1 of 2) |
| Figure 3‑5: Leading Competitors, Dental Materials Market by Segment, Global, 2025 (2 of 2) |
| Figure 4‑1: Dental Cement Markets Covered |
| Figure 4‑2: Dental Cement Regions Covered, Global (1 of 2) |
| Figure 4‑3: Dental Cement Regions Covered, Global (2 of 2) |
| Figure 4‑4: Dental Cement Procedures by Region, Global, 2022– 2032 |
| Figure 4‑5: Dental Cement Procedures by Country, North America, 2025– 2032 |
| Figure 4‑6: Dental Cement Procedures by Country, Latin America, 2025– 2032 (1 of 2) |
| Figure 4‑7: Dental Cement Procedures by Country, Latin America, 2025– 2032 (2 of 2) |
| Figure 4‑8: Dental Cement Procedures by Country, Western Europe, 2025– 2032 (1 of 2) |
| Figure 4‑9: Dental Cement Procedures by Country, Western Europe, 2025– 2032 (2 of 2) |
| Figure 4‑10: Dental Cement Procedures by Country, Central & Eastern Europe, 2025– 2032 (1 of 2) |
| Figure 4‑11: Dental Cement Procedures by Country, Central & Eastern Europe, 2025– 2032 (2 of 2) |
| Figure 4‑12: Dental Cement Procedures by Country, Middle East, 2025– 2032 |
| Figure 4‑13: Dental Cement Procedures by Country, Asia-Pacific, 2025– 2032 (1 of 3) |
| Figure 4‑14: Dental Cement Procedures by Country, Asia-Pacific, 2025– 2032 (2 of 3) |
| Figure 4‑15: Dental Cement Procedures by Country, Asia-Pacific, 2025– 2032 (3 of 3) |
| Figure 4‑16: Dental Cement Procedures by Country, Africa, 2025– 2032 |
| Figure 4‑17: Dental Cement Market by Segment, Global, 2025– 2032 (US$M) |
| Figure 4‑18: Dental Cement Market by Region, Global, 2025– 2032 (US$M) |
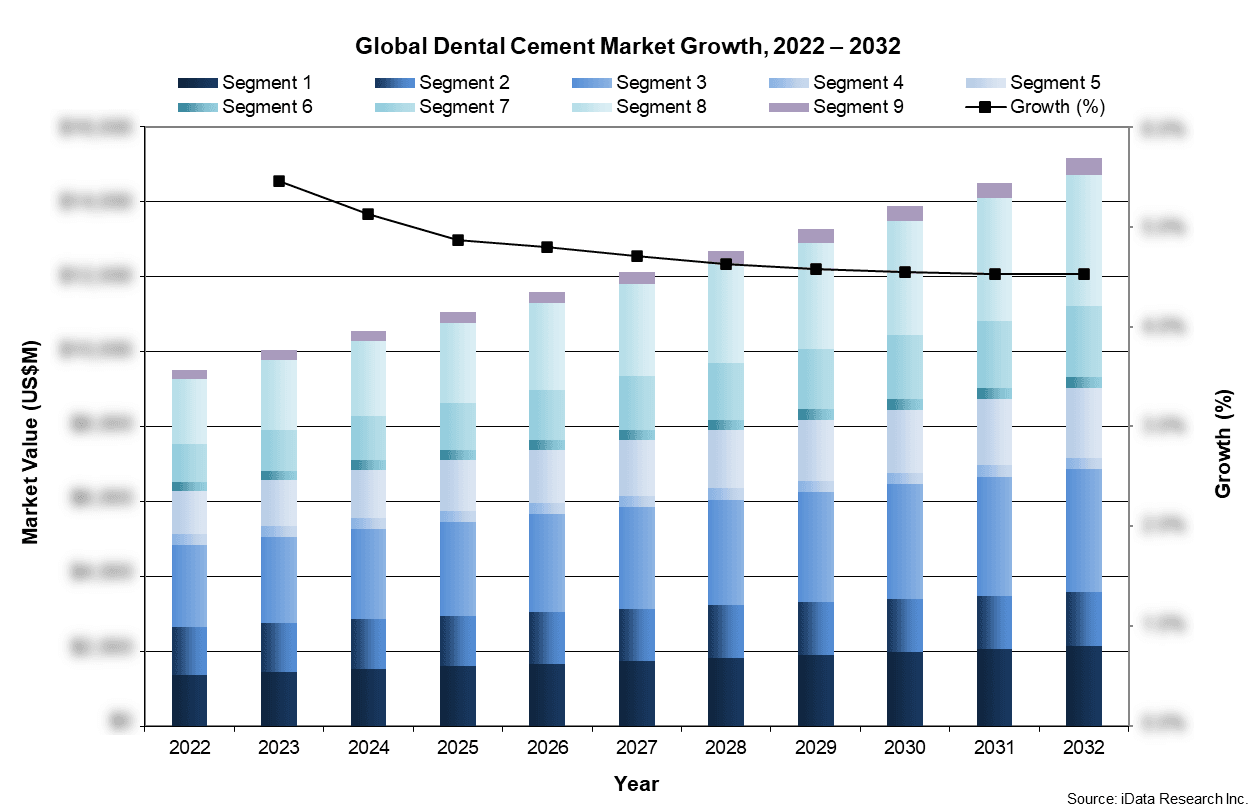
| Figure 4‑19: Total Dental Cement Market, Global, 2022 – 2032 |
| Figure 4‑20: Units Sold by Region, Dental Cement Market, Global, 2022 – 2032 |
| Figure 4‑21: Average Selling Price by Region, Dental Cement Market, Global, 2022 – 2032 (US$) |
| Figure 4‑22: Market Value by Region, Dental Cement Market, Global, 2022 – 2032 (US$M) |
| Figure 4‑23: Permanent Dental Cement Market, Global, 2022 – 2032 |
| Figure 4‑24: Units Sold by Region, Permanent Dental Cement Market, Global, 2022 – 2032 |
| Figure 4‑25: Average Selling Price by Region, Permanent Dental Cement Market, Global, 2022 – 2032 (US$) |
| Figure 4‑26: Market Value by Region, Permanent Dental Cement Market, Global, 2022 – 2032 (US$M) |
| Figure 4‑27: Temporary Dental Cement Market, Global, 2022 – 2032 |
| Figure 4‑28: Units Sold by Region, Temporary Dental Cement Market, Global, 2022 – 2032 |
| Figure 4‑29: Average Selling Price by Region, Temporary Dental Cement Market, Global, 2022 – 2032 (US$) |
| Figure 4‑30: Market Value by Region, Temporary Dental Cement Market, Global, 2022 – 2032 (US$M) |
| Figure 4‑31: Permanent Dental Cement Units Sold by Material Type, Global, 2022 – 2032 |
| Figure 4‑32: Units Sold by Region, Composite Resin Dental Cement Market, Global, 2022 – 2032 |
| Figure 4‑33: Units Sold by Region, Glass Ionomer/Resin-Modified Glass Ionomer Dental Cement Market, Global, 2022 – 2032 |
| Figure 4‑34: Units Sold by Region, Zinc Polycarboxylate Dental Cement Market, Global, 2022 – 2032 |
| Figure 4‑35: Units Sold by Region, Zinc Phosphate Dental Cement Market, Global, 2022 – 2032 |
| Figure 4‑36: Permanent Dental Cement Units Sold by Delivery Type, Global, 2022 – 2032 |
| Figure 4‑37: Units Sold by Region, Powder/Liquid System, Global, 2022 – 2032 |
| Figure 4‑38: Units Sold by Region, Auto-Mix Syringe System, Global, 2022 – 2032 |
| Figure 4‑39: Units Sold by Region, Two-Paste/Syringe Systems, Global, 2022 – 2032 |
| Figure 4‑40: Units Sold by Region, Unit Dose/Capsule System, Global, 2022 – 2032 |
| Figure 4‑41: Permanent Dental Cement Units Sold by Curing Method, Global, 2022 – 2032 |
| Figure 4‑42: Units Sold by Region, Light-Cure Method, Global, 2022 – 2032 |
| Figure 4‑43: Units Sold by Region, Self-Cure Method, Global, 2022 – 2032 |
| Figure 4‑44: Units Sold by Region, Dual-Cure Method, Global, 2022 – 2032 |
| Figure 4‑45: Permanent Dental Cement Units Sold by Application Type, Global, 2022 – 2032 |
| Figure 4‑46: Units Sold by Region, Crowns and Bridges, Global, 2022 – 2032 |
| Figure 4‑47: Units Sold by Region, Posts, Inlays, Onlays and Veneers, Global, 2022 – 2032 |
| Figure 4‑48: Market Value by Region, Dental Implant Crowns, Global, 2022 – 2032 (US$M) |
| Figure 4‑49: Leading Competitors, Dental Cement Market, Global, 2025 |
| Figure 5‑1: Dental Impression Material Procedures Covered |
| Figure 5‑2: Dental Impression Material Markets Covered |
| Figure 5‑3: Dental Impression Material Regions Covered, Global (1 of 2) |
| Figure 5‑4: Dental Impression Material Regions Covered, Global (2 of 2) |
| Figure 5‑5: Dental Impression Procedures by Material Type, Global, 2022 – 2032 |
| Figure 5‑6: Dental Impression Procedures by Region, Global, 2022 – 2032 |
| Figure 5‑7: Dental Impression Procedures by Country, North America, 2022 – 2032 |
| Figure 5‑8: Dental Impression Procedures by Country, Latin America, 2022 – 2032 (1 of 2) |
| Figure 5‑9: Dental Impression Procedures by Country, Latin America, 2022 – 2032 (2 of 2) |
| Figure 5‑10: Dental Impression Procedures by Country, Western Europe, 2022 – 2032 |
| Figure 5‑11: Dental Impression Procedures by Country, Central & Eastern Europe, 2022 – 2032 (1 of 2) |
| Figure 5‑12: Dental Impression Procedures by Country, Central & Eastern Europe, 2022 – 2032 (2 of 2) |
| Figure 5‑13: Dental Impression Procedures by Country, Middle East, 2022 – 2032 |
| Figure 5‑14: Dental Impression Procedures by Country, Asia-Pacific, 2022 – 2032 (1 of 3) |
| Figure 5‑15: Dental Impression Procedures by Country, Asia-Pacific, 2022 – 2032 (2 of 3) |
| Figure 5‑16: Dental Impression Procedures by Country, Asia-Pacific, 2022 – 2032 (3 of 3) |
| Figure 5‑17: Dental Impression Procedures by Country, Africa, 2022 – 2032 |
| Figure 5‑18: Preliminary Impression Procedures (Alginate) by Region, Global, 2022 – 2032 |
| Figure 5‑19: Preliminary Impression Procedures (Alginate) by Country, North America, 2022 – 2032 |
| Figure 5‑20: Preliminary Impression Procedures (Alginate) by Country, Latin America, 2022 – 2032 (1 of 2) |
| Figure 5‑21: Preliminary Impression Procedures (Alginate) by Country, Latin America, 2022 – 2032 (2 of 2) |
| Figure 5‑22: Preliminary Impression Procedures (Alginate) by Country, Western Europe, 2022 – 2032 |
| Figure 5‑23: Preliminary Impression Procedures (Alginate) by Country, Central & Eastern Europe, 2022 – 2032 (1 of 2) |
| Figure 5‑24: Preliminary Impression Procedures (Alginate) by Country, Central & Eastern Europe, 2022 – 2032 (2 of 2) |
| Figure 5‑25: Preliminary Impression Procedures (Alginate) by Country, Middle East, 2022 – 2032 |
| Figure 5‑26: Preliminary Impression Procedures (Alginate) by Country, Asia-Pacific, 2022 – 2032 (1 of 3) |
| Figure 5‑27: Preliminary Impression Procedures (Alginate) by Country, Asia-Pacific, 2022 – 2032 (2 of 3) |
| Figure 5‑28: Preliminary Impression Procedures (Alginate) by Country, Asia-Pacific, 2022 – 2032 (3 of 3) |
| Figure 5‑29: Preliminary Impression Procedures (Alginate) by Country, Africa, 2022 – 2032 |
| Figure 5‑30: Other Impression Procedures by Region, Global, 2022 – 2032 |
| Figure 5‑31: Other Impression Procedures by Country, North America, 2022 – 2032 |
| Figure 5‑32: Other Impression Procedures by Country, Latin America, 2022 – 2032 (1 of 2) |
| Figure 5‑33: Other Impression Procedures by Country, Latin America, 2022 – 2032 (2 of 2) |
| Figure 5‑34: Other Impression Procedures by Country, Western Europe, 2022 – 2032 |
| Figure 5‑35: Other Impression Procedures by Country, Central & Eastern Europe, 2022 – 2032 (1 of 2) |
| Figure 5‑36: Other Impression Procedures by Country, Central & Eastern Europe, 2022 – 2032 (2 of 2) |
| Figure 5‑37: Other Impression Procedures by Country, Middle East, 2022 – 2032 |
| Figure 5‑38: Other Impression Procedures by Country, Asia-Pacific, 2022 – 2032 (1 of 3) |
| Figure 5‑39: Other Impression Procedures by Country, Asia-Pacific, 2022 – 2032 (2 of 3) |
| Figure 5‑40: Other Impression Procedures by Country, Asia-Pacific, 2022 – 2032 (3 of 3) |
| Figure 5‑41: Other Impression Procedures by Country, Africa, 2022 – 2032 |
| Figure 5‑42: Dental Impression Material Market by Segment, Global, 2022 – 2025 (US$M) |
| Figure 5‑43: Dental Impression Material Market by Region, Global, 2022 – 2025 (US$M) |
| Figure 5‑44: Dental Impression Material Market, Global, 2022 – 2025 |
| Figure 5‑45: Units Sold by Region, Dental Impression Material Market, Global, 2022 – 2025 |
| Figure 5‑46: Average Selling Price by Region, Dental Impression Material Market, Global, 2022 – 2025 (US$) |
| Figure 5‑47: Market Value by Region, Dental Impression Material Market, Global, 2022 – 2025(US$M) |
| Figure 5‑48: Vinyl Polysiloxane Dental Impression Material Market, Global, 2022 – 2032 |
| Figure 5‑49: Units Sold by Region, Vinyl Polysiloxane Dental Impression Material Market, Global, 2022 – 2032 |
| Figure 5‑50: Average Selling Price by Region, Vinyl Polysiloxane Dental Impression Material Market, Global, 2022 – 2032 (US$) |
| Figure 5‑51: Market Value by Region, Vinyl Polysiloxane Dental Impression Material Market, Global, 2022 – 2032 (US$M) |
| Figure 5‑52: Polyether Dental Impression Material Market, Global, 2022 – 2032 |
| Figure 5‑53: Units Sold by Region, Polyether Dental Impression Material Market, Global, 2022 – 2032 |
| Figure 5‑54: Average Selling Price by Region, Polyether Dental Impression Material Market, Global, 2022 – 2032 (US$) |
| Figure 5‑55: Market Value by Region, Polyether Dental Impression Material Market, Global, 2022 – 2032 (US$M) |
| Figure 5‑56: Alginate Dental Impression Material Market, Global, 2022 – 2032 |
| Figure 5‑57: Units Sold by Region, Alginate Dental Impression Material Market, Global, 2022 – 2032 |
| Figure 5‑58: Average Selling Price by Region, Alginate Dental Impression Material Market, Global, 2022 – 2032 (US$) |
| Figure 5‑59: Market Value by Region, Alginate Dental Impression Material Market, Global, 2022 – 2032 (US$M) |
| Figure 5‑60: Other Dental Impression Material Market, Global, 2022 – 2032 |
| Figure 5‑61: Units Sold by Region, Other Dental Impression Material Market, Global, 2022 – 2032 |
| Figure 5‑62: Average Selling Price by Region, Other Dental Impression Material Market, Global, 2022 – 2032 (US$) |
| Figure 5‑63: Market Value by Region, Other Dental Impression Material Market, Global, 2022 – 2032 (US$M) |
| Figure 5‑64: Dental Impression Units Sold by Delivery Type, Global, 2022 – 2032 |
| Figure 5‑65: Units Sold by Region, Cartridge/Syringe/Garant Gun, Global, 2022 – 2032 |
| Figure 5‑66: Units Sold by Region, Hand-Mix, Global, 2022 – 2032 |
| Figure 5‑67: Units Sold by Region, Dynamic Mixer, Global, 2022 – 2032 |
| Figure 5‑68: Units Sold by Region, Other, Global, 2022 – 2032 |
| Figure 5‑69: Leading Competitors, Dental Impression Material Market, Global, 2025 |
| Figure 6‑1: Direct Restorative Material Procedures Covered |
| Figure 6‑2: Direct Restorative Material Markets Covered |
| Figure 6‑3: Direct Restorative Material Regions Covered, Global (1 of 2) |
| Figure 6‑4: Direct Restorative Material Regions Covered, Global (2 of 2) |
| Figure 6‑5: Direct Restorative Procedures by Segment, Global, 2022 – 2032 |
| Figure 6‑6: Direct Restorative Procedures by Region, Global, 2022 – 2032 |
| Figure 6‑7: Direct Restorative Procedures by Country, North America, 2022 – 2032 |
| Figure 6‑8: Direct Restorative Procedures by Country, Latin America, 2022 – 2032 (1 of 2) |
| Figure 6‑9: Direct Restorative Procedures by Country, Latin America, 2022 – 2032 (2 of 2) |
| Figure 6‑10: Direct Restorative Procedures by Country, Western Europe, 2022 – 2032 (1 of 2) |
| Figure 6‑11: Direct Restorative Procedures by Country, Western Europe, 2022 – 2032 (2 of 2) |
| Figure 6‑12: Direct Restorative Procedures by Country, Central & Eastern Europe, 2022 – 2032 (1 of 2) |
| Figure 6‑13: Direct Restorative Procedures by Country, Central & Eastern Europe, 2022 – 2032 (2 of 2) |
| Figure 6‑14: Direct Restorative Procedures by Country, Middle East, 2022 – 2032 |
| Figure 6‑15: Direct Restorative Procedures by Country, Asia-Pacific, 2022 – 2032 (1 of 3) |
| Figure 6‑16: Direct Restorative Procedures by Country, Asia-Pacific, 2022 – 2032 (2 of 3) |
| Figure 6‑17: Direct Restorative Procedures by Country, Asia-Pacific, 2022 – 2032 (3 of 3) |
| Figure 6‑18: Direct Restorative Procedures by Country, Africa, 2022 – 2032 |
| Figure 6‑19: Composite Procedures by Region, Global, 2022 – 2032 |
| Figure 6‑20: Composite Procedures by Country, North America, 2022 – 2032 |
| Figure 6‑21: Composite Procedures by Country, Latin America, 2022 – 2032 (1 of 2) |
| Figure 6‑22: Composite Procedures by Country, Latin America, 2022 – 2032 (2 of 2) |
| Figure 6‑23: Composite Procedures by Country, Western Europe, 2022 – 2032 (1 of 2) |
| Figure 6‑24: Composite Procedures by Country, Western Europe, 2022 – 2032 (2 of 2) |
| Figure 6‑25: Composite Procedures by Country, Central & Eastern Europe, 2022 – 2032 (1 of 2) |
| Figure 6‑26: Composite Procedures by Country, Central & Eastern Europe, 2022 – 2032 (2 of 2) |
| Figure 6‑27: Composite Procedures by Country, Middle East, 2022 – 2032 |
| Figure 6‑28: Composite Procedures by Country, Asia-Pacific, 2022 – 2032 (1 of 3) |
| Figure 6‑29: Composite Procedures by Country, Asia-Pacific, 2022 – 2032 (2 of 3) |
| Figure 6‑30: Composite Procedures by Country, Asia-Pacific, 2022 – 2032 (3 of 3) |
| Figure 6‑31: Composite Procedures by Country, Africa, 2022 – 2032 |
| Figure 6‑32: Glass Ionomer/Resin Ionomer Procedures by Region, Global, 2022 – 2032 |
| Figure 6‑33: Glass Ionomer/Resin Ionomer Procedures by Country, North America, 2022 – 2032 |
| Figure 6‑34: Glass Ionomer/Resin Ionomer Procedures by Country, Latin America, 2022 – 2032 (1 of 2) |
| Figure 6‑35: Glass Ionomer/Resin Ionomer Procedures by Country, Latin America, 2022 – 2032 (2 of 2) |
| Figure 6‑36: Glass Ionomer/Resin Ionomer Procedures by Country, Western Europe, 2022 – 2032 (1 of 2) |
| Figure 6‑37: Glass Ionomer/Resin Ionomer Procedures by Country, Western Europe, 2022 – 2032 (2 of 2) |
| Figure 6‑38: Glass Ionomer/Resin Ionomer Procedures by Country, Central & Eastern Europe, 2022 – 2032 (1 of 2) |
| Figure 6‑39: Glass Ionomer/Resin Ionomer Procedures by Country, Central & Eastern Europe, 2022 – 2032 (2 of 2) |
| Figure 6‑40: Glass Ionomer/Resin Ionomer Procedures by Country, Middle East, 2022 – 2032 |
| Figure 6‑41: Glass Ionomer/Resin Ionomer Procedures by Country, Asia-Pacific, 2022 – 2032 (1 of 3) |
| Figure 6‑42: Glass Ionomer/Resin Ionomer Procedures by Country, Asia-Pacific, 2022 – 2032 (2 of 3) |
| Figure 6‑43: Glass Ionomer/Resin Ionomer Procedures by Country, Asia-Pacific, 2022 – 2032 (3 of 3) |
| Figure 6‑44: Glass Ionomer/Resin Ionomer Procedures by Country, Africa, 2022 – 2032 |
| Figure 6‑45: Amalgam Procedures by Region, Global, 2022 – 2032 |
| Figure 6‑46: Amalgam Procedures by Country, North America, 2022 – 2032 |
| Figure 6‑47: Amalgam Procedures by Country, Latin America, 2022 – 2032 (1 of 2) |
| Figure 6‑48: Amalgam Procedures by Country, Latin America, 2022 – 2032 (2 of 2) |
| Figure 6‑49: Amalgam Procedures by Country, Western Europe, 2022 – 2032 |
| Figure 6‑50: Amalgam Procedures by Country, Central & Eastern Europe, 2022 – 2032 (1 of 2) |
| Figure 6‑51: Amalgam Procedures by Country, Central & Eastern Europe, 2022 – 2032 (2 of 2) |
| Figure 6‑52: Amalgam Procedures by Country, Middle East, 2022 – 2032 |
| Figure 6‑53: Amalgam Procedures by Country, Asia-Pacific, 2022 – 2032 (1 of 3) |
| Figure 6‑54: Amalgam Procedures by Country, Asia-Pacific, 2022 – 2032 (2 of 3) |
| Figure 6‑55: Amalgam Procedures by Country, Asia-Pacific, 2022 – 2032 (3 of 3) |
| Figure 6‑56: Amalgam Procedures by Country, Africa, 2022 – 2032 |
| Figure 6‑57: Direct Restorative Material Market by Segment, Global, 2022 – 2032 (US$M) |
| Figure 6‑58: Direct Restorative Material Market by Region, Global, 2022 – 2032 (US$M) |
| Figure 6‑59: Direct Restorative Material Market, Global, 2022 – 2032 |
| Figure 6‑60: Units Sold by Region, Direct Restorative Material Market, Global, 2022 – 2032 |
| Figure 6‑61: Average Selling Price by Region, Direct Restorative Material Market, Global, 2022 – 2032 (US$) |
| Figure 6‑62: Market Value by Region, Direct Restorative Material Market, Global, 2022 – 2032 (US$M) |
| Figure 6‑63: Composite Direct Restorative Material Market, Global, 2022 – 2032 |
| Figure 6‑64: Units Sold by Region, Composite Direct Restorative Material Market, Global, 2022 – 2032 |
| Figure 6‑65: Average Selling Price by Region, Composite Direct Restorative Material Market, Global, 2022 – 2032 (US$) |
| Figure 6‑66: Market Value by Region, Composite Direct Restorative Material Market, Global, 2022 – 2032 (US$M) |
| Figure 6‑67: Glass/Resin Ionomer Direct Restorative Material Market, Global, 2022 – 2032 |
| Figure 6‑68: Units Sold by Region, Glass/Resin Ionomer Direct Restorative Material Market, Global, 2022 – 2032 |
| Figure 6‑69: Average Selling Price by Region, Glass/Resin Ionomer Direct Restorative Material Market, Global, 2022 – 2032 (US$) |
| Figure 6‑70: Market Value by Region, Glass/Resin Ionomer Direct Restorative Material Market, Global, 2022 – 2032 (US$M) |
| Figure 6‑71: Amalgam Direct Restorative Material Market, Global, 2022 – 2032 |
| Figure 6‑72: Units Sold by Region, Amalgam Direct Restorative Material Market, Global, 2022 – 2032 |
| Figure 6‑73: Average Selling Price by Region, Amalgam Direct Restorative Material Market, Global, 2022 – 2032 (US$) |
| Figure 6‑74: Market Value by Region, Amalgam Direct Restorative Material Market, Global, 2022 – 2032 (US$M) |
| Figure 6‑75: Direct Restorative Units Sold by Delivery Type, Global, 2022 – 2032 |
| Figure 6‑76: Units Sold by Region, Powder/Liquid, Global, 2022 – 2032 |
| Figure 6‑77: Units Sold by Region, Auto-Mix Syringe, Global, 2022 – 2032 |
| Figure 6‑78: Units Sold by Region, Two-Paste/Syringe, Global, 2022 – 2032 |
| Figure 6‑79: Units Sold by Region, Unit Dose/Capsule, Global, 2022 – 2032 |
| Figure 6‑80: Direct Restorative Units Sold by Delivery Type, Global, 2022 – 2032 |
| Figure 6‑81: Units Sold by Region, Light-Cure Method, Global, 2022 – 2032 |
| Figure 6‑82: Units Sold by Region, Self-Cure Method, Global, 2022 – 2032 |
| Figure 6‑83: Units Sold by Region, Dual-Cure Method, Global, 2022 – 2032 |
| Figure 6‑84: Leading Competitors, Direct Restorative Material Market, Global, 2025 |
| Figure 7‑1: Temporary Restorative Material Regions Covered, Global (1 of 2) |
| Figure 7‑2: Temporary Restorative Material Regions Covered, Global (2 of 2) |
| Figure 7‑3: Temporary Restorative Procedures by Region, Global, 2021 – 2032 |
| Figure 7‑4: Temporary Restorative Procedures by Country, North America, 2021 – 2032 |
| Figure 7‑5: Temporary Restorative Procedures by Country, Latin America, 2021 – 2032 (1 of 2) |
| Figure 7‑6: Temporary Restorative Procedures by Country, Latin America, 2021 – 2032 (2 of 2) |
| Figure 7‑7: Temporary Restorative Procedures by Country, Western Europe, 2021 – 2032 |
| Figure 7‑8: Temporary Restorative Procedures by Country, Central & Eastern Europe, 2021 – 2032 (1 of 2) |
| Figure 7‑9: Temporary Restorative Procedures by Country, Central & Eastern Europe, 2021 – 2032 (2 of 2) |
| Figure 7‑10: Temporary Restorative Procedures by Country, Middle East, 2021 – 2032 |
| Figure 7‑11: Temporary Restorative Procedures by Country, Asia-Pacific, 2021 – 2032 (1 of 3) |
| Figure 7‑12: Temporary Restorative Procedures by Country, Asia-Pacific, 2021 – 2032 (2 of 3) |
| Figure 7‑13: Temporary Restorative Procedures by Country, Asia-Pacific, 2021 – 2032 (3 of 3) |
| Figure 7‑14: Direct Restorative Procedures by Country, Africa, 2021 – 2032 |
| Figure 7‑15: Temporary Restorative Material Market, Global, 2022 – 2032 |
| Figure 7‑16: Units Sold by Region, Temporary Restorative Material Market, Global, 2022 – 2032 |
| Figure 7‑17: Average Selling Price by Region, Temporary Restorative Material Market, Global, 2022 – 2032 (US$) |
| Figure 7‑18: Market Value by Region, Temporary Restorative Material Market, Global, 2022 – 2032 (US$M) |
| Figure 7‑19: Leading Competitors, Temporary Restorative Material Market, Global, 2025 |
| Figure 8‑1: Dental Bonding Agent Markets Covered |
| Figure 8‑2: Dental Bonding Agent Regions Covered, Global (1 of 2) |
| Figure 8‑3: Dental Bonding Agent Regions Covered, Global (2 of 2) |
| Figure 8‑4: Dental Bonding Procedures by Region, Global, 2022 – 2032 |
| Figure 8‑5: Dental Bonding Procedures by Country, North America, 2022 – 2032 |
| Figure 8‑6: Dental Bonding Procedures by Country, Latin America, 2022 – 2032 (1 of 2) |
| Figure 8‑7: Dental Bonding Procedures by Country, Latin America, 2022 – 2032 (2 of 2) |
| Figure 8‑8: Dental Bonding Procedures by Country, Western Europe, 2022 – 2032 (1 of 2) |
| Figure 8‑9: Dental Bonding Procedures by Country, Western Europe, 2022 – 2032 (2 of 2) |
| Figure 8‑10: Dental Bonding Procedures by Country, Central & Eastern Europe, 2022 – 2032 (1 of 2) |
| Figure 8‑11: Dental Bonding Procedures by Country, Central & Eastern Europe, 2022 – 2032 (2 of 2) |
| Figure 8‑12: Dental Bonding Procedures by Country, Middle East, 2022 – 2032 |
| Figure 8‑13: Dental Bonding Procedures by Country, Asia-Pacific, 2022 – 2032 (1 of 3) |
| Figure 8‑14: Dental Bonding Procedures by Country, Asia-Pacific, 2022 – 2032 (2 of 3) |
| Figure 8‑15: Dental Bonding Procedures by Country, Asia-Pacific, 2022 – 2032 (3 of 3) |
| Figure 8‑16: Dental Bonding Procedures by Country, Africa, 2022 – 2032 |
| Figure 8‑17: Dental Bonding Agent Market by Segment, Global, 2022 – 2032 (US$M) |
| Figure 8‑18: Dental Bonding Agent Market by Region, Global, 2022 – 2032 (US$M) |
| Figure 8‑19: Dental Bonding Agent Market, Global, 2022 – 2032 |
| Figure 8‑20: Units Sold by Region, Dental Bonding Agent Market, Global, 2022 – 2032 |
| Figure 8‑21: Average Selling Price by Region, Dental Bonding Agent Market, Global, 2022 – 2032 (US$) |
| Figure 8‑22: Market Value by Region, Dental Bonding Agent Market, Global, 2022 – 2032 (US$M) |
| Figure 8‑23: Total-Etch Dental Bonding Agent Market, Global, 2022 – 2032 |
| Figure 8‑24: Units Sold by Region, Total-Etch Dental Bonding Agent Market, Global, 2022 – 2032 |
| Figure 8‑25: Average Selling Price by Region, Total-Etch Dental Bonding Agent Market, Global, 2022 – 2032 (US$) |
| Figure 8‑26: Market Value by Region, Total-Etch Dental Bonding Agent Market, Global, 2022 – 2032 (US$M) |
| Figure 8‑27: Self-Etch Dental Bonding Agent Market, Global, 2022 – 2032 |
| Figure 8‑28: Units Sold by Region, Self-Etch Dental Bonding Agent Market, Global, 2022 – 2032 |
| Figure 8‑29: Average Selling Price by Region, Self-Etch Dental Bonding Agent Market, Global, 2022 – 2032 (US$) |
| Figure 8‑30: Market Value by Region, Self-Etch Dental Bonding Agent Market, Global, 2022 – 2032 (US$M) |
| Figure 8‑31: Universal Dental Bonding Agent Market, Global, 2022 – 2032 |
| Figure 8‑32: Units Sold by Region, Universal Dental Bonding Agent Market, Global, 2022 – 2032 |
| Figure 8‑33: Average Selling Price by Region, Universal Dental Bonding Agent Market, Global, 2022 – 2032 (US$) |
| Figure 8‑34: Market Value by Region, Universal Dental Bonding Agent Market, Global, 2022 – 2032 (US$M) |
| Figure 8‑35: Dental Bonding Agent Units Sold by Delivery Type, Global, 2022 – 2032 |
| Figure 8‑36: Units Sold by Region, Two-Paste/Syringe, Global, 2022 – 2032 |
| Figure 8‑37: Units Sold by Region, Brush (Unit Dose/Capsule/Vial/Bottle), Global, 2022 – 2032 |
| Figure 8‑38: Units Sold by Region, Auto-Mix, Global, 2022 – 2032 |
| Figure 8‑39: Dental Bonding Agent Units Sold by Curing Method, Global, 2022 – 2032 |
| Figure 8‑40: Units Sold by Region, Light-Cure, Global, 2022 – 2032 |
| Figure 8‑41: Units Sold by Region, Self-Cure, Global, 2022 – 2032 |
| Figure 8‑42: Units Sold by Region, Dual-Cure, Global, 2022 – 2032 |
| Figure 8‑43: Dental Bonding Agent Units Sold by Application Type, Global, 2022 – 2032 |
| Figure 8‑44: Units Sold by Region, Direct Application, Global, 2022 – 2032 |
| Figure 8‑45: Units Sold by Region, Indirect Application, Global, 2022 – 2032 |
| Figure 8‑46: Leading Competitors, Dental Bonding Agent Market, Global, 2025 |
| Figure 9‑1: Dental Core Build-Up Material Markets Covered |
| Figure 9‑2: Dental Core Build-Up Material Regions Covered, Global (1 of 2) |
| Figure 9‑3: Dental Core Build-Up Material Regions Covered, Global (2 of 2) |
| Figure 9‑4: Dental Core Build-Up Procedures by Region, Global, 2022 – 2032 |
| Figure 9‑5: Dental Core Build-Up Procedures by Country, North America, 2022 – 2032 |
| Figure 9‑6: Dental Core Build-Up Procedures by Country, Latin America, 2022 – 2032 (1 of 2) |
| Figure 9‑7: Dental Core Build-Up Procedures by Country, Latin America, 2022 – 2032 (2 of 2) |
| Figure 9‑8: Dental Core Build-Up Procedures by Country, Western Europe, 2022 – 2032 |
| Figure 9‑9: Dental Core Build-Up Procedures by Country, Central & Eastern Europe, 2022 – 2032 (1 of 2) |
| Figure 9‑10: Dental Core Build-Up Procedures by Country, Central & Eastern Europe, 2022 – 2032 (2 of 2) |
| Figure 9‑11: Dental Core Build-Up Procedures by Country, Middle East, 2022 – 2032 |
| Figure 9‑12: Dental Core Build-Up Procedures by Country, Asia-Pacific, 2022 – 2032 (1 of 3) |
| Figure 9‑13: Dental Core Build-Up Procedures by Country, Asia-Pacific, 2022 – 2032 (2 of 3) |
| Figure 9‑14: Dental Core Build-Up Procedures by Country, Asia-Pacific, 2022 – 2032 (3 of 3) |
| Figure 9‑15: Dental Core Build-Up Procedures by Country, Africa, 2022 – 2032 |
| Figure 9‑16: Dental Core Build-Up Material Market by Segment, Global, 2022 – 2032 (US$M) |
| Figure 9‑17: Dental Core Build-Up Material Market by Region, Global, 2022 – 2032 (US$M) |
| Figure 9‑18: Dental Core Build-Up Material Market, Global, 2022 – 2032 |
| Figure 9‑19: Units Sold by Region, Dental Core Build-Up Material Market, Global, 2022 – 2032 |
| Figure 9‑20: Average Selling Price by Region, Dental Core Build-Up Material Market, Global, 2022 – 2032 (US$) |
| Figure 9‑21: Market Value by Region, Dental Core Build-Up Material Market, Global, 2022 – 2032 (US$M) |
| Figure 9‑22: Composite Resin Dental Core Build-Up Material Market, Global, 2022 – 2032 |
| Figure 9‑23: Units Sold by Region, Composite Resin Dental Core Build-Up Material Market, Global, 2022 – 2032 |
| Figure 9‑24: Average Selling Price by Region, Composite Resin Dental Core Build-Up Material Market, Global, 2022 – 2032 (US$) |
| Figure 9‑25: Market Value by Region, Composite Resin Dental Core Build-Up Material Market, Global, 2022 – 2032 (US$M) |
| Figure 9‑26: GI and RMGI Dental Core Build-Up Material Market, Global, 2022 – 2032 |
| Figure 9‑27: Units Sold by Region, GI and RMGI Dental Core Build-Up Material Market, Global, 2022 – 2032 |
| Figure 9‑28: Average Selling Price by Region, GI and RMGI Dental Core Build-Up Material Market, Global, 2022 – 2032 (US$) |
| Figure 9‑29: Market Value by Region, GI and RMGI Dental Core Build-Up Material Market, Global, 2022 – 2032 (US$M) |
| Figure 9‑30: Other Dental Core Build-Up Material Market, Global, 2022 – 2032 |
| Figure 9‑31: Units Sold by Region, Other Dental Core Build-Up Material Market, Global, 2022 – 2032 |
| Figure 9‑32: Average Selling Price by Region, Other Dental Core Build-Up Material Market, Global, 2022 – 2032 (US$) |
| Figure 9‑33: Market Value by Region, Other Dental Core Build-Up Material Market, Global, 2022 – 2032 (US$M) |
| Figure 9‑34: Dental Core Build-Up Units Sold by Delivery Type, Global, 2022 – 2032 |
| Figure 9‑35: Units Sold by Region, Auto-Mix Syringe, Global, 2022 – 2032 |
| Figure 9‑36: Units Sold by Region, Hand-Mix, Global, 2022 – 2032 |
| Figure 9‑37: Units Sold by Region, Pre-Mix, Global, 2022 – 2032 |
| Figure 9‑38: Dental Core Build-Up Units Sold by Curing Method, Global, 2022 – 2032 |
| Figure 9‑39: Units Sold by Region, Light-Cure, Global, 2022 – 2032 |
| Figure 9‑40: Units Sold by Region, Self-Cure, Global, 2022 – 2032 |
| Figure 9‑41: Units Sold by Region, Dual-Cure, Global, 2022 – 2032 |
| Figure 9‑42: Leading Competitors, Dental Core Build-Up Material Market, Global, 2025 |
| Figure 10‑1: Dental Anesthetic Markets Covered |
| Figure 10‑2: Dental Anesthetic Regions Covered, Global (1 of 2) |
| Figure 10‑3: Dental Anesthetic Regions Covered, Global (2 of 2) |
| Figure 10‑4: Dental Anesthetic Procedures by Region, Global, 2022 – 2032 |
| Figure 10‑5: Dental Anesthetic Procedures by Country, North America, 2022 – 2032 |
| Figure 10‑6: Dental Anesthetic Procedures by Country, Latin America, 2022 – 2032 (1 of 2) |
| Figure 10‑7: Dental Anesthetic Procedures by Country, Latin America, 2022 – 2032 (2 of 2) |
| Figure 10‑8: Dental Anesthetic Procedures by Country, Western Europe, 2022 – 2032 (1 of 2) |
| Figure 10‑9: Dental Anesthetic Procedures by Country, Western Europe, 2022 – 2032 (2 of 2) |
| Figure 10‑10: Dental Anesthetic Procedures by Country, Central & Eastern Europe, 2022 – 2032 (1 of 2) |
| Figure 10‑11: Dental Anesthetic Procedures by Country, Central & Eastern Europe, 2022 – 2032 (2 of 2) |
| Figure 10‑12: Dental Anesthetic Procedures by Country, Middle East, 2022 – 2032 |
| Figure 10‑13: Dental Anesthetic Procedures by Country, Asia-Pacific, 2022 – 2032 (1 of 3) |
| Figure 10‑14: Dental Anesthetic Procedures by Country, Asia-Pacific, 2022 – 2032 (2 of 3) |
| Figure 10‑15: Dental Anesthetic Procedures by Country, Asia-Pacific, 2022 – 2032 (3 of 3) |
| Figure 10‑16: Dental Anesthetic Procedures by Country, Africa, 2022 – 2032 (1 of 2) |
| Figure 10‑17: Dental Anesthetic Procedures by Country, Africa, 2022 – 2032 (2 of 2) |
| Figure 10‑18: Dental Anesthetic Market by Segment, Global, 2022 – 2032 (US$M) |
| Figure 10‑19: Dental Anesthetic Market by Region, Global, 2022 – 2032 (US$M) |
| Figure 10‑20: Dental Anesthetic Market, Global, 2022 – 2032 |
| Figure 10‑21: Units Sold by Region, Dental Anesthetic Market, Global, 2022 – 2032 |
| Figure 10‑22: Average Selling Price by Region, Dental Anesthetic Market, Global, 2022 – 2032 (US$) |
| Figure 10‑23: Market Value by Region, Dental Anesthetic Market, Global, 2022 – 2032 (US$M) |
| Figure 10‑24: Topical Dental Anesthetic Market, Global, 2022 – 2032 |
| Figure 10‑25: Units Sold by Region, Topical Dental Anesthetic Market, Global, 2022 – 2032 |
| Figure 10‑26: Average Selling Price by Region, Topical Dental Anesthetic Market, Global, 2022 – 2032 (US$) |
| Figure 10‑27: Market Value by Region, Topical Dental Anesthetic Market, Global, 2022 – 2032 (US$M) |
| Figure 10‑28: Local Injection Dental Anesthetic Market, Global, 2022 – 2032 |
| Figure 10‑29: Units Sold by Region, Local Injection Dental Anesthetic Market, Global, 2022 – 2032 |
| Figure 10‑30: Average Selling Price by Region, Local Injection Dental Anesthetic Market, Global, 2022 – 2032 (US$) |
| Figure 10‑31: Market Value by Region, Local Injection Dental Anesthetic Market, Global, 2022 – 2032 (US$M) |
| Figure 10‑32: Dental Anesthetic Units Sold by Drug Type, Global, 2022 – 2032 |
| Figure 10‑33: Units Sold by Region, Lidocaine, Global, 2022 – 2032 |
| Figure 10‑34: Units Sold by Region, Articaine, Global, 2022 – 2032 |
| Figure 10‑35: Units Sold by Region, Mepivacaine, Global, 2022 – 2032 |
| Figure 10‑36: Units Sold by Region, Bupivacaine and Prilocaine, Global, 2022 – 2032 |
| Figure 10‑37: Leading Competitors, Dental Anesthetic Market, Global, 2025 |
| Figure 11‑1: Teeth Whitening and Prophylaxis Treatment Market Segmentation |
| Figure 11‑2: Teeth Treatment Market Covered, Global |
| Figure 111‑3: Teeth Whitening and Prophylaxis Treatment Market Covered, Global (2 of 2) |
| Figure 11‑4: Teeth Whitening and Prophylaxis Treatment Market by Segment, Global, 2022 – 2032 (US$M) |
| Figure 11‑5: Teeth Whitening Treatment Market by Region, Global, 2022 – 2032 (US$M) |
| Figure 11‑6: Market Value by Country, Teeth Whitening Treatment Market, Global, 2022 – 2032 (US$M) |
| Figure 11‑7: Dental Bleaching Materials, Global, 2022 – 2032 |
| Figure 11‑8: Units Sold by Country, Dental Bleaching Materials, Global, 2022 – 2032 (million mL) |
| Figure 11‑9: Average Selling Price by Country, Dental Bleaching Materials Market, Global, 2022 – 2032 (US$ per mL) |
| Figure 11‑10: Market Value by Country, Dental Bleaching Materials, Global, 2022 – 2032 (US$M) |
| Figure 11‑11: After-Bleaching Gel, Global, 2022 – 2032 |
| Figure 11‑12: Units Sold by Country, After-Bleaching Gel Market, Global, 2022 – 2032 (million mL) |
| Figure 11‑13: Average Selling Price by Country, After-Bleaching Gel Market, Global, 2022 – 2032 (US$ per mL) |
| Figure 11‑14: Market Value by Country, After-Bleaching Gel Market, Global, 2022 – 2032 (US$M) |
| Figure 11‑15: At-Home Teeth Whitening Market, Global, 2022 – 2032 |
| Figure 11‑16: Units Sold by Country, At-Home Teeth Whitening Market, Global, 2022 – 2032 |
| Figure 11‑17: Average Selling Price by Country, At-Home Teeth Whitening Market, Global, 2022 – 2032 (US$) |
| Figure 11‑18: Market Value by Country, At-Home Teeth Whitening Market, Global, 2022 – 2032 (US$M) |
| Figure 11‑19: Whitening Treatment Market by Setting, Global, 2022 – 2032 |
| Figure 11‑20: Clinic Market, Global, 2022 – 2032 |
| Figure 11‑21: Units Sold by Country, Clinic Market, Global, 2022 – 2032 (million) |
| Figure 11‑22: Average Selling Price by Country, Clinic Market, Global, 2022 – 2032 (US$) |
| Figure 11‑23: Market Value by Country, Clinic Market Market, Global, 2022 – 2032 (US$M) |
| Figure 11‑24: At-Home Whitening Market, Global, 2022 – 2032 |
| Figure 11‑25: Units Sold by Country, At-Home Whitening Market, Global, 2022 – 2032 (million) |
| Figure 11‑26: Average Selling Price by Country, At-Home Whitening Market, Global, 2022 – 2032 (US$) |
| Figure 11‑27: Market Value by Country, At-Home Whitening Market, Global, 2022 – 2032 (US$M) |
| Figure 11‑28: Leading Competitors, Dental Bleach Material and After-Bleaching Gel Market, Global, 2025 |
| Figure 12‑1: Prophylaxis Powder and Paste Market Segmentation |
| Figure 12‑2: Teeth Prophylaxis Powder and Paste Treatment Market Covered, Global |
| Figure 12‑3: Prophylaxis Powder and Paste Treatment Market Covered, Global (2 of 2) |
| Figure 12‑4: Prophylaxis Powder and Paste Treatment Market by Segment, Global, 2022 – 2032 (US$M) |
| Figure 12‑5: Prophylaxis Powder and Paste Treatment Market by Region, Global, 2022 – 2032 (US$M) |
| Figure 12‑6: Prophylaxis Powder and Paste Market, Global, 2022 – 2032 |
| Figure 12‑7: Units Sold by Country, Prophylaxis Powder and Paste Market, Global, 2022 – 2032 (million mL) |
| Figure 12‑8: Average Selling Price by Country, Prophylaxis Powder and Paste, Global, 2022 – 2032 (US$ per mL) |
| Figure 12‑9: Market Value by Country, Prophylaxis Powder and Paste, Global, 2022 – 2032 (US$M) |
| Figure 12‑10: Prophylaxis Powder, Global, 2022 – 2032 |
| Figure 12‑11: Units Sold by Country, Prophylaxis Powder Market, Global, 2022 – 2032 (million mL) |
| Figure 12‑12: Average Selling Price by Country, Prophylaxis Powder Market, Global, 2022 – 2032 (US$ per mL) |
| Figure 12‑13: Market Value by Country, Prophylaxis Powder Market, Global, 2022 – 2032 (US$M) |
| Figure 12‑14: Prophylaxis Paste Market, Global, 2022 – 2032 |
| Figure 12‑15: Units Sold by Country, Prophylaxis Paste Market, Global, 2022 – 2032 (million mL) |
| Figure 12‑16: Average Selling Price by Country, Prophylaxis Paste Market, Global, 2022 – 2032 (US$ per mL) |
| Figure 12‑17: Market Value by Country, Prophylaxis Paste Market, Global, 2022 – 2032 (US$M) |
| Figure 12‑18: Leading Competitors, Prophylaxis Powder and Paste Market, Global, 2025 |