| Figure 1‑1: Dental Implant and Final Abutment Market Share Ranking by Segment, Europe, 2024 |
| Figure 1‑2: Companies Researched in This Report |
| Figure 1‑3: Recent Events in the Dental Implant and Final Abutment Market, Europe, 2021 – 2025 (1 of 4) |
| Figure 1‑4: Recent Events in the Dental Implant and Final Abutment Market, Europe, 2021 – 2025 (2 of 4) |
| Figure 1‑5: Recent Events in the Dental Implant and Final Abutment Market, Europe, 2021 – 2025 (3 of 4) |
| Figure 1‑6: Recent Events in the Dental Implant and Final Abutment Market, Europe, 2021 – 2025 (4 of 4) |
| Figure 1‑7: Factors Impacting the Dental Implant and Final Abutment Market by Segment, Europe |
| Figure 1‑8: Dental Implant and Final Abutment Procedures Covered |
| Figure 1‑9: Dental Implant and Final Abutment Market Segmentation (1 of 2) |
| Figure 1‑10: Dental Implant and Final Abutment Market Segmentation (2 of 2) |
| Figure 1‑11: Key Report Updates |
| Figure 1‑12: Version History |
| Figure 3‑1: Currency Exchange Rate, 2024 |
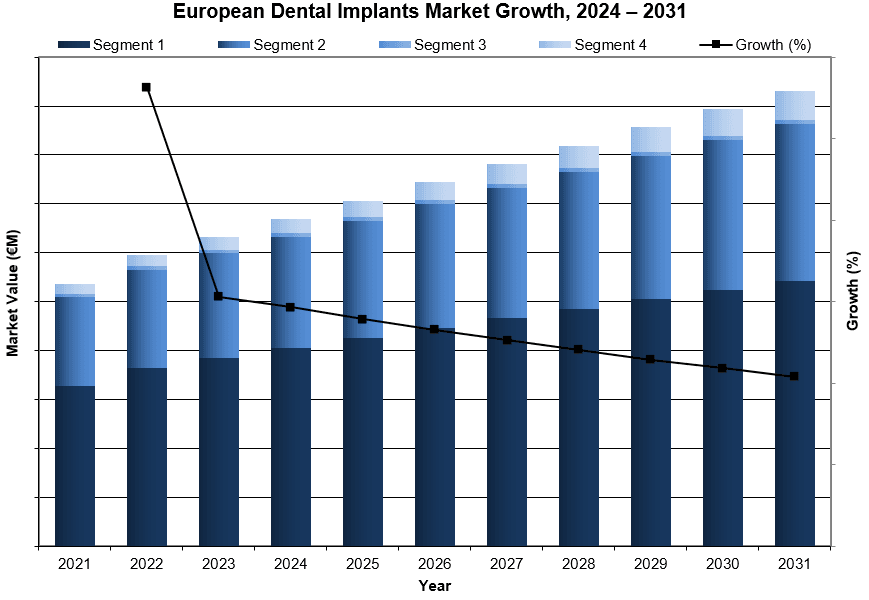
| Figure 3‑2: Dental Implant and Final Abutment Market by Segment, Europe, 2021 – 2031 (€M) |
| Figure 3‑3: Dental Implant and Final Abutment Market by Segment, Europe, 2021 – 2031 (US$M) |
| Figure 3‑4: Leading Competitors, Dental Implant and Final Abutment Market, Europe, 2024 |
| Figure 5‑1: Dental Implants Placed by End-User Specialization, Europe, 2021 – 2031 |
| Figure 5‑2: General Practitioner Implant Placement Penetration, Europe, 2021 – 2031 |
| Figure 5‑3: Number of General Practitioners by Country, Europe, 2021 – 2031 |
| Figure 5‑4: Percentage of General Practitioners Placing Implants by Country, Europe, 2021 – 2031 |
| Figure 5‑5: Average Number of Implants Placed by General Practitioners per Year by Country, Europe, 2021 – 2031 |
| Figure 5‑6: Number of Implants Placed by General Practitioners by Country, Europe, 2021 – 2031 |
| Figure 5‑7: Specialist Implant Placement Penetration, Europe, 2021 – 2031 |
| Figure 5‑8: Number of Specialists by Country, Europe, 2021 – 2031 |
| Figure 5‑9: Percentage of Specialists Placing Implants by Country, Europe, 2021 – 2031 |
| Figure 5‑10: Percentage of Specialists Placing Implants by Country, Europe, 2021 – 2031 |
| Figure 5‑11: Number of Implants Placed by Specialists by Country, Europe, 2021 – 2031 |
| Figure 6‑1: Dental Implant Market by Segment, Europe, 2021 – 2031 (€M) |
| Figure 6‑2: Dental Implant Market by Segment, Europe, 2021 – 2031 (US$M) |
| Figure 6‑3: Total Dental Implant Market, Europe, 2021 – 2031 |
| Figure 6‑4: Units Sold by Country, Dental Implant Market, Europe, 2021 – 2031 |
| Figure 6‑5: Average Selling Price by Country, Dental Implant Market, Europe, 2021 – 2031 (€) |
| Figure 6‑6: Average Selling Price by Country, Dental Implant Market, Europe, 2021 – 2031 (US$) |
| Figure 6‑7: Market Value by Country, Dental Implant Market, Europe, 2021 – 2031 (€M) |
| Figure 6‑8: Market Value by Country, Dental Implant Market, Europe, 2021 – 2031 (US$M) |
| Figure 6‑9: Premium Dental Implant Market, Europe, 2021 - 2031 |
| Figure 6‑10: Units Sold by Country, Premium Dental Implant Market, Europe, 2021-2031 |
| Figure 6‑11: Average Selling Price by Country, Premium Dental Implant Market, Europe, 2021 - 2031 (€) |
| Figure 6‑12: Average Selling Price by Country, Premium Dental Implant Market, Europe, 2021 - 2031 (US$) |
| Figure 6‑13: Market Value by Country, Premium Dental Implant Market, Europe, 2021 – 2031 (€M) |
| Figure 6‑14: Market Value by Country, Premium Dental Implant Market, Europe, 2021 – 2031 (US$M) |
| Figure 6‑15: Value Dental Implant Market, Europe, 2021 - 2031 |
| Figure 6‑16: Units Sold by Country, Value Dental Implant Market, Europe, 2021 – 2031 |
| Figure 6‑17: Average Selling Price by Country, Value Dental Implant Market, Europe, 2021 – 2031 (€) |
| Figure 6‑18: Average Selling Price by Country, Value Dental Implant Market, Europe, 2021 – 2031 (US$) |
| Figure 6‑19: Market Value by Country, Value Dental Implant Market, Europe, 2021 – 2031 (€M) |
| Figure 6‑20: Market Value by Country, Value Dental Implant Market, Europe, 2021 – 2031 (US$M) |
| Figure 6‑21: Discount Dental Implant Market, Europe, 2021 - 2031 |
| Figure 6‑22: Units Sold by Country, Discount Dental Implant Market, Europe, 2021 – 2031 |
| Figure 6‑23: Average Selling Price by Country, Discount Dental Implant Market, Europe, 2021 – 2031 (€) |
| Figure 6‑24: Average Selling Price by Country, Discount Dental Implant Market, Europe, 2021 – 2031 (US$) |
| Figure 6‑25: Market Value by Country, Discount Dental Implant Market, Europe, 2021 - 2031 (€M) |
| Figure 6‑26: Market Value by Country, Discount Dental Implant Market, Europe, 2021 - 2031 (US$M) |
| Figure 6‑27: Mini Implant Market, Europe, 2021 – 2031 |
| Figure 6‑28: Units Sold by Country, Mini Implant Market, Europe, 2021 – 2031 |
| Figure 6‑29: Average Selling Price by Country, Mini Implant Market, Europe, 2021 – 2031 (€) |
| Figure 6‑30: Average Selling Price by Country, Mini Implant Market, Europe, 2021 – 2031 (US$) |
| Figure 6‑31: Market Value by Country, Mini Implant Market, Europe, 2021 - 2031 (€M) |
| Figure 6‑32: Market Value by Country, Mini Implant Market, Europe, 2021 - 2031 (US$M) |
| Figure 6‑33: Dental Implant Market by Material, Europe, 2021 - 2031 (€M) |
| Figure 6‑34: Dental Implant Market by Material, Europe, 2021 – 2031 (US$M) |
| Figure 6‑35: Titanium Dental Implant Market, Europe, 2021 – 2031 |
| Figure 6‑36: Units Sold by Country, Titanium Dental Implant Market, Europe, 2021 – 2031 |
| Figure 6‑37: Average Selling Price by Country, Titanium Dental Implant Market, Europe, 2021 – 2031 (€) |
| Figure 6‑38: Average Selling Price by Country, Titanium Dental Implant Market, Europe, 2021 – 2031 (US$) |
| Figure 6‑39: Market Value by Country, Titanium Dental Implant Market, Europe, 2021 – 2031 (€M) |
| Figure 6‑40: Market Value by Country, Titanium Dental Implant Market, Europe, 2021 – 2031 (US$M) |
| Figure 6‑41: Ceramic/Zirconia Dental Implant Market, Europe, 2021 – 2031 |
| Figure 6‑42: Units Sold by Country, Ceramic/Zirconia Dental Implant Market, Europe, 2021 – 2031 |
| Figure 6‑43: Average Selling Price by Country, Ceramic/Zirconia Dental Implant Market, Europe, 2021 – 2031 (€) |
| Figure 6‑44: Average Selling Price by Country, Ceramic/Zirconia Dental Implant Market, Europe, 2021 – 2031 (US$) |
| Figure 6‑45: Market Value by Country, Ceramic/Zirconia Dental Implant Market, Europe, 2021 – 2031 (€M) |
| Figure 6‑46: Market Value by Country, Ceramic/Zirconia Dental Implant Market, Europe, 2021 – 2031 (US$M) |
| Figure 6‑47: Dental Implant Unit Sales by Procedure Type, Europe, 2021 – 2031 |
| Figure 6‑48: One-Stage Surgery Implant Unit Sales, Europe, 2021 – 2031 |
| Figure 6‑49: Two-Stage Surgery Implant Unit Sales, Europe, 2021 – 2031 |
| Figure 6‑50: Immediate Loading Implant Unit Sales, Europe, 2021 – 2031 |
| Figure 6‑51: Dental Implant Unit Sales by Shape, Europe, 2021 – 2031 |
| Figure 6‑52: Parallel Wall Implant Unit Sales, Europe, 2021 – 2031 |
| Figure 6‑53: Fully Tapered Implant Unit Sales, Europe, 2021 – 2031 |
| Figure 6‑54: Apically Tapered Implant Unit Sales, Europe, 2021 – 2031 |
| Figure 6‑55: Dental Implant Unit Sales by Connection Type, Europe, 2021 – 2031 |
| Figure 6‑56: Internal Connection Implant Unit Sales, Europe, 2021 – 2031 |
| Figure 6‑57: External Connection Implant Unit Sales, Europe, 2021 – 2031 |
| Figure 6‑58: One-Piece Connection Implant Unit Sales, Europe, 2021 – 2031 |
| Figure 6‑59: Dental Implant Unit Sales by Application, Europe, 2021 – 2031 |
| Figure 6‑60: Single-Tooth Replacement Implant Unit Sales, Europe, 2021 – 2031 |
| Figure 6‑61: Multi-Tooth Partial- and Full-Arch Bridge Securement, Implant Unit Sales Share by Type, Europe, 2021 – 2031 |
| Figure 6‑62: Multi-Tooth Partial- and Full-Arch Bridge Securement, Implant Unit Sales, Europe, 2021 – 2031 |
| Figure 6‑63: Multi-Tooth Partial-Arch Bridge Securement, Implant Unit Sales, Europe, 2021 – 2031 |
| Figure 6‑64: Multi-Tooth Full-Arch Bridge Securement, Implant Unit Sales, Europe, 2021 – 2031 |
| Figure 6‑65: Denture Securement Implant, Unit Sales by Denture Type, Europe, 2021 – 2031 |
| Figure 6‑66: Implant-Supported Removable Overdenture, Implant Unit Sales, Europe, 2021 – 2031 |
| Figure 6‑67: Removable Implant Bar Overdenture, Implant Unit Sales, Europe, 2021 – 2031 |
| Figure 6‑68: Fixed-Hybrid Overdenture, Implant Unit Sales, Europe, 2021 – 2031 |
| Figure 6‑69: Leading Competitors, Dental Implant Market, Europe, 2024 |
| Figure 6‑70: Leading Competitors by Country, Dental Implant Market, Europe, 2024 |
| Figure 7‑1: Final Abutment Market by Segment, Europe, 2021 – 2031 (€M) |
| Figure 7‑2: Final Abutment Market by Segment, Europe, 2021 – 2031 (US$M) |
| Figure 7‑3: Final Abutment Market, Europe, 2021 – 2031 |
| Figure 7‑4: Units Sold by Country, Final Abutment Market, Europe, 2021 – 2031 |
| Figure 7‑5: Average Selling Price by Country, Final Abutment Market, Europe, 2021 – 2031 (€) |
| Figure 7‑6: Average Selling Price by Country, Final Abutment Market, Europe, 2021 – 2031 (US$) |
| Figure 7‑7: Market Value by Country, Final Abutment Market, Europe, 2021 – 2031 (€M) |
| Figure 7‑8: Market Value by Country, Final Abutment Market, Europe, 2021 – 2031 (US$M) |
| Figure 7‑9: Stock Abutment Market, Europe, 2021 – 2031 |
| Figure 7‑10: Units Sold by Country, Stock Abutment Market, Europe, 2021 – 2031 |
| Figure 7‑11: Average Selling Price by Country, Stock Abutment Market, Europe, 2021 – 2031 (€) |
| Figure 7‑12: Average Selling Price by Country, Stock Abutment Market, Europe, 2021 – 2031 (US$) |
| Figure 7‑13: Market Value by Country, Stock Abutment Market, Europe, 2021 – 2031 (€M) |
| Figure 7‑14: Market Value by Country, Stock Abutment Market, Europe, 2021 – 2031 (US$M) |
| Figure 7‑15: Custom Cast Abutment Market, Europe, 2021 – 2031 |
| Figure 7‑16: Units Sold by Country, Custom Cast Abutment Market, Europe, 2021 – 2031 |
| Figure 7‑17: Average Selling Price by Country, Custom Cast Abutment Market, Europe, 2021 – 2031 (€) |
| Figure 7‑18: Average Selling Price by Country, Custom Cast Abutment Market, Europe, 2021 – 2031 (US$) |
| Figure 7‑19: Market Value by Country, Custom Cast Abutment Market, Europe, 2021 – 2031 (€M) |
| Figure 7‑20: Market Value by Country, Custom Cast Abutment Market, Europe, 2021 – 2031 (US$M) |
| Figure 7‑21: CAD/CAM Abutment Market, Europe, 2021 – 2031 |
| Figure 7‑22: Units Sold by Country, CAD/CAM Abutment Market, Europe, 2021 – 2031 |
| Figure 7‑23: Average Selling Price by Country, CAD/CAM Abutment Market, Europe, 2021 – 2031 (€) |
| Figure 7‑24: Average Selling Price by Country, CAD/CAM Abutment Market, Europe, 2021 – 2031 (US$) |
| Figure 7‑25: Market Value by Country, CAD/CAM Abutment Market, Europe, 2021 – 2031 (€M) |
| Figure 7‑26: Market Value by Country, CAD/CAM Abutment Market, Europe, 2021 – 2031 (US$M) |
| Figure 7‑27: Final Abutment Market by Material, Europe, 2021 – 2031 (€M) |
| Figure 7‑28: Final Abutment Market by Material, Europe, 2021 – 2031 (US$M) |
| Figure 7‑29: Titanium Final Abutment Market, Europe, 2021 – 2031 |
| Figure 7‑30: Units Sold by Country, Titanium Final Abutment Market, Europe, 2021 – 2031 |
| Figure 7‑31: Average Selling Price by Country, Titanium Final Abutment Market, Europe, 2021 – 2031 (€) |
| Figure 7‑32: Average Selling Price by Country, Titanium Final Abutment Market, Europe, 2021 – 2031 (US$) |
| Figure 7‑33: Market Value by Country, Titanium Final Abutment Market, Europe, 2021 – 2031 (€M) |
| Figure 7‑34: Market Value by Country, Titanium Final Abutment Market, Europe, 2021 – 2031 (US$M) |
| Figure 7‑35: Ceramic/Zirconia Final Abutment Market, Europe, 2021 – 2031 |
| Figure 7‑36: Units Sold by Country, Ceramic/Zirconia Final Abutment Market, Europe, 2021 – 2031 |
| Figure 7‑37: Average Selling Price by Country, Ceramic/Zirconia Final Abutment Market, Europe, 2021 – 2031 (€) |
| Figure 7‑38: Average Selling Price by Country, Ceramic/Zirconia Final Abutment Market, Europe, 2021 – 2031 (US$) |
| Figure 7‑39: Market Value by Country, Ceramic/Zirconia Final Abutment Market, Europe, 2021 – 2031 (€M) |
| Figure 7‑40: Market Value by Country, Custom Cast Abutment Market, Europe, 2021 – 2031 (US$M) |
| Figure 7‑41: Gold Final Abutment Market, Europe, 2021 – 2031 |
| Figure 7‑42: Units Sold by Country, Gold Final Abutment Market, Europe, 2021 – 2031 |
| Figure 7‑43: Average Selling Price by Country, Gold Final Abutment Market, Europe, 2021 – 2031 (€) |
| Figure 7‑44: Average Selling Price by Country, Gold Final Abutment Market, Europe, 2021 – 2031 (US$) |
| Figure 7‑45: Market Value by Country, Gold Final Abutment Market, Europe, 2021 – 2031 (€M) |
| Figure 7‑46: Market Value by Country, Gold Final Abutment Market, Europe, 2021 – 2031 (US$M) |
| Figure 7‑47: Final Abutment Unit Sales by Type, Europe, 2021 – 2031 |
| Figure 7‑48: Cement-Retained Abutment Unit Sales, Europe, 2021 – 2031 |
| Figure 7‑49: Screw-Retained Abutment Unit Sales, Europe, 2021 – 2031 |
| Figure 7‑50: Denture Retaining Abutment Unit Sales, Europe, 2021 – 2031 |
| Figure 7‑51: Final Abutment Units Sale by Abutment Type, Europe, 2021 – 2031 |
| Figure 7‑52: Ti-Base Abutment Unit Sales, Europe, 2021 – 2031 |
| Figure 7‑53: Traditional Stock Abutment Unit Sales, Europe, 2021 – 2031 |
| Figure 7‑54: Leading Competitors, Final Abutment Market, Europe, 2024 |
| Figure 8‑1: Treatment Planning Software Market by Segment, Europe, 2021 – 2031 (€M) |
| Figure 8‑2: Treatment Planning Software Market by Segment, Europe, 2021 – 2031 (US$M) |
| Figure 8‑3: Treatment Planning Software Market, Europe, 2021 – 2031 |
| Figure 8‑4: New Systems Installed by Country, Treatment Planning Software Market, Europe, 2021 – 2031 |
| Figure 8‑5: Installed Base by Country, Treatment Planning Software Market, Europe, 2021 – 2031 |
| Figure 8‑6: Average Selling Price by Country, Treatment Planning Software Market, Europe, 2021 – 2031 (€) |
| Figure 8‑7: Average Selling Price by Country, Treatment Planning Software Market, Europe, 2021 – 2031 (US$) |
| Figure 8‑8: Market Value by Country, Treatment Planning Software Market, Europe, 2021 – 2031 (€M) |
| Figure 8‑9: Market Value by Country, Treatment Planning Software Market, Europe, 2021 – 2031 (US$M) |
| Figure 8‑10: Treatment Planning Software Maintenance Fees Market, Europe, 2021 – 2031 |
| Figure 8‑11: Average Selling Price by Country, Treatment Planning Software Maintenance Fees Market, Europe, 2021 – 2031 (€) |
| Figure 8‑12: Average Selling Price by Country, Treatment Planning Software Maintenance Fees Market, Europe, 2021 – 2031 (US$) |
| Figure 8‑13: Market Value by Country, Treatment Planning Software Maintenance Fees Market, Europe, 2021 – 2031 (€M) |
| Figure 8‑14: Market Value by Country, Treatment Planning Software Maintenance Fees Market, Europe, 2021 – 2031 (US$M) |
| Figure 8‑15: Leading Competitors, Treatment Planning Software Market, Europe, 2024 |
| Figure 9‑1: Surgical Guide Market by Segment, Europe, 2021 – 2031 (€M) |
| Figure 9‑2: Surgical Guide Market by Segment, Europe, 2021 – 2031 (US$M) |
| Figure 9‑3: Total Surgical Guide Market, Europe, 2021 – 2031 |
| Figure 9‑4: Units Sold by Country, Surgical Guide Market, Europe, 2021 – 2031 |
| Figure 9‑5: Average Selling Price by Country, Surgical Guide Market, Europe, 2021 – 2031 (€) |
| Figure 9‑6: Average Selling Price by Country, Surgical Guide Market, Europe, 2021 – 2031 (US$) |
| Figure 9‑7: Market Value by Country, Surgical Guide Market, Europe, 2021 – 2031 (€M) |
| Figure 9‑8: Market Value by Country, Surgical Guide Market, Europe, 2021 – 2031 (US$M) |
| Figure 9‑9: Traditional Manufacturer Surgical Guide Market, Europe, 2021 – 2031 |
| Figure 9‑10: Units Sold by Country, Traditional Manufacturer Surgical Guide Market, Europe, 2021 – 2031 |
| Figure 9‑11: Average Selling Price by Country, Traditional Manufacturer Surgical Guide Market, Europe, 2021 – 2031 (€) |
| Figure 9‑12: Average Selling Price by Country, Traditional Manufacturer Surgical Guide Market, Europe, 2021 – 2031 (US$) |
| Figure 9‑13: Market Value by Country, Traditional Manufacturer Surgical Guide Market, Europe, 2021 – 2031 (€M) |
| Figure 9‑14: Market Value by Country, Traditional Manufacturer Surgical Guide Market, Europe, 2021 – 2031 (US$M) |
| Figure 9‑15: Third-Party Surgical Guide Market, Europe, 2021 – 2031 |
| Figure 9‑16: Units Sold by Country, Third-Party Surgical Guide Market, Europe, 2021 – 2031 |
| Figure 9‑17: Average Selling Price by Country, Third-Party Surgical Guide Market, Europe, 2021 – 2031 (€) |
| Figure 9‑18: Average Selling Price by Country, Third-Party Surgical Guide Market, Europe, 2021 – 2031 (US$) |
| Figure 9‑19: Market Value by Country, Third-Party Surgical Guide Market, Europe, 2021 – 2031 (€M) |
| Figure 9‑20: Market Value by Country, Third-Party Surgical Guide Market, Europe, 2021 – 2031 (US$M) |
| Figure 9‑21: In-House Surgical Guide Market, Europe, 2021 – 2031 |
| Figure 9‑22: Units Sold by Country, In-House Surgical Guide Market, Europe, 2021 – 2031 |
| Figure 9‑23: Average Selling Price by Country, In-House Surgical Guide Market, Europe, 2021 – 2031 (€) |
| Figure 9‑24: Average Selling Price by Country, In-House Surgical Guide Market, Europe, 2021 – 2031 (US$) |
| Figure 9‑25: Market Value by Country, In-House Surgical Guide Market, Europe, 2021 – 2031 (€M) |
| Figure 9‑26: Market Value by Country, In-House Surgical Guide Market, Europe, 2021 – 2031 (US$M) |
| Figure 9‑27: Leading Competitors, Surgical Guide Market, Europe, 2024 |