Dental Bone Graft Substitute Market Size, Share & Trends Analysis | Europe | 2025-2031 | MedSuite | Includes: Allografts, Xenografts, Synthetics, Dental Growth Factors & Dental Barrier Membranes

  • Year: 2025
  • Scope: 10 Years
  • Region: Europe
  • Pages: 260
  • Published Date: 05/23/2025
  • Type: MedSuite

Product Description

The European dental bone graft substitute and other biomaterials market was valued at nearly €355 million in 2024. This is expected to increase over the forecast period at a CAGR of 3.4% to reach nearly €450 million in 2031.

The full report suite on the European market for dental bone graft substitutes (DBGSs) and other biomaterials includes DBGSs, dental growth factors, dental barrier membranes (DBMs), local antimicrobial periodontal treatment and dental soft tissue regeneration. The DBGS market is further segmented by material type into allografts, xenografts and synthetics. As autografts are harvested from a patient and are not sold in the market, they are not included in the analysis of the overall DBGS market. The dental growth factor market only includes sales of Straumann Group’s Emdogain® product. The DBM market is further segmented into resorbable and non-resorbable segments. The dental soft tissue regeneration market is further segmented into regenerative products and wound care products.

MARKET DATA INCLUDED

  • Unit SalesAverage Selling PricesMarket Size & Growth Trends
  • Procedure Numbers
  • Market Drivers & Limiters
  • Market Forecasts Until 2031, and Historical Data to 2024
  • Recent Mergers & Acquisitions
  • Company Profiles and Product Portfolios
  • Leading Competitors

EUROPEAN DENTAL BONE GRAFT SUBSTITUTE MARKET TRENDS

Dental Bone Graft Substitute Market Growth

While xenografts currently hold the largest share of the dental bone graft substitute market, allografts are gaining popularity among dental professionals in Europe. Compared to autografts, allograft materials offer advantages such as greater availability and reduced invasiveness. Patients benefit by avoiding an additional surgical procedure, which minimizes the risk of complications and simplifies the overall treatment process. As a result, the allograft segment is the fastest-growing area within the dental bone graft substitute market.

EUROPEAN DENTAL BONE GRAFT SUBSTITUTE MARKET SHARE INSIGHTS

Top European Dental Bone Graft Substitute Market Leaders

  • Geistlich remained the leading competitor in the total European DBGS and biomaterials market in 2024, supported by its dominant positions in both the DBGS and DBM segments. Its leadership in the DBGS market is primarily attributed to a strong presence in the xenograft segment, where it accounted for over 50% of the market value. Geistlich’s flagship products include the Bio-Oss® xenografts and Bio-Gide® dental membranes.
  • botiss biomaterials held the second-largest share of the total DBGS and biomaterials market in 2024. A key factor behind its strong market position is its strategic partnership with the Straumann Group, which holds a 30% stake in the company. Straumann’s leadership in the European dental implant market, combined with botiss’ flagship products cerabone® and maxgraft®, has further strengthened botiss’ position in the DBGS segment.
  • PerioChip® was the leading competitor in the European local antimicrobial periodontal treatment market in 2024 and ranked third in the overall DBGS and other biomaterials market. The product is distributed globally through an extensive network. In Europe, it is marketed by Dexcel Pharma through its subsidiaries and partners in Germany, the U.K., Benelux, Austria and other countries. Additionally, PerioChip® is distributed by Curaden Healthcare in Italy and by Karr Denta in Switzerland.

MARKET SEGMENTATION SUMMARY

  • Dental Bone Graft Substitutes – Further Segmented Into:
    • Type: Allografts, Xenografts, and Synthetics.
    • Application: Socket Preservation, Sinus Augmentation, Ridge Augmentation, and Peridontal Application.
  • Dental Growth Factor
  • Dental Barrier Membranes – Further Segmented Into:
    • Type: Resorbable and Non-Resorbable Membranes.
  • Local Antimicrobial Periodontal Treatment
  • Dental Soft Tissue Wound Care – Further Segmented Into:
    • Type: Regeneration and Dental Wound Care (Plug, Tape, and Foam).

 RESEARCH SCOPE SUMMARY

Report Attribute Details
Region Europe  (Germany, France, the U.K., Italy, Spain, Benelux (Belgium, Netherlands and Luxembourg), Scandinavia (Denmark, Norway and Sweden) as well as Austria, Switzerland and Portugal)
Base Year 2024
Forecast  2025-2031
Historical Data  2021-2023
Quantitative Coverage Procedure Numbers, Market Size, Market Shares, Market Forecasts, Market Growth Rates, Units Sold, and Average Selling Prices.
Qualitative Coverage Market Growth Trends, Market Limiters, Competitive Analysis & SWOT for Top Competitors, Mergers & Acquisitions, Company Profiles, Product Portfolios, FDA Recalls, Disruptive Technologies, Disease Overviews.
Data Sources Primary Interviews with Industry Leaders, Government Physician Data, Regulatory Data, Hospital Private Data, Import & Export Data, iData Research Internal Database.

CONTACT US FOR ADDITIONAL INFORMATION

For full segmentation and any questions regarding research coverage, please contact us for a complimentary demo of the full report.

FREE Sample Report


Table of Contents

TABLE of CONTENTS
List of Figures
List of Charts
executive summary
European Dental Bone Graft Substitute and Other Biomaterials Market Overview
Competitive Analysis
Market Developments
Market Trends
Procedure Segmentation
Market Segmentation
Key Report Updates
Version History
research methodology
Step 1: Project Initiation & Team Selection
Step 2: Prepare Data Systems and Perform Secondary Research
Step 3: Preparation for Interviews & Questionnaire Design
Step 4: Performing Primary Research
Step 5: Research Analysis: Establishing Baseline Estimates
Step 6: Market Forecast and Analysis
Step 7: Identify Strategic Opportunities
Step 8: Final Review and Market Release
Step 9: Customer Feedback and Market Monitoring
Impact of Global Tariffs
European Dental Bone Graft Substitute and Other Biomaterials Market Overview
3.1 Introduction
3.1.1 Applications of Dental Bone Graft Substitutes
3.1.1.1 Dental Implant Procedures
3.1.1.2 Periodontal Procedures
3.1.2 Types of Dental Bone Graft Substitutes
3.1.2.1 Allografts
3.1.2.2 Demineralized Bone Matrix Allografts
3.1.2.3 Xenografts
3.1.2.4 Synthetics
3.1.3 Dental Growth Factor Products
3.1.4 Dental Membranes
3.1.5 Antimicrobial Periodontal Treatment
3.1.6 Dental Soft Tissue Regeneration
3.2 Currency Exchange Rate
3.3 Market Overview & Trend Analysis
3.4 Drivers and Limiters
3.4.1 Market Drivers
3.4.2 Market Limiters
3.5 Competitive Market Share Analysis
3.6 Mergers and Acquisitions
Country Profiles
4.1 Introduction
4.1.1 Population
4.1.2 GDP Per Capita
4.1.3 Price Index
4.2 Germany
4.3 France
4.4 United Kingdom
4.5 Italy
4.6 Spain
4.7 Benelux
4.8 Scandinavia
4.9 Austria
4.10 Switzerland
4.11 Portugal
Procedure Numbers
5.1 Europe Tooth Loss Statistics
5.1.1 Dental Bone Grafting Procedures
5.1.2 Dental Implant Procedures and DBGS Penetration Rates
5.1.3 Dental Bone Grafting Procedures by Application
Dental Bone Graft Substitute Market
6.1 Introduction
6.1.1 Autografts
6.1.2 Allografts
6.1.2.1 Mineralized Allografts
6.1.2.2 Demineralized Bone Matrix Allografts
6.1.3 Xenografts
6.1.4 Synthetics
6.2 Market Overview
6.3 Market Analysis and Forecast
6.3.1 Total Dental Bone Graft Substitute Market
6.3.2 Allograft Market by Segment
6.3.2.1 Mineralized Allograft Market
6.3.2.2 Demineralized Bone Matrix Allograft Market
6.3.3 Xenograft Market
6.3.4 Synthetic Market
6.3.5 Dental Bone Graft Substitute Unit Sales by Procedure Type
6.3.5.1 Socket Preservation
6.3.5.2 Sinus Augmentation
6.3.5.3 Ridge Augmentation
6.3.5.4 Periodontal Application
6.4 Drivers and Limiters
6.4.1 Market Drivers
6.4.2 Market Limiters
6.5 Competitive Market Share Analysis
Dental Growth Factor Market
7.1 Introduction
7.2 Market Analysis and Forecast
7.3 Drivers and Limiters
7.3.1 Market Drivers
7.3.2 Market Limiters
Dental Barrier Membrane Market
8.1 Introduction
8.2 Market Overview
8.3 Market Analysis and Forecast
8.3.1 Total Dental Barrier Membrane Market
8.3.2 Resorbable Dental Barrier Membrane Market
8.3.3 Non-Resorbable Dental Barrier Membrane Market
8.4 Unit Analysis
8.4.1 Dental Barrier Membrane Units Sold by Size
8.4.1.1 Resorbable Dental Barrier Membrane Units Sold by Size
8.4.1.2 Non-Resorbable Dental Barrier Membrane Units Sold by Size
8.5 Drivers and Limiters
8.5.1 Market Drivers
8.5.2 Market Limiters
8.6 Competitive Market Share Analysis
local Antimicrobial Periodontal Treatment Market
9.1 Introduction
9.2 Market Analysis and Forecast
9.3 Drivers and Limiters
9.3.1 Market Drivers
9.3.2 Market Limiters
9.4 Competitive Market Share Analysis
Dental Soft Tissue Regeneration Market
10.1 Introduction
10.2 Market Overview
10.3 Market Analysis and Forecast
10.3.1 Dental Soft Tissue Regeneration Market
10.3.2 Dental Wound Care Market
10.3.2.1 Plug Dental Wound Care Market
10.3.2.2 Tape Dental Wound Care Market
10.3.2.3 Foam Dental Wound Care Market
10.4 Drivers and Limiters
10.4.1 Market Drivers
10.4.2 Market Limiters
10.5 Competitive Market Share Analysis
Abbreviations

Companies Included

·         AbbVie ·         Gelcide
·         ACE SOUTHERN ·         Gengigel
·         Aftamed ·         Halma
·         Aminogam ·         Healon GV
·         Augma Biomaterials ·         Henry Schein
·         BEGO ·         Heraeus
·         Bicon Dental Implants ·         Keramat
·         BIOBank ·         Keystone Dental
·         BioC ·         LifeNet Health
·         BioHorizons ·         Ligosan
·         Biomatlante ·         Medosis
·         Bioteck ·         MegaGen
·         botiss biomaterials ·         Neoss
·         Cervitec Plus ·         Nobel Biocare
·         Chlo-Site ·         Non-Profit Tissue Banks
·         Citagenix ·         Noraker
·         Datum Dental ·         Orthocell
·         Degradable Solutions ·         Osstem Implant
·         Dentegris ·         OT Medical
·         Dentomycin ·         PerioChip
·         Dentsply Sirona ·         Purgo
·         DIZG ·         Resorba
·         EC40 ·         Salvin
·         Elyzol ·         Straumann Group
·         Envista ·         Tecnoss Dental
·         Geistlich ·         ZimVie

Chart List

Chart 1‑1: Dental Bone Graft Substitute and Other Biomaterials Market by Segment, Europe, 2024 – 2031
Chart 1‑2: Dental Bone Graft Substitute and Other Biomaterials Market Overview, Europe, 2024 & 2031
Chart 3‑1: Dental Bone Graft Substitute and Other Biomaterials Market by Segment, Europe, 2021 – 2031
Chart 3‑2: Leading Competitors, Dental Bone Graft Substitute and Other Biomaterials Market, Europe, 2024
Chart 4‑1: Country Profile, Germany, 2024
Chart 4‑2: Country Profile, France, 2024
Chart 4‑3: Country Profile, United Kingdom, 2024
Chart 4‑4: Country Profile, Italy, 2024
Chart 4‑5: Country Profile, Spain, 2024
Chart 4‑6: Country Profile, Benelux, 2024
Chart 4‑7: Country Profile, Scandinavia, 2024
Chart 4‑8: Country Profile, Austria, 2024
Chart 4‑9: Country Profile, Switzerland, 2024
Chart 4‑10: Country Profile, Portugal, 2024
Chart 5‑1: Dental Implants Placed with Dental Bone Grafting Substitute, Europe, 2021 – 2031
Chart 6‑1: Dental Bone Graft Substitute Market by Segment, Europe, 2021 – 2031
Chart 6‑2: Leading Competitors, Dental Bone Graft Substitute Market, Europe, 2024
Chart 7‑1: Dental Growth Factor Market, Europe, 2021 – 2031
Chart 8‑1: Dental Barrier Membrane Market by Segment, Europe, 2021 – 2031
Chart 8‑2: Leading Competitors, Dental Barrier Membrane Market, Europe, 2024
Chart 9‑1: Local Antimicrobial Periodontal Treatment Market, Europe, 2021 – 2031
Chart 9‑2: Leading Competitors, Local Antimicrobial Periodontal Treatment Market, Europe, 2024
Chart 10‑1: Dental Barrier Membrane Market by Segment, Europe, 2021 – 2031
Chart 10‑2: Leading Competitors, Dental Soft Tissue Regeneration Market, Europe, 2024

Figure List

Figure 1‑1: Dental Bone Graft Substitute and Other Biomaterials Market Share Ranking by Segment, Europe, 2024
Figure 1‑2: Companies Researched in This Report
Figure 1‑3: Recent Events in the Dental Bone Graft Substitute and Other Biomaterials Market, Europe, 2021 – 2025 (1 of 3)
Figure 1‑4: Recent Events in the Dental Bone Graft Substitute and Other Biomaterials Market, Europe, 2021 – 2025 (2 of 3)
Figure 1‑5: Recent Events in the Dental Bone Graft Substitute and Other Biomaterials Market, Europe, 2021 – 2025 (3 of 3)
Figure 1‑6: Factors Impacting the Dental Bone Graft Substitute and Other Biomaterials Market by Segment, Europe
Figure 1‑7: Dental Bone Graft Substitute and Other Biomaterials Procedure Segmentation
Figure 1‑8: Dental Bone Graft and Other Biomaterials Market Segmentation
Figure 1‑9: Key Report Updates
Figure 1‑10: Version History
Figure 3‑1: Currency Exchange Rate, 2024
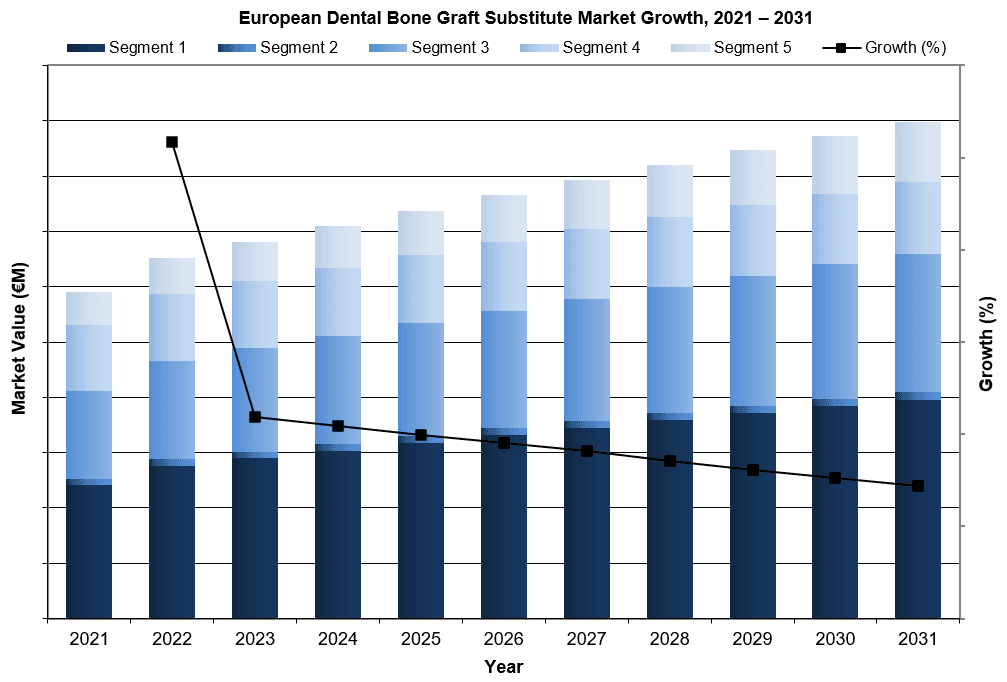
Figure 3‑2: Dental Bone Graft Substitute and Other Biomaterials Market by Segment, Europe, 2021 – 2031 (€M)
Figure 3‑3: Dental Bone Graft Substitute and Other Biomaterials Market by Segment, Europe, 2021 – 2031 (US$M)
Figure 3‑4: Leading Competitors, Dental Bone Graft Substitute and Other Biomaterials Market, Europe, 2024
Figure 5‑1: Dental Bone Grafting Procedure Penetration Rate, Europe, 2021 – 2031
Figure 5‑2: Dental Bone Grafting Procedures by Application, Europe, 2021 – 2031
Figure 5‑3: Socket Preservation Procedures by Country, Europe, 2021 – 2031
Figure 5‑4: Sinus Augmentation Procedures by Country, Europe, 2021 – 2031
Figure 5‑5: Ridge Augmentation Procedures by Country, Europe, 2021 – 2031
Figure 5‑6: Periodontal Procedures Done with DBGS by Country, Europe, 2021 – 2031
Figure 6‑1: Dental Bone Graft Substitute Market by Segment, Europe, 2021 – 2031 (€M)
Figure 6‑2: Dental Bone Graft Substitute Market by Segment, Europe, 2021 – 2031 (US$M)
Figure 6‑3: Dental Bone Graft Substitute Market, Europe, 2021 – 2031
Figure 6‑4: Units Sold by Country, Dental Bone Graft Substitute Market, Europe, 2021 – 2031
Figure 6‑5: Average Selling Price by Country, Dental Bone Graft Substitute Market, Europe, 2021 – 2031 (€)
Figure 6‑6: Average Selling Price by Country, Dental Bone Graft Substitute Market, Europe, 2021 – 2031 (US$)
Figure 6‑7: Market Value by Country, Dental Bone Graft Substitute Market, Europe, 2021 – 2031 (€M)
Figure 6‑8: Market Value by Country, Dental Bone Graft Substitute Market, Europe, 2021 – 2031 (US$M)
Figure 6‑9: Allograft Market by Segment, Europe, 2021 – 2031 (€M)
Figure 6‑10: Allograft Market by Segment, Europe, 2021 – 2031 (US$M)
Figure 6‑11: Total Allograft Market, Europe, 2021 – 2031
Figure 6‑12: Units Sold by Country, Total Allograft Market, Europe, 2021 – 2031
Figure 6‑13: Average Selling Price by Country, Total Allograft Market, Europe, 2021 – 2031 (€)
Figure 6‑14: Average Selling Price by Country, Total Allograft Market, Europe, 2021 – 2031 (US$)
Figure 6‑15: Market Value by Country, Total Allograft Market, Europe, 2021 – 2031 (€M)
Figure 6‑16: Market Value by Country, Total Allograft Market, Europe, 2021 – 2031 (US$M)
Figure 6‑17: Mineralized Allograft Market, Europe, 2021 – 2031
Figure 6‑18: Units Sold by Country, Mineralized Allograft Market, Europe, 2021 – 2031
Figure 6‑19: Average Selling Price by Country, Mineralized Allograft Market, Europe, 2021 – 2031 (€)
Figure 6‑20: Average Selling Price by Country, Mineralized Allograft Market, Europe, 2021 – 2031 (US$)
Figure 6‑21: Market Value by Country, Mineralized Allograft Market, Europe, 2021 – 2031 (€M)
Figure 6‑22: Market Value by Country, Mineralized Allograft Market, Europe, 2021 – 2031 (US$M)
Figure 6‑23: Demineralized Bone Matrix Allograft Market, Europe, 2021 – 2031
Figure 6‑24: Units Sold by Country, Demineralized Bone Matrix Allograft Market, Europe, 2021 – 2031
Figure 6‑25: Average Selling Price by Country, Demineralized Bone Matrix Allograft Market, Europe, 2021 – 2031 (€)
Figure 6‑26: Average Selling Price by Country, Demineralized Bone Matrix Allograft Market, Europe, 2021 – 2031 (US$)
Figure 6‑27: Market Value by Country, Demineralized Bone Matrix Allograft Market, Europe, 2021 – 2031 (€M)
Figure 6‑28: Market Value by Country, Demineralized Bone Matrix Allograft Market, Europe, 2021 – 2031 (US$M)
Figure 6‑29: Xenograft Market, Europe, 2021 – 2031
Figure 6‑30: Units Sold by Country, Xenograft Market, Europe, 2021 – 2031
Figure 6‑31: Average Selling Price by Country, Xenograft Market, Europe, 2021 – 2031 (€)
Figure 6‑32: Average Selling Price by Country, Xenograft Market, Europe, 2021 – 2031 (US$)
Figure 6‑33: Market Value by Country, Xenograft Market, Europe, 2021 – 2031 (€M)
Figure 6‑34: Market Value by Country, Xenograft Market, Europe, 2021 – 2031 (US$M)
Figure 6‑35: Synthetic Market, Europe, 2021 – 2031
Figure 6‑36: Units Sold by Country, Synthetic Market, Europe, 2021 – 2031
Figure 6‑37: Average Selling Price by Country, Synthetic Market, Europe, 2021 – 2031 (€)
Figure 6‑38: Average Selling Price by Country, Synthetic Market, Europe, 2021 – 2031 (US$)
Figure 6‑39: Market Value by Country, Synthetic Market, Europe, 2021 – 2031 (€M)
Figure 6‑40: Market Value by Country, Synthetic Market, Europe, 2021 – 2031 (US$M)
Figure 6‑41: DBGS Units Sold by Application, Europe, 2021 – 2031
Figure 6‑42: DBGS Units Sold by Country, Socket Preservation, Europe, 2021 – 2031
Figure 6‑43: DBGS Units Sold by Country, Sinus Augmentation, Europe, 2021 – 2031
Figure 6‑44: DBGS Units Sold by Country, Ridge Augmentation, Europe, 2021 – 2031
Figure 6‑45: DBGS Units Sold by Country, Periodontal Application, Europe, 2021 – 2031
Figure 6‑46: Leading Competitors, Dental Bone Graft Substitute Market, Europe, 2024
Figure 6‑47: Leading Competitors by Country, Dental Bone Graft Substitute Market, Europe, 2024
Figure 7‑1: Dental Growth Factor Market, Europe, 2021 – 2031
Figure 7‑2: Units Sold by Country, Dental Growth Factor Market, Europe, 2021 – 2031
Figure 7‑3: Average Selling Price by Country, Dental Growth Factor Market, Europe, 2021 – 2031 (€)
Figure 7‑4: Average Selling Price by Country, Dental Growth Factor Market, Europe, 2021 – 2031 (US$)
Figure 7‑5: Market Value by Country, Dental Growth Factor Market, Europe, 2021 – 2031 (€M)
Figure 7‑6: Market Value by Country, Dental Growth Factor Market, Europe, 2021 – 2031 (US$M)
Figure 8‑1: Dental Barrier Membrane Market by Segment, Europe, 2021 – 2031 (€M)
Figure 8‑2: Dental Barrier Membrane Market by Segment, Europe, 2021 – 2031 (US$M)
Figure 8‑3: Dental Barrier Membrane Market, Europe, 2021 – 2031
Figure 8‑4: Units Sold by Country, Dental Barrier Membrane Market, Europe, 2021 – 2031
Figure 8‑5: Average Selling Price by Country, Dental Barrier Membrane Market, Europe, 2021 – 2031 (€)
Figure 8‑6: Average Selling Price by Country, Dental Barrier Membrane Market, Europe, 2021 – 2031 (US$)
Figure 8‑7: Market Value by Country, Dental Barrier Membrane Market, Europe, 2021 – 2031 (€M)
Figure 8‑8: Market Value by Country, Dental Barrier Membrane Market, Europe, 2021 – 2031 (US$M)
Figure 8‑9: Resorbable Dental Barrier Membrane Market, Europe, 2021 – 2031
Figure 8‑10: Units Sold by Country, Resorbable Dental Barrier Membrane Market, Europe, 2021 – 2031
Figure 8‑11: Average Selling Price by Country, Resorbable Dental Barrier Membrane Market, Europe, 2021 – 2031 (€)
Figure 8‑12: Average Selling Price by Country, Resorbable Dental Barrier Membrane Market, Europe, 2021 – 2031 (US$)
Figure 8‑13: Market Value by Country, Resorbable Dental Barrier Membrane Market, Europe, 2021 – 2031 (€M)
Figure 8‑14: Market Value by Country, Resorbable Dental Barrier Membrane Market, Europe, 2021 – 2031 (US$M)
Figure 8‑15: Non-Resorbable Dental Barrier Membrane Market, Europe, 2021 – 2031
Figure 8‑16: Units Sold by Country, Non-Resorbable Dental Barrier Membrane Market, Europe, 2021 – 2031
Figure 8‑17: Average Selling Price by Country, Non-Resorbable Dental Barrier Membrane Market, Europe, 2021 – 2031 (€)
Figure 8‑18: Average Selling Price by Country, Non-Resorbable Dental Barrier Membrane Market, Europe, 2021 – 2031 (US$)
Figure 8‑19: Market Value by Country, Non-Resorbable Dental Barrier Membrane Market, Europe, 2021 – 2031 (€M)
Figure 8‑20: Market Value by Country, Non-Resorbable Dental Barrier Membrane Market, Europe, 2021 – 2031 (US$M)
Figure 8‑21: Resorbable Dental Barrier Membrane Market by Size, Europe, 2021 – 2031
Figure 8‑22: Units Sold by Country, Small Resorbable Dental Barrier Membrane Market, Europe, 2021 – 2031
Figure 8‑23: Units Sold by Country, Medium Resorbable Dental Barrier Membrane Market, Europe, 2021 – 2031
Figure 8‑24: Units Sold by Country, Large Resorbable Dental Barrier Membrane Market, Europe, 2021 – 2031
Figure 8‑25: Non-Resorbable Dental Barrier Membrane Market by Size, Europe, 2021 – 2031
Figure 8‑26: Units Sold by Country, Small Resorbable Dental Barrier Membrane Market, Europe, 2021 – 2031
Figure 8‑27: Units Sold by Country, Medium Resorbable Dental Barrier Membrane Market, Europe, 2021 – 2031
Figure 8‑28: Units Sold by Country, Large Resorbable Dental Barrier Membrane Market, Europe, 2021 – 2031
Figure 8‑29: Leading Competitors, Dental Barrier Membrane Market, Europe, 2024
Figure 9‑1: Local Antimicrobial Periodontal Treatment Market, Europe, 2021 – 2031
Figure 9‑2: Leading Competitors, Local Antimicrobial Periodontal Treatment Market, Europe, 2024
Figure 10‑1: Total Dental Soft Tissue Regeneration Market, Europe, 2021 – 2031
Figure 10‑2: Dental Soft Tissue Regeneration Market by Segment, Europe, 2021 – 2031 (€M)
Figure 10‑3: Dental Soft Tissue Regeneration Market by Segment, Europe, 2021 – 2031 (US$M)
Figure 10‑4: Dental Soft Tissue Regeneration Market, Europe, 2021 – 2031
Figure 10‑5: Units Sold by Country, Dental Soft Tissue Regeneration Market, Europe, 2021 – 2031
Figure 10‑6: Average Selling Price by Country, Dental Soft Tissue Regeneration Market, Europe, 2021 – 2031 (€)
Figure 10‑7: Average Selling Price by Country, Dental Soft Tissue Regeneration Market, Europe, 2021 – 2031 (US$)
Figure 10‑8: Market Value by Country, Dental Soft Tissue Regeneration Market, Europe, 2021 – 2031 (€M)
Figure 10‑9: Market Value by Country, Dental Soft Tissue Regeneration Market, Europe, 2021 – 2031 (US$M)
Figure 10‑10: Dental Wound Care Market by Segment, Europe, 2021 – 2031 (€M)
Figure 10‑11: Dental Wound Care Market by Segment, Europe, 2021 – 2031 (US$M)
Figure 10‑12: Dental Wound Care Market, Europe, 2021 – 2031
Figure 10‑13: Plug Dental Wound Care Market, Europe, 2021 – 2031
Figure 10‑14: Units Sold by Country, Plug Dental Wound Care Market, Europe, 2021 – 2031
Figure 10‑15: Average Selling Price by Country, Plug Dental Wound Care Market, Europe, 2021 – 2031 (€)
Figure 10‑16: Average Selling Price by Country, Plug Dental Wound Care Market, Europe, 2021 – 2031 (US$)
Figure 10‑17: Market Value by Country, Plug Dental Wound Care Market, Europe, 2021 – 2031 (€M)
Figure 10‑18: Market Value by Country, Plug Dental Wound Care Market, Europe, 2021 – 2031 (US$M)
Figure 10‑19: Tape Dental Wound Care Market, Europe, 2021 – 2031
Figure 10‑20: Units Sold by Country, Tape Dental Wound Care Market, Europe, 2021 – 2031
Figure 10‑21: Average Selling Price by Country, Plug Dental Wound Care Market, Europe, 2021 – 2031 (€)
Figure 10‑22: Average Selling Price by Country, Plug Dental Wound Care Market, Europe, 2021 – 2031 (US$)
Figure 10‑23: Market Value by Country, Plug Dental Wound Care Market, Europe, 2021 – 2031 (€M)
Figure 10‑24: Market Value by Country, Plug Dental Wound Care Market, Europe, 2021 – 2031 (US$M)
Figure 10‑25: Foam Dental Wound Care Market, Europe, 2021 – 2031
Figure 10‑26: Units Sold by Country, Foam Dental Wound Care Market, Europe, 2021 – 2031
Figure 10‑27: Average Selling Price by Country, Plug Dental Wound Care Market, Europe, 2021 – 2031 (€)
Figure 10‑28: Average Selling Price by Country, Plug Dental Wound Care Market, Europe, 2021 – 2031 (US$)
Figure 10‑29: Market Value by Country, Plug Dental Wound Care Market, Europe, 2021 – 2031 (€M)
Figure 10‑30: Market Value by Country, Plug Dental Wound Care Market, Europe, 2021 – 2031 (US$M)
Figure 10‑31: Leading Competitors, Dental Soft Tissue Regeneration Market, Europe, 2024

iData’s 9-Step Research Methodology

Our reports follow an in-depth 9-step methodology which focuses on the following research systems:

  • Original primary research that consists of the most up-to-date market data
  • Strong foundation of quantitative and qualitative research
  • Focused on the needs and strategic challenges of the industry participants

Step 1: Project Initiation & Team Selection During this preliminary investigation, all staff members involved in the industry discusses the topic in detail.

Step 2: Prepare Data Systems and Perform Secondary Research The first task of the research team is to prepare for the data collection process: Filing systems and relational databases are developed as needed.

Step 3: Preparation for Interviews & Questionnaire Design The core of all iData research reports is primary market research. Interviews with industry insiders represent the single most reliable way to obtain accurate, current data about market conditions, trends, threats and opportunities.

Step 4: Performing Primary Research At this stage, interviews are performed using contacts and information acquired in the secondary research phase.

Step 5: Research Analysis: Establishing Baseline Estimates Following the completion of the primary research phase, the collected information must be synthesized into an accurate view of the market status. The most important question is the current state of the market.

Step 6: Market Forecast and Analysis iData Research uses a proprietary method to combine statistical data and opinions of industry experts to forecast future market values.

Step 7: Identify Strategic Opportunities iData analysts identify in broad terms why some companies are gaining or losing share within a given market segment.

Step 8: Final Review and Market Release An integral part of the iData research methodology is a built-in philosophy of quality control and continuing improvement is integral to the iData philosophy.

Step 9: Customer Feedback and Market Monitoring iData philosophy of continuous improvement requires that reports and consulting projects be monitored after release for customer feedback and market accuracy.

Click Here to Read More About Our Methodology